Categories
Uncategorized

Learning about Polynomial Regression – Regularization Techniques Explained

Understanding Polynomial Regression

Polynomial regression extends linear regression by introducing higher-degree terms, allowing for the modeling of nonlinear relationships.

This technique captures patterns in data that linear models might miss, offering a more flexible framework for prediction.

Key Concepts Behind Polynomial Regression

Polynomial regression fits a relationship between a dependent variable and an independent variable using an nth-degree polynomial. The equation can be represented as:

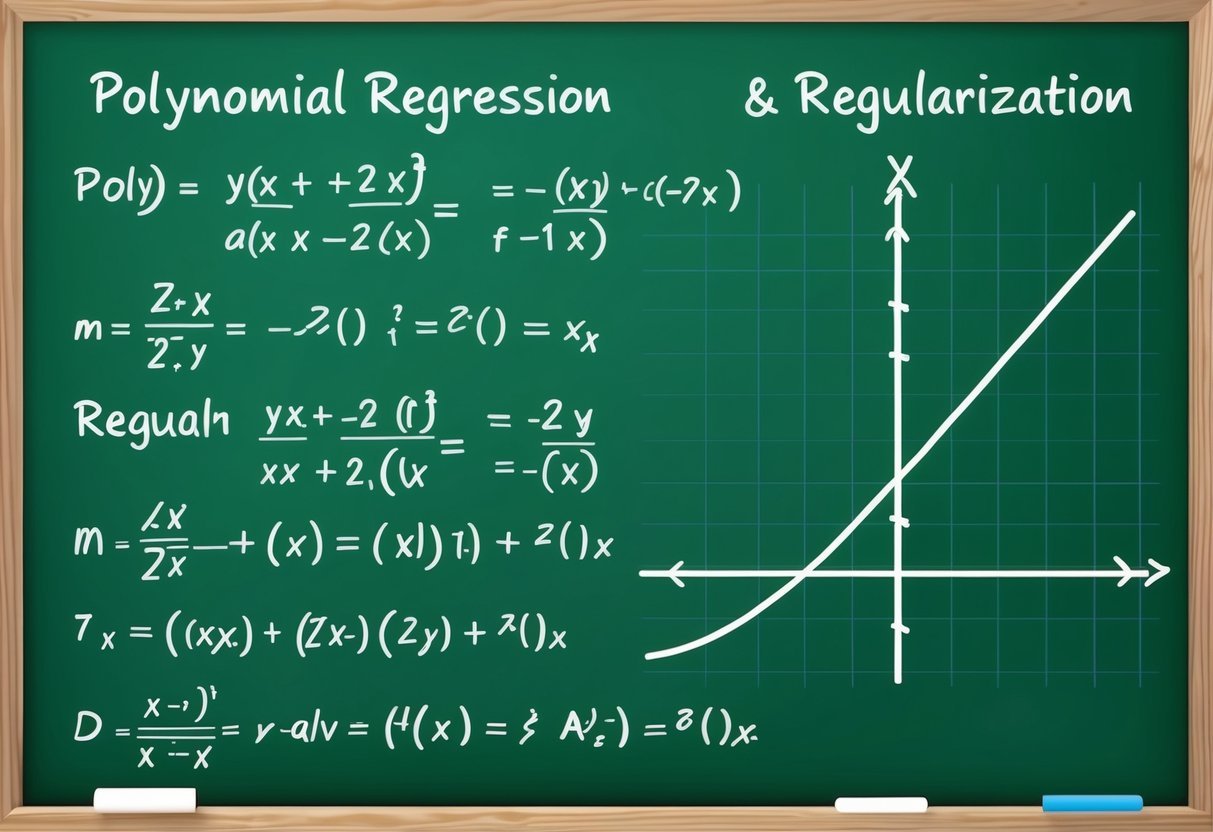
y = β₀ + β₁x + β₂x² + … + βₙxⁿ

In this equation, y is the dependent variable, x is the independent variable, and the coefficients (β₀, β₁, β₂, …, βₙ) are determined through training.

These coefficients help the model capture complex patterns. More degrees introduce more polynomial terms, allowing the model to adjust and fit the data more accurately.

Regularization techniques like Ridge or Lasso can help prevent overfitting by controlling the complexity of the polynomial model.

Differences Between Linear and Polynomial Regression

Linear regression assumes a straight-line relationship between variables, while polynomial regression allows for curved patterns. The key difference is the flexibility in capturing the data’s trends.

In linear regression, predictions are made by fitting the best line through the dataset using a first-degree polynomial.

Polynomial regression, on the other hand, involves adding higher power terms like x², x³, etc., to the equation, which introduces curvature. This helps in modeling datasets where the relationship between variables is not just linear but involves some non-linear tendencies, improving the model’s accuracy in such cases.

The Need for Regularization

Regularization is crucial to ensure that machine learning models perform well on new data. It addresses key issues that can arise during model training, especially overfitting and the bias-variance tradeoff.

Preventing Overfitting in Model Training

Overfitting happens when a model learns the noise in the training data too well. It performs with high accuracy on the training set but poorly on unseen data. This occurs because the model is too complex for the task at hand.

Regularization techniques, such as L1 and L2 regularization, help mitigate overfitting by adding a penalty for using large coefficients.

For example, ridge regression implements L2 regularization to keep model weights small, reducing complexity and maintaining performance on new data.

By controlling overfitting, regularization helps create models that generalize better, leading to more accurate predictions on different datasets.

Balancing Bias and Variance Tradeoff

The bias-variance tradeoff is a critical concept in model training. High bias can cause models to be too simple, missing important patterns and exhibiting underfitting. Conversely, high variance makes models too complex, leading to overfitting.

Regularization helps to achieve the right balance between bias and variance. Techniques like polynomial regression with regularization adjust the model complexity.

By introducing a penalty to complexity, regularization reduces high variance while ensuring the model does not become too biased. This tradeoff allows for optimal model performance, capturing essential patterns without becoming overly sensitive to training data noise.

Core Principles of Regularization Techniques

Regularization techniques are essential for reducing overfitting in machine learning models. These techniques help balance simplicity and accuracy by adding a penalty term to the cost function, ensuring the model remains generalizable to new data.

Understanding L1 and L2 Regularization

L1 and L2 regularization are two widely used techniques to constrain model complexity.

L1 regularization, or Lasso, adds an absolute value penalty to the loss function, which can lead to sparse models by driving some weights to zero.

L2 regularization, known as Ridge regression, adds a squared magnitude penalty to the loss function.

It helps in controlling multicollinearity and prevents coefficients from becoming too large by shrinking them evenly, which is beneficial for situations where all input features are expected to be relevant.

This technique makes the model more stable and reduces variance, leading to better performance on unseen data.

More insights into this can be found in the concept of ridge regression.

Insights into Elastic Net Regularization

Elastic Net combines both L1 and L2 penalties in its regularization approach.

This technique is particularly useful when dealing with datasets with numerous correlated features.

The combination allows Elastic Net to handle scenarios where Lasso might select only one feature from a group of correlated ones, while Ridge would include all, albeit small, coefficients.

Elastic Net effectively balances feature reduction with generalization by tuning two hyperparameters: one for the L1 ratio and another for the strength of the penalty.

It is especially useful in high-dimensional datasets where the number of predictors exceeds the number of observations.

This makes Elastic Net a flexible and powerful tool, incorporating strengths from both L1 and L2 regularization while mitigating their individual weaknesses.

Exploring L1 Regularization: Lasso Regression

Lasso regression is a type of linear regression that uses L1 regularization to prevent overfitting. This technique adds a penalty to the model’s coefficient estimates. It encourages the model to reduce the importance of less relevant features by setting their coefficients to zero.

L1 regularization, also known as lasso regularization, involves a penalty term based on the L1 norm. This penalty is the sum of the absolute values of the coefficients. As a result, feature selection is effectively performed during model training.

In the context of machine learning, lasso regression is valued for its simplicity and ability to handle situations where only a few features are relevant.

By making some coefficients zero, it automates the selection of the most important features, helping to simplify the model.

The selection of specific features is influenced by the regularization parameter, which controls the strength of the penalty. A larger penalty makes the model more sparse by zeroing out more coefficients, thus performing stricter feature selection.

Overall, lasso regression is a powerful tool when the goal is to create a simpler model that still captures the essential patterns in the data. By focusing only on the most impactful variables, it helps create models that are easier to interpret and apply successfully in various contexts.

Exploring L2 Regularization: Ridge Regression

Ridge regression, also known as L2 regularization, adds a penalty to the sum of the squared coefficients. This penalty term helps prevent overfitting by discouraging overly complex models. By including this penalty, ridge regression can improve the model’s performance on unseen data.

The penalty term is defined as the L2 norm of the coefficients, represented as (||w||_2^2). The inclusion of this term slightly alters the linear regression formula, introducing a regularization strength parameter, often denoted by (lambda). A higher value for (lambda) means stronger regularization.

Term Description
Ridge Regression A type of linear regression that includes L2 regularization.
L2 Norm The sum of the squares of coefficients, used as a penalty.
Penalty Term Adds regularization strength to limit model complexity.

In machine learning, ridge regression is popular for its ability to handle multicollinearity—where predictor variables are highly correlated. This trait makes it suitable for datasets with many features, reducing the variance of estimates.

Ridge regularization is particularly useful when fitting polynomial models. These models often risk overfitting, but ridge regression effectively controls this by penalizing large coefficients. Thus, it helps in balancing the bias-variance trade-off, ensuring a more reliable model performance.

When implemented correctly, ridge regression provides a robust approach to model fitting. Its incorporation of L2 regularization ensures that even complex data can be approached with confidence, supporting accurate predictions and reliable results. Explore more about ridge regression on IBM’s Ridge Regression page.

Combined Approaches: Elastic Net Regression

Elastic Net Regression is a hybrid technique that merges the strengths of two methods: L1 and L2 regularization. This combination aims to enhance the ability to handle datasets with many features, some of which might be irrelevant.

These regularizations apply penalties to the model’s coefficients. The L1 norm, from Lasso, promotes sparsity by shrinking some coefficients to zero. The L2 norm, from Ridge, ensures smaller but complex coefficient adjustments.

The Elastic Net model incorporates both norms through a weighted parameter, allowing a flexible mix. The parameter controls how much of each regularization to apply. This can be adjusted to suit specific training data needs.

A valuable feature of Elastic Net is its ability to reduce overfitting by controlling large coefficients. This results in a smoother prediction curve. This approach is beneficial when working with datasets that contain multicollinearity, where features are highly correlated.

Here’s a simple representation:

Regularization Type Penalty Effect on Coefficients
L1 (Lasso) |β| Promotes sparsity
L2 (Ridge) |β|² Shrinks coefficients smoothly
Elastic Net α|β| + (1-α)|β|² Combines both effects

The choice between L1, L2, or their combination depends on specific project goals and the nature of the data involved. Adjusting the combination allows modeling to be both robust and adaptable, improving prediction accuracy.

Optimizing Model Performance

To enhance the performance of a polynomial regression model, two key areas to focus on are tuning hyperparameters and managing the balance between feature coefficients and model complexity. Each plays a crucial role in ensuring a model fits well to the data without overfitting or underfitting.

Tuning Hyperparameters for Best Results

Hyperparameters are settings that need to be set before training a model and can significantly affect model performance. These include parameters like the degree of the polynomial and regularization strength.

Adjusting these parameters helps control the balance between fitting the training dataset and generalizing to test data.

For polynomial regression, selecting the appropriate polynomial degree is critical. A high degree might lead to overfitting, while a low degree could cause underfitting.

Using techniques like cross-validation helps in choosing the best hyperparameters.

Additionally, regularization parameters such as those used in ridge regression can fine-tune how much penalty is applied to complex models, ensuring the feature coefficients remain suitable.

Feature Coefficients and Model Complexity

Feature coefficients indicate the model’s sensitivity to each feature, influencing predictions. Managing these helps in reducing model complexity and improving generalization.

Regularization techniques like L1 (Lasso) or L2 (Ridge) introduce penalties that limit the size of coefficients. This can prevent the model from becoming too complex.

Keeping feature coefficients small often leads to simpler models that perform well on test data. Complexity should align with the quality of the data to avoid fitting noise from the training data.

Understanding these aspects ensures that models remain effective and robust when faced with different datasets. Regularization methods also help in managing large numbers of features by encouraging sparsity or smoothness.

Quantifying Model Accuracy

Quantifying how accurately a model predicts outcomes involves using specific metrics to assess performance.

These metrics help determine how well a model is learning and if it generalizes well to new data.

Loss Functions and Cost Function

A loss function measures how far predictions deviate from actual outcomes for a single data point. It calculates the difference between the predicted and true values.

Loss functions guide model training by updating parameters to minimize error.

The cost function, on the other hand, summarizes the total error over all data points. It is often the average of individual losses in the dataset.

By minimizing the cost function, a model increases its overall predictive accuracy.

Common loss functions include the mean squared error and the squared error, both of which penalize larger errors more heavily than smaller ones.

Mean Squared Error and Squared Error

Squared error is a simple measure of error for a single data point. It is the squared difference between the predicted value and the actual value.

This squaring process emphasizes larger errors.

The mean squared error (MSE) expands on squared error by averaging these squared differences across all predictions.

MSE provides a single value that quantifies the model’s accuracy over the entire dataset.

In practice, MSE is widely used due to its ability to highlight models that make significant errors and has easy-to-compute derivatives that aid in the optimization of predictions.

Practical Applications of Polynomial Regression

Polynomial regression is widely used in various fields due to its ability to model complex, nonlinear relationships.

This section explores its uses in finance and engineering, highlighting specific applications where this technique is particularly beneficial.

Polynomial Regression in Finance

In finance, polynomial regression helps in analyzing trends and forecasting.

Financial markets are often influenced by nonlinear patterns, and this method captures these intricacies better than simple linear models.

For instance, it is used to predict stock price movements by considering factors like unemployment rates and GDP growth.

Also, it aids in risk management by modeling the nonlinear relationship between different financial indicators.

This approach assists in constructing portfolios that optimize risk and return, making it valuable for financial analysts and portfolio managers.

Use Cases in Engineering and Science

In engineering, polynomial regression is applied to model relationships between variables in mechanical systems, such as stress and strain analysis.

This helps in predicting system behavior under different conditions, which is crucial for design and safety assessments.

Science fields often rely on this regression to study phenomena where variables interact in complex ways.

For example, environmental science utilizes it to analyze climate data and forecast future trends.

Additionally, engineering and science tasks, such as optimizing materials for durability or predicting chemical reactions, benefit from its capacity to identify patterns in experimental data, providing deeper insights into material properties and reaction outcomes.

Machine Learning Algorithms and Regularization

Regularization is a key technique in machine learning to improve model generalization.

It helps reduce overfitting by adding a penalty term to the model’s loss function. This encourages simpler models with smaller coefficients, promoting stability across various datasets.

Types of Regularization:

  1. L1 Regularization (Lasso): Adds the sum of the absolute values of coefficients to the loss function. It can result in sparse models, where some coefficients become zero.

  2. L2 Regularization (Ridge): Includes the sum of the squared values of coefficients in the loss function, effectively shrinking them but rarely making them zero.

These regularization techniques are crucial for algorithms like linear regression, support vector machines, and neural networks.

Models that are too complex tend to fit noise in training data, which harms their predictive performance on new data.

Overfitting happens when a machine learning algorithm learns patterns that exist only in the training data.

Regularization helps models find the right balance, ensuring they perform well not just on the training set but also on unseen data.

In polynomial regression, without regularization, high-degree polynomials can easily overfit, capturing fluctuations in data that don’t represent real patterns.

By applying regularization, these models become more robust, enhancing their generalization capabilities.

Software Implementations and Code Examples

A computer screen displaying code examples for polynomial regression with regularization, surrounded by books and notes on software implementations

Polynomial regression involves using different Python libraries to fit polynomial models, often alongside regularization techniques to prevent overfitting. These tools offer functions and methods to simplify the coding process.

Python Libraries for Polynomial Regression

When working with polynomial regression in Python, the scikit-learn library is highly recommended.

It offers the PolynomialFeatures method, which is used to transform the input data to include polynomial combinations of features. This is crucial for crafting polynomial models.

The LinearRegression function can be used to fit the model after transforming the data.

By combining these tools, users can construct polynomial regression models efficiently.

Practical Python code snippets with scikit-learn demonstrate how to build and evaluate these models.

Other libraries like numpy and pandas assist with data manipulation and preparation.

For more in-depth understanding and other algorithm options, resources like GeeksforGeeks provide thorough guides.

Applying Regularization in Python

Regularization is a technique used to improve model performance by adding penalties to the model coefficients.

In Python, scikit-learn provides the Ridge and Lasso classes for regularization purposes.

These are integrated into the polynomial regression process to control overfitting.

Using Ridge, also known as L2 regularization, adds a penalty to the loss function that is proportional to the square of the coefficients. This encourages the shrinking of coefficients, enhancing model reliability.

Example: After creating polynomial features, apply Ridge along with the transformed data to fit a regularized polynomial regression model.

Resources such as this GeeksforGeeks article provide more details and code examples.

Advanced Topics in Model Development

A chalkboard filled with equations and graphs related to polynomial regression and regularization

In-depth work on model development involves tackling complex issues like multicollinearity and optimizing algorithms through gradient descent. These topics are crucial for enhancing the accuracy and reliability of polynomial regression models, especially when dealing with real-world data.

Addressing Multicollinearity

Multicollinearity occurs when two or more predictor variables in a regression model are highly correlated. This can distort the results and make it difficult to determine the effect of each variable.

One way to address this is through regularization techniques such as ridge regression, which penalizes large coefficients and helps prevent overfitting.

Another approach is to use variance inflation factor (VIF) to identify and remove or combine correlated predictors.

A simpler model may result in better performance. Ensuring diverse data sources can also help minimize multicollinearity.

Techniques like principal component analysis (PCA) can be employed to reduce dimensionality, thus making the model more robust.

Gradient Descent and Tuning Parameters

Gradient descent is a crucial optimization algorithm used for finding the minimum of a function, often employed in regression analysis to optimize coefficients.

The learning rate is a critical tuning parameter that dictates the step size taken during each iteration of gradient descent.

Choosing the right learning rate is essential; a rate too high can cause overshooting, while one too low can slow convergence.

Adaptive methods like AdaGrad and RMSProp adjust the learning rate dynamically, enhancing efficiency.

Other tuning parameters can include the number of iterations and initializing weights.

Properly tuning these parameters can significantly improve model accuracy and convergence speed.

Frequently Asked Questions

A chalkboard with a graph of polynomial regression, surrounded by scattered papers and a computer displaying code for regularization

Polynomial regression with regularization involves techniques like L1 and L2 regularization to improve model performance. It is applied in various real-world scenarios, and selecting the right polynomial degree is crucial to avoid overfitting.

What does L2 regularization entail in the context of polynomial regression models?

L2 regularization, also known as ridge regression, adds a penalty equal to the square of the magnitude of coefficients to the loss function.

This technique helps to prevent overfitting by discouraging overly complex models, thus keeping the coefficient values small.

Can you elaborate on the concept and mathematics behind polynomial regression?

Polynomial regression is an extension of linear regression where the relationship between the independent variable and the dependent variable is modeled as an nth degree polynomial.

It involves fitting a curve to the data points by minimizing the error term in the polynomial equation.

What strategies are effective in preventing overfitting when using polynomial regression?

To prevent overfitting in polynomial regression, it’s important to choose the appropriate degree for the polynomial.

Using regularization techniques like L1 or L2 can also help. Cross-validation is another effective strategy to ensure the model generalizes well to unseen data.

In what real-world scenarios is polynomial regression commonly applied?

Polynomial regression is used in various fields such as finance for modeling stock trends and in environmental studies for analyzing temperature changes over time.

It is also applied in biology to model population growth and in engineering for material stress analysis.

How does the choice of polynomial degree affect the model’s performance?

The degree of the polynomial affects both bias and variance in the model.

A low degree can cause high bias and underfitting, while a high degree can lead to high variance and overfitting.

Finding a balance is crucial for achieving optimal model performance.

What are the differences between L1 and L2 regularization techniques in polynomial regression?

L1 regularization, or Lasso, adds an absolute value penalty to the loss function, which can lead to sparse models by driving some coefficients to zero.

L2 regularization, or Ridge regression, penalizes the square of the coefficient magnitudes, promoting smaller coefficients but not necessarily zero.

Categories
General Data Science

Entry-Level Data Scientist: What Should You Know?

The role of an entry-level data scientist is both challenging and rewarding. Individuals in this position are at the forefront of extracting insights from large volumes of data.

Their work involves not only technical prowess but also a good understanding of the businesses or sectors they serve.

At this level, developing a blend of skills in programming, mathematics, data visualization, and domain knowledge is essential.

Their efforts support decision-making and can significantly impact the success of their organization.

A desk with a computer, data charts, and a whiteboard with algorithms and equations

Understanding the balance between theory and practical application is key for new data scientists.

They are often expected to translate complex statistical techniques into actionable business strategies.

Entry-level data scientists must be able to communicate findings clearly to stakeholders who may not have technical expertise.

Moreover, they should possess the ability to manage data—organizing, cleaning, and ensuring its integrity— which plays a critical role in the accuracy and reliability of their analyses.

Key Takeaways

  • Entry-level data scientists must combine technical skills with business acumen.
  • Clear communication of complex data findings is essential for organizational impact.
  • Integrity and management of data underpin reliable and actionable analytics.
  1. Python/R programming – Understand syntax, data structures, and package management; apply to data manipulation and analysis; sources: Codecademy, Coursera, DataCamp.
  2. Statistical analysis – Grasp probability, inferential statistics, and hypothesis testing; apply in data-driven decision-making; sources: Khan Academy, edX, Stanford Online.
  3. Data wrangling – Learn to clean and preprocess data; apply by transforming raw data into a usable format; sources: Data School, Kaggle, Udacity.
  4. SQL – Acquire knowledge of databases, querying, and data extraction; apply in data retrieval for analysis; sources: SQLZoo, Mode Analytics, W3Schools.
  5. Data visualization – Understand principles of visualizing data; apply by creating understandable graphs and charts; sources: D3.js, Tableau Public, Observable.
  6. Machine learning basics – Comprehend algorithms and their application; apply to predictive modeling; sources: Scikit-learn documentation, Google’s Machine Learning Crash Course, Fast.ai.
  7. Version control – Become familiar with Git and repositories; apply in collaboration and code sharing; sources: GitHub Learning Lab, Bitbucket, Git Book.
  8. Big data platforms – Understand Hadoop, Spark, and their ecosystems; apply to processing large datasets; sources: Cloudera training, Apache Online Classes, DataBricks.
  9. Cloud Computing – Learn about AWS, Azure, and Google Cloud; apply to data storage and compute tasks; sources: AWS Training, Microsoft Learn, Google Cloud Training.
  10. Data ethics – Understand privacy, security, and ethical considerations; apply to responsible data practice; sources: freeCodeCamp, EDX Ethics in AI and Data Science, Santa Clara University Online Ethics Center.
  11. A/B testing – Comprehend setup and analysis of controlled experiments; apply in product feature evaluation; sources: Google Analytics Academy, Optimizely, Udacity.
  12. Algorithm design – Grasp principles of creating efficient algorithms; apply in optimizing data processes; sources: Khan Academy, Algorithms by Jeff Erickson, MIT OpenCourseWare.
  13. Predictive modeling – Understand model building and validation; apply to forecasting outcomes; sources: Analytics Vidhya, DataCamp, Cross Validated (Stack Exchange).
  14. NLP (Natural Language Processing) – Learn techniques to process textual data; apply in sentiment analysis and chatbots; sources: NLTK documentation, SpaCy, Stanford NLP Group.
  15. Data reporting – Comprehend design of reports and dashboards; apply in summarizing analytics for decision support; sources: Microsoft Power BI, Tableau Learning Resources, Google Data Studio.
  16. AI ethics – Understand fairness, accountability, and transparency in AI; apply to develop unbiased models; sources: Elements of AI, Fairlearn, AI Now Institute.
  17. Data mining – Grasp extraction of patterns from large datasets; apply to uncover insights; sources: RapidMiner Academy, Orange Data Mining, Weka.
  18. Data munging – Learn techniques for converting data; apply to format datasets for analysis; sources: Trifacta, Data Cleaning with Python Documentation, OpenRefine.
  19. Time series analysis – Understand methods for analyzing temporal data; apply in financial or operational forecasting; sources: Time Series Analysis by State Space Methods, Rob J Hyndman, Duke University Statistics.
  20. Web scraping – Acquire skills for extracting data from websites; apply in gathering online information; sources: BeautifulSoup documentation, Scrapy, Automate the Boring Stuff with Python.
  21. Deep learning – Understand neural networks and their frameworks; apply to complex pattern recognition; sources: TensorFlow Tutorials, PyTorch Tutorials, Deep Learning specialization on Coursera.
  22. Docker and containers – Learn about environment management and deployment; apply in ensuring consistency across computing environments; sources: Docker Get Started, Kubernetes.io, Play with Docker Classroom.
  23. Collaborative filtering – Grasp recommendation system techniques; apply in building systems suggesting products to users; sources: Coursera Recommendation Systems, GroupLens Research, TutorialsPoint.
  24. Business acumen – Gain insight into how businesses operate and make decisions; apply to align data projects with strategic goals; sources: Harvard Business Review, Investopedia, Coursera.
  25. Communication skills – Master the art of imparting technical information in an accessible way; apply in engaging with non-technical stakeholders; sources: Toastmasters International, edX Improving Communication Skills, LinkedIn Learning.

Fundamentals of Data Science

When entering the field of data science, there are crucial skills that an individual is expected to possess. These foundational competencies are essential for performing various data-related tasks effectively.

  1. Statistics: Understanding basic statistical measures, distributions, and hypothesis testing is crucial. Entry level data scientists apply these concepts to analyze data and inform conclusions. Sources: Khan Academy, Coursera, edX.
  2. Programming in Python: Familiarity with Python basics and libraries such as Pandas and NumPy is expected for manipulating datasets. Sources: Codecademy, Python.org, Real Python.
  3. Data Wrangling: The ability to clean and preprocess data is fundamental. They must handle missing values and outliers. Sources: Kaggle, DataCamp, Medium Articles.
  4. Database Management: Knowledge of SQL for querying databases helps in data retrieval. Sources: SQLZoo, W3Schools, Stanford Online.
  5. Data Visualization: Creating clear visualizations using tools like Matplotlib and Seaborn aids in data exploration and presentation. Sources: Tableau Public, D3.js Tutorials, FlowingData.
  6. Machine Learning: A basic grasp of machine learning techniques is necessary for building predictive models. Sources: Google’s Machine Learning Crash Course, Coursera, fast.ai.
  7. Big Data Technologies: An awareness of big data platforms such as Hadoop or Spark can be beneficial. Sources: Apache Foundation, Cloudera, DataBricks.
  8. Data Ethics: Understanding ethical implications of data handling, bias, and privacy. Sources: edX, Coursera, FutureLearn.
  9. Version Control: Familiarity with tools like Git for tracking changes in code. Sources: GitHub Learning Lab, Bitbucket Tutorials, Git Documentation.
  10. Communication: The ability to articulate findings to both technical and non-technical audiences is imperative. Sources: Toastmasters International, edX, Class Central.

The remaining skills include proficiency in algorithms, exploratory data analysis, reproducible research practices, cloud computing basics, collaborative teamwork, critical thinking, basic project management, time-series analysis, natural language processing basics, deep learning foundations, experimentation and A/B testing, cross-validation techniques, feature engineering, understanding of business acumen, and agility to adapt to new technologies. Each of these skills further anchor the transition from theoretical knowledge to practical application in a professional setting.

Educational Recommendations

For individuals aiming to launch a career in data science, a robust educational foundation is essential. Entrance into the field requires a grasp of specific undergraduate studies, relevant coursework, and a suite of essential data science skills.

Undergraduate Studies

Undergraduate education sets the groundwork for a proficient entry-level data scientist.

Ideally, they should hold a Bachelor’s degree in Data Science, Computer Science, Mathematics, Statistics, or a related field.

The degree program should emphasize practical skills and theoretical knowledge that are fundamental to data science.

Relevant Coursework

A strategic selection of university courses is crucial for preparing students for the data science ecosystem. Key areas to concentrate on include statistics, machine learning, data management, and programming. Courses should cover:

  • Statistical methods and probability
  • Algorithms and data structures
  • Database systems and data warehousing
  • Quantitative methods and modeling
  • Data mining and predictive analytics

Essential Data Science Skills

Entry-level data scientists are expected to be proficient in a range of technical and soft skills, which are itemized below:

  1. Programming in Python: Understanding of basic syntax, control structures, data types, and libraries like Pandas and NumPy. They should be able to manipulate and analyze data efficiently.
    • Resources: Codecademy, Kaggle, RealPython
  2. R programming: Knowledge of R syntax and the ability to perform statistical tests and create visualizations using ggplot2.
    • Resources: R-Bloggers, DataCamp, The R Journal
  3. Database Management: Ability to create and manage relational databases using SQL. Competence in handling SQL queries and stored procedures is expected.
    • Resources: SQLZoo, W3Schools, SQLite Tutorial
  4. Data Visualization: Capability to create informative visual representations of data using tools such as Tableau or libraries like Matplotlib and Seaborn.
    • Resources: Tableau Public, D3.js, FlowingData
  5. Machine Learning: Fundamental understanding of common algorithms like regression, decision trees, and k-nearest neighbors. They should know how to apply these in practical tasks.
    • Resources: Coursera, Fast.ai, Google’s Machine Learning Crash Course
  6. Statistical Analysis: Sound grasp of statistical concepts and the ability to apply them in hypothesis testing, A/B tests, and data exploration.
    • Resources: Khan Academy, Stat Trek, OpenIntro Statistics
  7. Data Cleaning: Proficiency in identifying inaccuracies and preprocessing data to ensure the quality and accuracy of datasets.
    • Resources: Data School, DataQuest, tidyverse
  8. Big Data Technologies: Familiarity with frameworks like Hadoop or Spark. They should understand how to process large data sets effectively.
    • Resources: Apache Foundation, edX, Big Data University
  9. Data Ethics: Understanding of privacy regulations and ethical considerations in data handling and analysis.
    • Resources: Data Ethics Canvas, Online Ethics Center, Future Learn
  10. Communication Skills: Ability to clearly convey complex technical findings to non-technical stakeholders using simple terms.
    • Resources: Toastmasters, Harvard’s Principles of Persuasion, edX
  11. Version Control Systems: Proficiency in using systems like Git to manage changes in codebase and collaborate with others.
    • Resources: GitHub, Bitbucket, Git Book
  12. Problem-Solving: Capacity for logical reasoning and abstract thinking to troubleshoot and solve data-related problems.
    • Resources: Project Euler, HackerRank, LeetCode
  13. Project Management: Basic understanding of project management principles to deliver data science projects on time and within scope.
    • Resources: Asana Academy, Scrum.org, Project Management Institute
  14. Time Series Analysis: Knowledge in analyzing time-stamped data and understanding patterns like seasonality.
    • Resources: Forecasting: Principles and Practice, Time Series Data Library, Duke University Statistics
  15. Natural Language Processing (NLP): Familiarity with text data and experience with techniques to analyze language data.
    • Resources: NLTK, Stanford NLP, spaCy
  16. Deep Learning: Introductory knowledge of neural networks and how to apply deep learning frameworks like TensorFlow or PyTorch.
    • Resources: DeepLearning.AI, Neural Networks and Deep Learning, MIT Deep Learning
  17. Business Intelligence: Understanding of how data-driven insights can be used for strategic decision making in business contexts.
    • Resources: Microsoft BI, IBM Cognos Analytics, Qlik
  18. A/B Testing: Competence in designing and interpreting A/B tests to draw actionable insights from experiments.
    • Resources: Google Optimize, Optimizely, The Beginner’s Guide to A/B Testing
  19. Data Warehousing: Understanding how to aggregate data from multiple sources into a centralized, consistent data store.
    • Resources: AWS Redshift, Oracle Data Warehousing, IBM Db2 Warehouse
  20. Scripting: Familiarity with writing scripts in Bash or another shell to automate repetitive data processing tasks.
    • Resources: Learn Shell, Shell Scripting Tutorial, Explain Shell
  21. Cloud Computing: Basic understanding of cloud services like AWS, Azure, or GCP for storing and processing data.
    • Resources: AWS Training and Certification, Microsoft Learn, GCP Training
  22. Agile Methodologies: Knowledge of agile approaches to enhance productivity and adaptability in project workflows.
    • Resources: Agile Alliance, Scrum Master Training, Agile in Practice
  23. Reproducibility: Ability to document data analysis processes well enough that they can be replicated by others.
    • Resources: Reproducibility Project, The Turing Way, Software Carpentry
  24. Ethical Hacking: Introductory skills to identify security vulnerabilities in data infrastructures to protect against cyber threats.
    • Resources: Cybrary, Hacker101, Offensive Security
  25. Soft Skills Development: Emotional intelligence, teamwork, adaptability, and continuous learning to thrive in various work environments.
    • Resources: LinkedIn Learning, MindTools, Future of Work Institute

Technical Skills

The success of an entry-level data scientist hinges on a strong foundation in technical skills. These skills enable them to extract, manipulate, and analyze data effectively, as well as develop models to derive insights from this data.

Programming Languages

An entry-level data scientist needs proficiency in at least one programming language used in data analysis.

Python and R are commonly sought after due to their powerful libraries and community support.

  1. Python: Expected to understand syntax, basic constructs, and key libraries like Pandas, NumPy, and SciPy.
  2. R: Required to comprehend data manipulation, statistical modeling, and package usage.

SQL and Data Management

Understanding SQL is critical to manage and query databases effectively.

  1. SQL: Knowledge of database schemas and the ability to write queries to retrieve and manipulate data.

Data Wrangling Tools

Data scientists often work with unstructured or complex data, making data wrangling tools vital.

  1. Pandas: Mastery of DataFrames, series, and data cleaning techniques.

Data Visualization

Ability to present data visually is a highly valued skill, with tools such as Tableau and libraries like Matplotlib in use.

  1. Matplotlib: Capability to create static, interactive, and animated visualizations in Python.

Machine Learning Basics

A foundational grasp of machine learning concepts is essential for building predictive models.

  1. Scikit-learn: Expected to utilize this library for implementing machine learning algorithms.

Non-Technical Skills

In the realm of data science, technical know-how is vital, yet non-technical skills are equally critical for an entry-level data scientist. These skills enable them to navigate complex work environments, effectively communicate insights, and collaborate with diverse teams.

Analytical Thinking

Analytical thinking involves the ability to critically assess data, spot patterns and interconnections, and process information to draw conclusions.

Entry-level data scientists need to possess a keen aptitude for breaking down complex problems and formulating hypotheses based on data-driven insights.

Communication Skills

Effective communication skills are essential for translating technical data insights into understandable terms for non-technical stakeholders.

They should be capable of crafting compelling narratives around data and presenting findings in a manner that drives decision-making.

Team Collaboration

The ability to collaborate within a team setting is fundamental in the field of data science.

Entry-level data scientists should be adept at working alongside professionals from various backgrounds. They should also contribute to team objectives and share knowledge to enhance project outcomes.

  1. SQL (Structured Query Language): Understand basic database querying for data retrieval. Apply this in querying databases to extract and manipulate data.
  2. Resources: W3Schools, SQLZoo, Khan Academy.
  3. Excel: Master spreadsheet manipulation and use of functions. Employ Excel for data analysis and visualization tasks.
  4. Resources: Excel Easy, GCFGlobal, Microsoft Tutorial.
  5. Python: Grasp fundamental Python programming for data analysis. Utilize Python in scripting and automating tasks.
  6. Resources: Codecademy, Real Python, PyBites.
  7. R Programming: Comprehend statistical analysis in R. Apply this in statistical modeling and data visualization.
  8. Resources: Coursera, R-bloggers, DataCamp.
  9. Data Cleaning: Understand techniques for identifying and correcting data errors. Apply this in preparing datasets for analysis.
  10. Resources: OpenRefine, Kaggle, Data Cleaning Guide.
  11. Data Visualization: Grasp the principles of visual representation of data. Employ tools like Tableau or Power BI for creating interactive dashboards.
  12. Resources: Tableau Training, Power BI Learning, FlowingData.
  13. Statistical Analysis: Understand foundational statistics and probability. Apply statistical methodologies to draw insights from data.
  14. Resources: Khan Academy, Stat Trek, OpenIntro Statistics.
  15. Machine Learning Basics: Comprehend the core concepts of machine learning algorithms. Utilize them in predictive modeling.
  16. Resources: Google’s Machine Learning Crash Course, fast.ai, Stanford Online.
  17. Critical Thinking: Develop the skill to evaluate arguments and data logically. Utilize this in assessing the validity of findings.
  18. Resources: FutureLearn, Critical Thinking Web, edX.
  19. Problem-Solving: Understand approaches to tackle complex problems efficiently. Apply structured problem-solving techniques in data-related scenarios.
  20. Resources: MindTools, ProjectManagement.com, TED Talks.
  21. Time Management: Master skills for managing time effectively. Apply this in prioritizing tasks and meeting project deadlines.
  22. Resources: Coursera, Time Management Ninja, Lynda.com.
  23. Organizational Ability: Understand how to organize work and files systematically. Employ this in managing data projects and documentation.
  24. Resources: Evernote, Trello, Asana.
  25. Project Management: Grasp the fundamentals of leading projects from initiation to completion. Utilize project management techniques in data science initiatives.
  26. Resources: PMI, Coursera, Simplilearn.
  27. Ethical Reasoning: Comprehend ethical considerations in data usage. Apply ethical frameworks when handling sensitive data.
  28. Resources: Santa Clara University’s Ethics Center, edX, Coursera.
  29. Business Acumen: Understand basic business principles and how they relate to data. Apply data insights to support business decisions.
  30. Resources: Investopedia, Harvard Business Review, Business Literacy Institute.
  31. Adaptability: Master the ability to cope with changes and learn new technologies quickly. Apply adaptability in evolving project requirements.
  32. Resources: Lynda.com, MindTools, Harvard Business Publishing.
  33. Attention to Detail: Notice nuances in data and analysis. Apply meticulous attention to ensure accuracy in data reports.
  34. Resources: Skillshare, American Management Association, Indeed Career Guide.
  35. Stakeholder Engagement: Understand techniques for effectively engaging with stakeholders. Employ these skills in gathering requirements and presenting data.
  36. Resources: Udemy, MindTools, PMI.
  37. Creative Thinking: Develop the ability to think outside the box for innovative solutions. Apply creativity in data visualization and problem-solving.
  38. Resources: Creativity at Work, TED Talks, Coursera.
  39. Negotiation Skills: Grasp the art of negotiation in a professional environment. Utilize negotiation tactics when arriving at data-driven solutions.
  40. Resources: Negotiation Experts, Coursera, Harvard Online.
  41. Client Management: Learn strategies for managing client expectations and relationships. Apply this in delivering data science projects.
  42. Resources: Client Management Mastery, HubSpot Academy, Lynda.com.
  43. Interpersonal Skills: Forge and maintain positive working relationships. Utilize empathy and emotional intelligence in teamwork.
  44. Resources: HelpGuide, Interpersonal Skills Courses, edX.
  45. Resilience: Cultivate the ability to bounce back from setbacks. Apply resilience in coping with challenging data projects.
  46. Resources: American Psychological Association, Resilience Training, TED Talks.
  47. Feedback Reception: Embrace constructive criticism to improve skills. Apply feedback to refine data analyses.
  48. Resources: MindTools, SEEK, Toastmasters International.
  49. Continuous Learning: Commit to ongoing education in the data science field. Apply this learning to stay current with industry advancements.
  50. Resources: Coursera, edX, DataCamp.

Job Market Overview

The demand for data scientists continues to grow as businesses seek to harness the power of data.

Entry-level positions are gateways into this dynamic field, requiring a diverse set of skills to analyze data and generate insights.

Industry Demand

The industry demand for data scientists has seen a consistent increase, primarily driven by the surge in data generation and the need for data-driven decision-making across all sectors.

Organizations are on the lookout for talents who can interpret complex data and translate it into actionable strategies.

As a result, the role of a data scientist has become critical, with companies actively seeking individuals who possess the right combination of technical prowess and analytical thinking.

The demand touches upon various industries such as finance, healthcare, retail, technology, and government sectors.

Each of these fields requires data scientists to not only have an in-depth understanding of data analysis but also the ability to glean insights pertinent to their specific industry needs.

Entry Level Positions

Entry-level positions for data scientists often serve as an introduction to the intricate world of data analysis, machine learning, and statistical modeling.

These roles typically focus on data cleaning, processing, and simple analytics tasks that lay the groundwork for more advanced analysis.

Employers expect these individuals to have a foundational grasp on certain key skills, which include:

  1. Statistical Analysis: Understanding probability distributions, statistical tests, and data interpretation methods.
    • Application: Designing and evaluating experiments to make data-driven decisions.
    • Resources: Khan Academy, Coursera, edX
  2. Programming Languages (primarily Python or R): Proficiency in writing efficient code for data manipulation and analysis.
    • Application: Automating data cleaning processes or building analysis models.
    • Resources: Codecademy, DataCamp, freeCodeCamp
  3. Data Wrangling: Ability to clean and prepare raw data for analysis.
    • Application: Transforming and merging data sets to draw meaningful conclusions.
    • Resources: Kaggle, DataQuest, School of Data
  4. Database Management: Good knowledge of SQL and NoSQL databases.
    • Application: Retrieving and managing data from various database systems.
    • Resources: SQLZoo, MongoDB University, W3Schools
  5. Data Visualization: Proficiency in tools like Tableau or Matplotlib to create informative visual representations of data.
    • Application: Conveying data stories and insights through charts and graphs.
    • Resources: Tableau Public, Python’s Matplotlib documentation, D3.js official documentation
  6. Machine Learning Basics: Understanding of core machine learning concepts and algorithms.
    • Application: Constructing predictive models and tuning them for optimal performance.
    • Resources: Google’s Machine Learning Crash Course, Andrew Ng’s Machine Learning on Coursera, fast.ai
  7. Big Data Technologies: Familiarity with frameworks like Hadoop or Spark.
    • Application: Processing large datasets to discover patterns or trends.
    • Resources: Apache official project documentation, LinkedIn Learning, Cloudera training
  8. Mathematics: Solid foundation in linear algebra, calculus, and discrete mathematics.
    • Application: Applying mathematical concepts to optimize algorithms or models.
    • Resources: MIT OpenCourseWare, Brilliant.org, Khan Academy
  9. Business Acumen: A basic understanding of how businesses operate and the role of data-driven decision-making.
    • Application: Tailoring analysis to support business objectives and strategies.
    • Resources: Harvard Business Review, Investopedia, Coursera’s Business Foundations

Building a Portfolio

A well-crafted portfolio demonstrates an entry-level data scientist’s practical skills and understanding of core concepts. It should clearly display their proficiency in data handling, analysis, and providing insightful solutions to real-world problems.

Personal Projects

Personal projects are a testament to a data scientist’s motivation and ability to apply data science skills.

They should showcase knowledge in statistical analysis, data cleaning, and visualization. When selecting projects, they should align with real data science problems, demonstrating the capability to extract meaningful insights from raw data.

It’s beneficial to choose projects that reflect different stages of the data science process, from initial data acquisition to modeling and interpretation of results.

Online Repositories

An online repository, like GitHub, serves as a dynamic resume for their coding and collaboration skills.

Entry-level data scientists should maintain clean, well-documented repositories with clear README files that guide viewers through their projects.

Repositories should illustrate their coding proficiency and their ability to utilize version control for project management.

Here is a breakdown of essential skills an entry-level data scientist should possess:

  1. Statistical Analysis: Understanding distributions, hypothesis testing, inferential statistics; applying this by interpreting data to inform decisions; sources: Khan Academy, Coursera, edX.
  2. Data Cleaning: Mastery in handling missing values, outliers, and data transformation; routinely preparing datasets for analysis; sources: DataCamp, Codecademy, Kaggle.
  3. Data Visualization: Ability to create informative visual representations of data; employing this by presenting data in an accessible way; sources: D3.js Documentation, Tableau Public, RAWGraphs.

Crafting a Resume

A person typing on a computer, surrounded by data charts and graphs, with a resume titled "Entry Level Data Scientist" on the screen

When venturing into the data science field, a well-crafted resume is the first step to securing an entry-level role.

It should succinctly display the candidate’s skills and relevant experiences.

Effective Resume Strategies

Creating an effective resume involves showcasing a blend of technical expertise and soft skills.

Applicants should tailor their resumes to the job description, emphasizing their most relevant experiences and skills in a clear, easy-to-read format.

Bullet points are helpful to list skills and accomplishments, with bold or italic text to emphasize key items.

A data scientist’s resume should be data-driven––include quantifiable results when possible to demonstrate the impact of your contributions.

Highlighting Relevant Experience

In Highlighting Relevant Experience, candidates must emphasize projects and tasks that have a direct bearing on a data scientist’s job.

It is crucial to detail experiences with data analysis, statistical modeling, and programming.

If direct experience is limited, related coursework, school projects, or online courses can also be included, as long as they are pertinent to the role.

  1. Statistical Analysis: Understanding descriptive and inferential statistics, candidates should apply this knowledge by interpreting data and drawing conclusions. Free resources include Khan Academy, Coursera, and edX.
  2. Programming Languages: Fluency in languages like Python or R is required. They are applied in data manipulation, statistical analysis, and machine learning tasks. Resources: Codecademy, SoloLearn, and DataCamp.
  3. Machine Learning: Familiarity with supervised and unsupervised learning models is essential. They use this knowledge by developing predictive models. Resources: Fast.ai, Coursera’s ‘Machine Learning’ course, and Google’s Machine Learning Crash Course.
  4. Data Visualization: Ability to create clear, insightful visual representations of data. Tableau Public, D3.js tutorials, and RawGraphs are useful resources.
  5. SQL: Knowing how to write queries to manipulate and extract data from relational databases. SQLZoo, Mode Analytics SQL Tutorial, and Khan Academy offer free SQL lessons.
  6. Data Wrangling: Cleaning and preparing data for analysis. This includes dealing with missing values and outliers. Resources: Data School’s Data Wrangling tutorials, Kaggle, and OpenRefine.
  7. Big Data Technologies: Understanding tools like Hadoop or Spark. They use them to manage and process large datasets. Resources: Hortonworks, Cloudera Training, and Apache’s own documentation.
  8. Version Control Systems: Knowledge of tools like Git for tracking changes in code. They apply this by maintaining a clean developmental history. Resources: GitHub Learning Lab, Bitbucket’s Tutorials, and Git’s own documentation.
  9. Data Ethics: Recognizing the ethical implications of data work. They incorporate ethical considerations into their analysis. Resources: Data Ethics Canvas, online ethics courses, and the Markkula Center for Applied Ethics.
  10. Bias & Variance Tradeoff: Understanding the balance between bias and variance in model training. They must avoid overfitting or underfitting models. Lessons from StatQuest, online course modules, and analytics tutorials can help.
  11. Probability: Grasping basic concepts in probability to understand models and random processes. Resources: Probability Course by Harvard Online Learning, MIT OpenCourseWare, and virtual textbooks.
  12. Exploratory Data Analysis (EDA): Ability to conduct initial investigations on data to discover patterns. Resources: DataCamp’s EDA courses, tutorials by Towards Data Science, and Jupyter Notebook guides.
  13. Feature Engineering: Identifying and creating useful features from raw data to improve model performance. Resources include articles on Medium, YouTube tutorials, and Kaggle kernels.
  14. Model Validation: Know how to assess the performance of a machine learning model. They use cross-validation and other techniques to ensure robustness. Free courses from Analytics Vidhya and resources on Cross Validated (Stack Exchange).
  15. A/B Testing: Understanding how to conduct and analyze controlled experiments. They apply this knowledge by testing and optimizing outcomes. Optimizely Academy, Google’s online courses, and Khan Academy offer resources.
  16. Data Mining: Familiarity with the process of discovering patterns in large datasets using methods at the intersection of machine learning and database systems. Resources: Online courses by Class Central, articles from KDnuggets, and the free book ‘The Elements of Statistical Learning’.
  17. Communication Skills: Ability to explain technical concepts to non-technical stakeholders. They must present findings clearly. Resources: edX’s communication courses, Toastmasters, and LinkedIn Learning.
  18. Deep Learning: Basic understanding of neural network architectures. Applied in developing high-level models for complex data. DeepLearning.AI, MIT Deep Learning for Self-Driving Cars, and Fast.ai offer free resources.
  19. Natural Language Processing (NLP): Grasping the basics of processing and analyzing text data. They apply this in creating models that interpret human language. Stanford NLP, NLTK documentation, and Coursera’s courses are valuable resources.
  20. Cloud Computing: Knowledge of cloud service platforms like AWS or Azure for data storage and computing. Resources: Amazon’s AWS Training, Microsoft Learn for Azure, and Google Cloud Platform’s training documentation.
  21. Time Series Analysis: Understanding methods for analyzing time-ordered data. They use this by forecasting and identifying trends. Resources: Time Series Analysis by Statsmodels, online courses like Coursera, and the Duke University Library guide.
  22. Algorithm Design: Basic understanding of creating efficient algorithms for problem-solving. Resources to improve include Coursera’s Algorithmic Toolbox, Geek for Geeks, and MIT’s Introduction to Algorithms course.
  23. Collaboration Tools: Familiarity with tools like Slack, Trello, or JIRA for project collaboration. They use these tools to work effectively with teams. Atlassian University, Slack’s own resources, and Trello’s user guides are good resources.
  24. Data Compliance: Awareness of regulations like GDPR and HIPAA, which govern the use of data. They must ensure data practices are compliant. Free online courses from FutureLearn, GDPR.EU resources, and HIPAA training websites are useful.
  25. Ethical Hacking: Basic knowledge of cybersecurity principles to protect data. Applied in safeguarding against data breaches. Cybrary, HackerOne’s free courses, and Open Security Training.

Job Interview Preparation

A desk with a laptop, notebooks, and a pen. A whiteboard with data science equations and charts. A stack of resumes and a job description

When preparing for a job interview as an entry-level data scientist, it’s important to be well-versed in both the theoretical knowledge and practical applications of data science.

Candidates should expect to address a range of common questions as well as demonstrate problem-solving abilities through technical exercises.

Common Interview Questions

Interviewers often begin by assessing the foundational knowledge of a candidate. Questions may include:

  1. Explain the difference between supervised and unsupervised learning.
  2. What are the types of biases that can occur during sampling?
  3. Describe how you would clean a dataset.
  4. What is cross-validation, and why is it important?
  5. Define Precision and Recall in the context of model evaluation.

Problem-Solving Demonstrations

Candidates should be ready to solve data-related problems and may be asked to:

  • Code in real-time: Write a function to parse a dataset or implement an algorithm.
  • Analyze datasets: Perform exploratory data analysis and interpret the results.
  • Model building: Develop predictive models and justify the choice of algorithm.

Such exercises demonstrate a candidate’s technical competence and their approach to problem-solving.

In preparing for these aspects of a data science interview, the following low-level skills are indispensable.

  1. Programming with Python: Understanding syntax, control structures, and data types in Python. Entry-level data scientists are expected to write efficient code to manipulate data and perform analyses. Free resources: Codecademy, Python.org tutorials, and Real Python.
  2. R programming: Mastery of R for statistical analysis and graphic representations. They must know how to use R packages like ggplot2 and dplyr for data manipulation and visualization. Free resources: R tutorials by DataCamp, R-Bloggers, and The R Manuals.
  3. SQL Data extraction: Proficiency in writing SQL queries to retrieve data from databases. They should be able to perform joins, unions, and subqueries. Free resources: SQLZoo, Mode Analytics SQL Tutorial, and W3Schools SQL.
  4. Data cleaning: Ability to identify and correct errors or inconsistencies in data to ensure the accuracy of analyses. It involves handling missing values, outliers, and data transformation. Free resources: Dataquest, Kaggle, and OpenRefine.
  5. Data visualization: Creating meaningful representations of data using tools like Matplotlib and Seaborn in Python. Candidates must present data in a clear and intuitive manner. Free resources: Python’s Matplotlib documentation, Seaborn documentation, and Data to Viz.
  6. Machine Learning using scikit-learn: Applying libraries like scikit-learn in Python for machine learning tasks. They are expected to implement and tweak models like regression, classification, clustering, etc. Free resources: scikit-learn documentation, Kaggle Learn, and the “Introduction to Machine Learning with Python” book.
  7. Statistical Analysis: Understanding statistical tests and distributions to interpret data correctly. They must apply statistical concepts to draw valid inferences from data. Free resources: Khan Academy, Coursera, and Stat Trek.
  8. Git Version Control: Utilizing Git for version control to track changes and collaborate on projects. Entry-level data scientists should know how to use repositories, branches, and commits. Free resources: GitHub Learning Lab, Codecademy’s Git Course, and Atlassian Git Tutorials.
  9. Data wrangling: Transforming and mapping raw data into another format for more convenient consumption and analysis using tools like Pandas in Python. Free resources: Pandas documentation, Kevin Markham’s Data School, and “Python for Data Analysis” by Wes McKinney.
  10. Big Data Platforms: Familiarity with platforms like Hadoop and Spark for processing large datasets. Candidates should know the basics of distributed storage and computation frameworks. Free resources: Apache Foundation’s official tutorials, edX courses on Big Data, and Databricks’ Spark resources.
  11. Probability Theory: Solid grasp of probability to understand models and make predictions. Entry-level data scientists should understand concepts such as probability distributions and conditional probability. Free resources: Harvard’s Stat110, Brilliant.org, and Paul’s Online Math Notes.
  12. Optimization Techniques: Understanding optimization algorithms for improving model performance. They must know how these techniques can be used to tune model parameters. Free resources: Convex Optimization lectures by Stephen Boyd at Stanford, Optimization with Python tutorials, and MIT’s Optimization Methods.
  13. Deep Learning: Basic concepts of neural networks and frameworks like TensorFlow or PyTorch. Entry-level data scientists will apply deep learning models to complex datasets. Free resources: TensorFlow tutorials, Deep Learning with PyTorch: A 60 Minute Blitz, and fast.ai courses.
  14. Natural Language Processing (NLP): Applying techniques to process and analyze textual data using libraries like NLTK in Python. They must understand tasks such as tokenization, stemming, and lemmatization. Free resources: NLTK documentation, “Natural Language Processing with Python” book, and Stanford NLP YouTube series.
  15. Reinforcement Learning: Understanding of the principles of teaching machines to learn from their actions. They should know the basics of setting up an environment for an agent to learn through trial and error. Free resources: Sutton & Barto’s book, David Silver’s Reinforcement Learning Course, and Reinforcement Learning Crash Course by Google DeepMind.
  16. Decision Trees and Random Forests: Knowing how to implement and interpret decision tree-based algorithms for classification and regression tasks. Entry-level data scientists will use these for decision-making processes. Free resources: “Introduction to Data Mining” book, StatQuest YouTube channel, and tree-based methods documentation in scikit-learn.
  17. Support Vector Machines (SVM): Mastery of SVM for high-dimension data classification. They should understand the optimization procedures that underpin SVMs. Free resources: “Support Vector Machines Succinctly” by Alexandre Kowalczyk, Andrew Ng’s Machine Learning Course, and the SVM guide on scikit-learn.
  18. Ensemble Methods: Understanding methods like boosting and bagging to create robust predictive models. Entry-level data scientists are expected to leverage ensemble methods to improve model accuracy. Free resources: Machine Learning Mastery, StatQuest YouTube channel, and Analytics Vidhya.
  19. Experimental Design: Designing experiments to test hypotheses in the real world. Candidates must comprehend A/B testing and control group setup. Free resources: Udacity, “Field Experiments: Design, Analysis, and Interpretation” book, and Google Analytics.
  20. Time Series Analysis: Analyzing temporal data and making forecasts using ARIMA, seasonal decomposition, and other methods. They should handle time-based data for predictions. Free resources: “Forecasting: Principles and Practice” by Rob J Hyndman and George Athanasopoulos, “Time Series Analysis and Its Applications” book, and “Applied Time Series Analysis for Fisheries and Environmental Sciences” massive open online course (MOOC).
  21. Feature Selection and Engineering: Identifying the most relevant variables and creating new features for machine learning models. They must be adept at techniques such as one-hot encoding, binning, and interaction features. Free resources: Feature Engineering and Selection by Max Kuhn and Kjell Johnson, Machine Learning Mastery, and a comprehensive guide from Towards Data Science.
  22. Evaluation Metrics: Knowing how to assess model performance using metrics like accuracy, ROC curve, F1 score, and RMSE. Entry-level data scientists need to apply the appropriate metrics for their analysis. Free resources: Scikit-learn model evaluation documentation, confusion matrix guide by Machine Learning Mastery, and Google’s Machine Learning Crash Course.
  23. Unstructured Data: Handling unstructured data like images, text, and audio. Candidates must use preprocessing techniques to convert it into a structured form. Free resources: “Speech and Language Processing” by Daniel Jurafsky & James H. Martin, Kaggle’s tutorial on image processing, and towards data science’s comprehensive guide to preprocessing textual data.
  24. Cloud Computing: Understanding of cloud services such as AWS, Azure, and Google Cloud Platform to access computational resources and deploy models. Entry-level data scientists should know the basics of cloud storage and processing. Free resources: AWS training and certification, Microsoft Learn for Azure, and Google Cloud training.
  25. Ethics in Data Science: Awareness of ethical considerations in data science to manage bias, privacy, and data security. It is paramount for making sure their work does not harm individuals or society. Free resources: Data Ethics Toolkit, “Weapons of Math Destruction” by Cathy O’Neil, and Coursera’s data science ethics course.

Networking and Engagement

A group of professionals engage in networking at a data science event

For entry-level data scientists, networking and engagement are crucial for professional growth and skill enhancement.

Establishing connections within professional communities and maintaining an active social media presence can provide valuable opportunities for learning, collaboration, and career development.

Professional Communities

Professional communities offer a platform for knowledge exchange, mentorship, and exposure to real-world data science challenges.

Entry-level data scientists should actively participate in forums, attend workshops, and contribute to discussions.

They gain insights from experienced professionals and can keep up-to-date with industry trends.

  • Conferences & Meetups: Vital for making connections, learning industry best practices, and discovering job opportunities.
  • Online Forums: Such as Stack Overflow and GitHub, where they can contribute to projects and ask for advice on technical problems.
  • Special Interest Groups: Focus on specific areas of data science, providing deeper dives into subjects like machine learning or big data.

Social Media Presence

A strong social media presence helps entry-level data scientists to network, share their work, and engage with thought leaders and peers in the industry.

  • LinkedIn: Essential for professional networking. They should share projects, write articles, and join data science groups.
  • Twitter: Useful for following influential data scientists, engaging with the community, and staying informed on the latest news and techniques in the field.
  • Blogs & Personal Websites: Can showcase their portfolio, reflect on learning experiences, and attract potential employers or collaborators.

Here is a list of essential low-level skills for entry-level data scientists:

  1. Statistical Analysis: Understanding fundamental statistical concepts, applying them to analyze data sets, and interpreting results. References: Khan Academy, Coursera, edX.
  2. Programming with Python: Writing efficient code, debugging, and using libraries like Pandas and NumPy. References: Codecademy, Learn Python, Real Python.
  3. Data Wrangling: Cleaning and preparing data for analysis, using tools such as SQL and regular expressions. References: w3schools, SQLZoo, Kaggle.
  4. Data Visualization: Creating informative visual representations of data with tools like Matplotlib and Seaborn. References: DataCamp, Tableau Public, D3.js tutorials.
  5. Machine Learning: Applying basic algorithms, understanding their mechanisms, and how to train and test models. References: scikit-learn documentation, Fast.ai, Google’s Machine Learning Crash Course.
  6. Deep Learning: Understanding neural networks, frameworks like TensorFlow or PyTorch, and their application. References: Deeplearning.ai, PyTorch Tutorials, TensorFlow Guide.
  7. Big Data Technologies: Familiarity with Hadoop, Spark, and how to handle large-scale data processing. References: Apache Foundation documentation, Hortonworks, Cloudera.
  8. Relational Databases: Understanding of database architecture, SQL queries, and database management. References: MySQL Documentation, PostgreSQL Docs, SQLite Tutorial.
  9. NoSQL Databases: Knowledge of non-relational databases, such as MongoDB, and their use cases. References: MongoDB University, Couchbase Tutorial, Apache Cassandra Documentation.
  10. Data Ethics: Awareness of ethical considerations in data handling, privacy, and bias. References: Markkula Center for Applied Ethics, Data Ethics Toolkit, Future of Privacy Forum.
  11. Cloud Computing: Familiarity with cloud services like AWS, Azure, or Google Cloud, and how to leverage them for data science tasks. References: AWS Training and Certification, Microsoft Learn, Google Cloud Training.
  12. Collaborative Tools: Proficiency with version control systems like Git, and collaboration tools like Jupyter Notebooks. References: GitHub Learning Lab, Bitbucket Tutorials, Project Jupyter.
  13. Natural Language Processing (NLP): Applying techniques for text analytics, sentiment analysis, and language generation. References: NLTK Documentation, spaCy 101, Stanford NLP Group.
  14. Time Series Analysis: Analyzing data indexed in time order, forecasting, and using specific libraries. References: Time Series Analysis by State Space Methods, Forecasting: Principles and Practice, StatsModels Documentation.
  15. Experimental Design: Setting up A/B tests, understanding control groups, and interpreting the impact of experiments. References: Google Analytics Academy, Optimizely Academy, Khan Academy.
  16. Data Governance: Knowledge of data policies, quality control, and management strategies. References: DAMA-DMBOK, Data Governance Institute, MIT Data Governance.
  17. Bioinformatics: For those in the life sciences, understanding sequence analysis and biological data. References: Rosalind, NCBI Tutorials, EMBL-EBI Train online.
  18. Geospatial Analysis: Analyzing location-based data, using GIS software, and interpreting spatial patterns. References: QGIS Tutorials, Esri Academy, Geospatial Analysis Online.
  19. Recommender Systems: Building systems that suggest products or services to users based on data. References: Recommender Systems Handbook, Coursera Recommender Systems Specialization, GroupLens Research.
  20. Ethical Hacking for Data Security: Understanding system vulnerabilities, penetration testing, and protecting data integrity. References: Cybrary, HackerOne’s Hacktivity, Open Web Application Security Project.
  21. Optimization Techniques: Applying mathematical methods to determine the most efficient solutions. References: NEOS Guide, Optimization Online, Convex Optimization: Algorithms and Complexity.
  22. Anomaly Detection: Identifying unusual patterns that do not conform to expected behavior in datasets. References: Anomaly Detection: A Survey, KDNuggets Tutorials, Coursera Machine Learning for Anomaly Detection.
  23. Data Compression Techniques: Knowledge of reducing the size of a data file to save space and speed up processing. References: Lossless Data Compression via Sequential Predictors, Data Compression Explained, Stanford University’s Data Compression Course.
  24. Cognitive Computing: Understanding human-like processing and applying it in AI contexts. References: IBM Cognitive Class, AI Magazine, Cognitive Computing Consortium.
  25. Blockchain for Data Security: Basics of blockchain technology and its implications for ensuring data integrity and traceability. References: Blockchain at Berkeley, ConsenSys Academy, Introduction to Blockchain Technology by the Linux Foundation.

Continuing Education and Learning

A person studying at a computer with books and notes, surrounded by data charts and graphs

Continuing education and learning are pivotal for individuals embarking on a career in data science. These efforts ensure that entry-level data scientists remain abreast of the evolving techniques and industry expectations.

Certifications and Specializations

Certifications and specializations can demonstrate an entry-level data scientist’s expertise and dedication to their profession. These accreditations are often pursued through online platforms, universities, and industry-recognized organizations. They cover a range of skills from data manipulation to advanced machine learning techniques.

For example, a certification in Python programming from an accredited source would indicate proficiency in coding, which is an essential skill for data handling and analysis in entry-level positions. Specializations, such as in deep learning, can be achieved through courses that provide hands-on experience with neural networks and the underlying mathematics.

Conferences and Workshops

Attending conferences and workshops presents an invaluable opportunity for entry-level data scientists to engage with current trends, network with professionals, and gain insights from industry leaders. These events can facilitate learning about innovative tools and methodologies that can be applied directly to their work.

Workshops particularly are interactive and offer practical experiences, encouraging attendees to implement new skills immediately. Entry-level data scientists can also discover how established professionals unpack complex data sets, which is crucial for practical understanding and career development.

An early-career data scientist may focus on twenty-five foundational skills:

  1. Data Cleaning: Understanding methods to identify and correct errors or inconsistencies in data to improve its quality.
  2. Data Visualization: Proficiency in creating clear graphical representations of data using software like Tableau or Matplotlib.
  3. Statistical Analysis: Ability to apply statistical tests and models to derive insights from data.
  4. Machine Learning: Basic knowledge of algorithms and their application in predictive analytics.
  5. Programming Languages: Proficiency in languages such as Python or R that are fundamental to manipulating data.
  6. Database Management: Understanding of database systems like SQL for data querying and storage.
  7. Data Mining: Ability to extract patterns and knowledge from large datasets.
  8. Big Data Technologies: Familiarity with platforms like Hadoop or Spark for handling large-scale data processing.
  9. Version Control: Knowledge of tools like Git for tracking changes in code and collaborating with others.
  10. Data Warehousing: Understanding concepts related to the storage and retrieval of large amounts of data.
  11. Cloud Computing: Familiarity with cloud services such as AWS or Azure for data storage and computing.
  12. APIs: Knowledge of APIs for data extraction and automation of tasks.
  13. Data Ethics: Awareness of ethical considerations when handling and analyzing data.
  14. Business Acumen: Understanding of business objectives to align data projects with company goals.
  15. Communication Skills: Ability to convey complex data findings to non-technical stakeholders.
  16. Time Series Analysis: Comprehension of methods for analyzing data points collected or sequenced over time.
  17. Experimentation and A/B Testing: Proficiency in designing and implementing tests to evaluate the performance of models or changes in products.
  18. Advanced Excel: Skills in using Excel functions, pivot tables, and formulas for data analysis.
  19. Critical Thinking: Ability to question assumptions and interpret data within a broader context.
  20. Problem-Solving: Skill in developing data-driven solutions to business challenges.
  21. Data Integration: Techniques for combining data from different sources into coherent datasets.
  22. Predictive Modeling: Comprehension of constructing models that predict future trends from historical data.
  23. Natural Language Processing (NLP): Basic understanding of how to work with and analyze text data.
  24. Deep Learning: Introductory knowledge of neural networks and learning algorithms for complex pattern recognition.
  25. Ethical AI: Awareness of the principles that ensure the responsible use of artificial intelligence.

For each of these skills, entry-level data scientists should seek out resources to deepen their understanding. Three free references to aid in this educational journey include online documentation, open courses from platforms like Coursera or edX, and pertinent academic papers available through preprint servers such as arXiv.

Frequently Asked Questions

A computer screen displaying a webpage with a heading "Frequently Asked Questions entry level data scientist" surrounded by a list of common inquiries and their respective answers

Navigating the field of data science at the entry level might prompt several questions. This section aims to address some of the most common inquiries made by those aspiring to start their data science career.

What qualifications are necessary to land an entry-level data scientist position?

Entry-level data scientists typically need a strong foundational understanding of statistics and machine learning as well as proficiency in programming languages such as Python or R. They may also be expected to showcase experience with data manipulation and analysis using libraries like pandas, NumPy, or Scikit-learn.

How much can one expect to earn as an entry-level data scientist?

Salaries for entry-level data scientist positions can vary widely depending on the company, industry, and location. However, in general, entry-level roles in data science offer competitive salaries that reflect the demand for analytical expertise in the job market.

Are there remote work opportunities available for entry-level data scientists?

With the growing trend of remote work, many companies offer remote positions for data scientists. Candidates may find that startups and tech companies are particularly conducive to remote work arrangements for entry-level roles.

What are some top companies hiring entry-level data scientists?

Leading companies in various industries such as tech giants, financial institutions, healthcare organizations, and e-commerce platforms are often on the lookout for entry-level data scientists to join their teams and contribute to data-driven decision-making.

What job responsibilities does an entry-level data scientist typically have?

An entry-level data scientist may be responsible for collecting and cleaning data. They also perform exploratory data analysis, build and validate predictive models, and present findings to stakeholders. Developing insights that can guide business strategies is a critical aspect of their role.

Is it possible to secure a data scientist role with no prior experience in the field?

Some individuals may transition into a data scientist role without direct experience. However, they will likely require a portfolio demonstrating relevant skills.

Academic projects, bootcamps, internships, or personal projects can serve as valuable experience to break into the field.

Categories
Uncategorized

Learning Random Forest Key Hyperparameters: Essential Guide for Optimal Performance

Understanding Random Forest

The random forest algorithm is a powerful ensemble method commonly used for classification and regression tasks. It builds multiple decision trees and combines them to produce a more accurate and robust model.

This section explores the fundamental components that contribute to the effectiveness of the random forest.

Essentials of Random Forest Algorithm

The random forest is an ensemble algorithm that uses multiple decision trees to improve prediction accuracy. It randomly selects data samples and features to train each tree, minimizing overfitting and enhancing generalization.

This approach allows randomness to optimize results by lowering variance while maintaining low bias.

Random forests handle missing data well and maintain performance without extensive preprocessing. They are also less sensitive to outliers, making them suitable for various data types and complexities.

Decision Trees as Building Blocks

Each tree in a random forest model acts as a simple yet powerful predictor. They split data into branches based on feature values, reaching leaf nodes that represent outcomes.

The simplicity of decision trees lies in their structure and interpretability, classifying data through straightforward rules.

While decision trees are prone to overfitting, the random forest mitigates this by aggregating predictions from numerous trees, thus enhancing accuracy and stability. This strategy leverages the strengths of individual trees while reducing their inherent weaknesses.

Ensemble Algorithm and Bagging

The foundation of the random forest algorithm lies in the ensemble method known as bagging, or bootstrap aggregating. This technique creates multiple versions of a dataset through random sampling with replacement.

Each dataset is used to build a separate tree, ensuring diverse models that capture different aspects of data patterns.

Bagging increases the robustness of predictions by merging outputs from all trees to its final result. This collective learning approach each tree votes for the most popular class or averages the predictions in regression tasks, reducing the overall error of the ensemble model.

The synergy between bagging and random forests results in effective generalization and improved predictive performance.

Core Hyperparameters of Random Forest

Adjusting the core hyperparameters of a Random Forest can significantly affect its accuracy and efficiency. Three pivotal hyperparameters include the number of trees, the maximum depth of each tree, and the number of features considered during splits.

Number of Trees (n_estimators)

The n_estimators hyperparameter represents the number of decision trees in the forest. Increasing the number of trees can improve accuracy as more trees reduce variance, making the model robust. However, more trees also increase computation time.

Typically, hundreds of trees are used to balance performance and efficiency. The optimal number might vary based on the dataset’s size and complexity.

Using too few trees may lead to an unstable model, while too many can slow processing without significant gains.

Maximum Depth (max_depth)

Max_depth limits how deep each tree in the forest can grow. This hyperparameter prevents trees from becoming overly complex and helps avoid overfitting.

Trees with excessive depth can memorize the training data but fail on new data. Setting a reasonable maximum depth ensures the trees capture significant patterns without unnecessary complexity.

Deep trees can lead to more splits and higher variance. Finding the right depth is crucial to maintain a balance between bias and variance.

Features to Consider (max_features)

Max_features controls the number of features used when splitting nodes. A smaller number of features results in diverse trees and reduces correlation among trees.

This diversity can enhance the model’s generalization ability. Commonly used settings include square root of total features or a fixed number.

Too many features can overwhelm some trees with noise, while too few might miss important patterns. Adjusting this hyperparameter can significantly affect the accuracy and speed of the Random Forest algorithm.

Hyperparameter Impact on Model Accuracy

Hyperparameters play a vital role in the accuracy of random forest models. They help in avoiding overfitting and preventing underfitting by balancing model complexity and data representation.

Adjustments to values like max_leaf_nodes, min_samples_split, and min_samples_leaf can significantly affect how well the model learns from the data.

Avoiding Overfitting

Overfitting occurs when a model learns the training data too well, capturing noise instead of the underlying distribution. This leads to poor performance on new data.

One way to prevent overfitting is by controlling max_leaf_nodes. By limiting the number of leaf nodes, the model simplifies, reducing its chances of capturing unnecessary details.

Another important hyperparameter is min_samples_split. Setting a higher minimum number of samples required to split an internal node can help ensure that each decision node adds meaningful information. This constraint prevents the model from growing too deep and excessively tailoring itself to the training set.

Lastly, min_samples_leaf, which sets the minimum number of samples at a leaf node, affects stability. A larger minimum ensures that leaf nodes are less sensitive to variations in the training data.

When these hyperparameters are properly tuned, the model becomes more general, improving accuracy.

Preventing Underfitting

Underfitting happens when a model is too simple to capture the complexities of the data, leading to inaccuracies even on training sets.

Adjusting max_leaf_nodes can make the model more robust, allowing for more intricate decision trees.

Increasing min_samples_split can also help in preventing underfitting by allowing more comprehensive branches to develop. If this value is too high, the model might miss critical patterns in the data. Balancing it is crucial.

Lastly, fine-tuning min_samples_leaf ensures that the model is neither too broad nor too narrow. Too many samples per leaf can make the model oversimplified. Proper tuning ensures that the model can refine enough details, boosting model accuracy.

Optimizing Random Forest Performance

Improving random forest model performance involves essential strategies such as fine-tuning hyperparameters. Utilizing techniques like GridSearchCV and RandomizedSearchCV allows one to find optimal settings, enhancing accuracy and efficiency.

Hyperparameter Tuning Techniques

Hyperparameter tuning is crucial for boosting the performance of a random forest model. Key parameters include n_estimators, which defines the number of trees, and max_features, which controls the number of features considered at each split.

Adjusting max_depth helps in managing overfitting and underfitting. Setting these parameters correctly can significantly improve the accuracy of the model.

Techniques for finding the best values for these parameters include trial and error or using automated tools like GridSearchCV and RandomizedSearchCV to streamline the process.

Utilizing GridSearchCV

GridSearchCV is an invaluable tool for hyperparameter tuning in random forest models. It systematically evaluates a predefined grid of hyperparameters and finds the combination that yields the best model performance.

By exhaustively searching through specified parameter values, GridSearchCV identifies the setup with the highest mean_test_score.

This method is thorough, ensuring that all options are considered. Users can specify the range for parameters like max_depth or n_estimators, and GridSearchCV will test all possible combinations to find the best parameters.

Applying RandomizedSearchCV

RandomizedSearchCV offers an efficient alternative to GridSearchCV by sampling a fixed number of parameter settings from specified distributions. This method speeds up the process when searching for optimal model configurations, often returning comparable results with fewer resources.

Instead of evaluating every single combination, it samples from a distribution of possible parameters, making it much faster and suitable for large datasets or complex models.

While RandomizedSearchCV may not be as exhaustive, it often finds satisfactory solutions with reduced computational cost and time.

Advanced Hyperparameter Options

Different settings influence how well a Random Forest model performs. Fine-tuning hyperparameters can enhance accuracy, especially in handling class imbalance and choosing decision criteria. Bootstrap sampling also plays a pivotal role in model diversity.

Criterion: Gini vs Entropy

The choice between Gini impurity and entropy affects how the data is split at each node. Gini measures the frequency of a certain label being assigned to a random case. It’s computationally efficient and often faster.

Entropy, borrowed from information theory, offers a more nuanced measure. It can handle many splits and helps in cases where certain class distributions benefit from detailed splits.

Gini often fits well in situations requiring speed and efficiency. Entropy may be more revealing when capturing the perfect separation of classes is crucial.

Methods like random_state ensure consistent results. The focus is on balancing detail with computational cost to suit the problem at hand.

Bootstrap Samples

Bootstrap sampling involves randomly selecting subsets of the dataset with replacement. This technique allows the random forest to combine models trained on different data portions, increasing generalization.

Having bootstrap=true means that around one-third of the data might not be included in the training sample. This so-called out-of-bag data offers a way to validate model performance internally without needing a separate validation split.

The max_samples parameter controls the sample size taken from the input data, impacting stability and bias. By altering these settings, one can manage overfitting and bias variance trade-offs, maximizing the model’s accuracy.

Handling Imbalanced Classes

Handling imbalanced classes requires careful tweaking of the model’s parameters. For highly skewed data distributions, ensuring the model performs well across all classes is key.

Sampling techniques like SMOTE or adjusting class weights ensure that the model does not favor majority classes excessively.

Modifying the random_state ensures consistency in handling datasets, making the processing more predictable.

Class weights can be set to ‘balanced’ for automatic adjustments based on class frequencies. This approach allows for improved recall and balanced accuracy across different classes, especially when some classes are underrepresented.

Tracking model performance using metrics like F1-score provides a more rounded view of how well it handles imbalances.

Implementing Random Forest in Python

Implementing a Random Forest in Python involves utilizing the Scikit-learn library to manage hyperparameters effectively. Python’s capabilities allow for setting up a model with clarity.

The role of Scikit-learn, example code for model training, and evaluation through train_test_split are essential components.

The Role of Scikit-learn

Scikit-learn plays an important role in implementing Random Forest models. This library provides tools to configure and evaluate models efficiently.

RandomForestClassifier in Scikit-learn is suited for both classification and regression tasks, offering methods to find optimal hyperparameters.

The library also supports functions for preprocessing data, which is essential for cleaning and formatting datasets before training the model.

Users can define key parameters, such as the number of trees and depth, directly in the RandomForestClassifier constructor.

Example Code for Model Training

Training a Random Forest model in Python starts with importing the necessary modules from Scikit-learn. Here’s a simple example of setting up a model:

from sklearn.ensemble import RandomForestClassifier
from sklearn.datasets import load_iris
from sklearn.model_selection import train_test_split

data = load_iris()
X_train, X_test, y_train, y_test = train_test_split(data.data, data.target, test_size=0.3, random_state=42)

model = RandomForestClassifier(n_estimators=100, max_depth=5)
model.fit(X_train, y_train)

In this code, a dataset is split into training and testing sets using train_test_split.

The RandomForestClassifier is then initialized with specified parameters, such as the number of estimators and maximum depth, which are crucial for hyperparameter tuning.

Evaluating with train_test_split

Evaluating a Random Forest model involves dividing data into separate training and testing segments. This is achieved using train_test_split, a Scikit-learn function that helps assess the model’s effectiveness.

By specifying a test_size, users determine what portion of the data is reserved for testing.

The train_test_split ensures balanced evaluation. The use of a random_state parameter ensures consistency in splitting, allowing reproducibility. Testing accuracy and refining the model based on results is central to improving predictive performance.

Handling Hyperparameters Programmatically

Efficient handling of hyperparameters can lead to optimal performance of a Random Forest model. By utilizing programmatic approaches, data scientists can automate and optimize the hyperparameter tuning process, saving time and resources.

Constructing Hyperparameter Grids

Building a hyperparameter grid is a crucial step in automating the tuning process. A hyperparameter grid is essentially a dictionary where keys are parameter names and values are options to try.

For instance, one might specify the number of trees in the forest and the number of features to consider at each split.

It’s important to include a diverse set of values in the grid to capture various potential configurations.

This might include parameters like n_estimators, which controls the number of trees, and max_depth, which sets the maximum depth of each tree. A well-constructed grid allows the model to explore the right parameter options automatically.

Automating Hyperparameter Search

Automating the search across the hyperparameter grid is managed using tools like GridSearchCV.

This method tests each combination of parameters from the grid to find the best model configuration. The n_jobs parameter can be used to parallelize the search, speeding up the process significantly by utilizing more CPU cores.

Data scientists benefit from tools like RandomizedSearchCV as well, which samples a specified number of parameter settings from the grid rather than testing all combinations. This approach can be more efficient when dealing with large grids, allowing for quicker convergence on a near-optimal solution.

Data Considerations in Random Forest

A forest with various types of data (e.g. numbers, categories) scattered throughout, with key hyperparameters (e.g. number of trees, tree depth) hovering above the trees

Random forests require careful attention to data characteristics for efficient model performance. Understanding the amount of training data and techniques for feature selection are critical factors. These aspects ensure that the model generalizes well and performs accurately across various tasks.

Sufficient Training Data

Having enough training data is crucial for the success of a random forest model. A robust dataset ensures the model can learn patterns effectively, reducing the risk of overfitting or underfitting.

As random forests combine multiple decision trees, more data helps each tree make accurate splits, improving the model’s performance.

Training data should be diverse and representative of the problem domain. This diversity allows the model to capture complex relationships in the data.

In machine learning tasks, ample data helps in achieving better predictive accuracy, thus enhancing the utility of the model. A balanced dataset across different classes or outcomes is also essential to prevent bias.

Data preprocessing steps, such as cleaning and normalizing, further enhance the quality of data used. These steps ensure that the random forest model receives consistent and high-quality input.

Feature Selection and Engineering

Feature selection is another significant consideration in random forests. Selecting the right number of features to consider when splitting nodes directly affects the model’s performance.

Including irrelevant or too many features can introduce noise and complexity, potentially degrading model accuracy and increasing computation time.

Feature engineering can help improve model accuracy by transforming raw data into meaningful inputs. Techniques like one-hot encoding, scaling, and normalization make the features more informative for the model.

Filtering out less important features can streamline the decision-making process of each tree within the forest.

Feature importance scores provided by random forests can aid in identifying the attributes that significantly impact the model’s predictions. Properly engineered and selected features contribute to a more efficient and effective random forest classifier.

The Role of Cross-Validation

Cross-validation plays a crucial role in ensuring that machine learning models like random forests perform well. It helps assess model stability and accuracy while aiding in hyperparameter tuning.

Techniques for Robust Validation

One common technique for cross-validation is K-Fold Cross-Validation. It splits data into K subsets or “folds.” The model is trained on K-1 folds and tested on the remaining one. This process is repeated K times, with each fold getting used as the test set once.

Another approach is Leave-One-Out Cross-Validation (LOOCV), which uses all data points except one for training and the single data point for testing. Although it uses most data for training, it can be computationally expensive.

Choosing the right method depends on dataset size and computational resources. K-Fold is often a practical balance between thoroughness and efficiency.

Integrating Cross-Validation with Tuning

Integrating cross-validation with hyperparameter tuning is essential for model optimization. Techniques like Grid Search Cross-Validation evaluate different hyperparameter combinations across folds.

A hyperparameter grid is specified, and each combination is tested for the best model performance.

Randomized Grid Search is another approach. It randomly selects combinations from the hyperparameter grid for testing, potentially reducing computation time while still effectively finding suitable parameters.

Both methods prioritize model performance consistency across different data validations. Applying these techniques ensures that the model not only fits well on training data but also generalizes effectively on unseen data, which is crucial for robust model performance.

Interpreting Random Forest Results

A lush forest with interconnected trees, each representing a key hyperparameter in random forest algorithm. Sunlight filters through the dense canopy, casting dappled shadows on the forest floor

Understanding how Random Forest models work is crucial for data scientists. Interpreting results involves analyzing which features are most important and examining error metrics to evaluate model performance.

Analyzing Feature Importance

In Random Forest models, feature importance helps identify which inputs have the most impact on predictions. Features are ranked based on how much they decrease a criterion like gini impurity. This process helps data scientists focus on key variables.

Gini impurity is often used in classification tasks. It measures how often a randomly chosen element would be incorrectly labeled.

High feature importance indicates a stronger influence on the model’s decisions, assisting in refining machine learning models. By concentrating on these features, data scientists can enhance the efficiency and effectiveness of their models.

Understanding Error Metrics

Error metrics are critical in assessing how well a Random Forest model performs. Some common metrics include accuracy, precision, recall, and the confusion matrix.

These metrics offer insights into different aspects of model performance, such as the balance between false positives and false negatives.

Accuracy measures the proportion of true results among the total number of cases examined. Precision focuses on the quality of the positive predictions, while recall evaluates the ability to find all relevant instances.

Using a combination of these metrics provides a comprehensive view of the model’s strengths and weaknesses. Analyzing this helps in making necessary adjustments for better predictions and overall performance.

Frequently Asked Questions

This section covers important aspects of Random Forest hyperparameters. It highlights how different parameters influence the model’s effectiveness and suggests methods for fine-tuning them.

What are the essential hyperparameters to tune in a Random Forest model?

Essential hyperparameters include the number of trees (n_estimators), the maximum depth of the trees (max_depth), and the number of features to consider when looking for the best split (max_features). Tuning these can significantly affect model accuracy and performance.

How does the number of trees in a Random Forest affect model performance?

The number of trees, known as n_estimators, influences both the model’s accuracy and computational cost. Generally, more trees improve accuracy but also increase the time and memory needed.

It’s important to find a balance based on the specific problem and resources available.

What is the significance of max_features parameter in Random Forest?

The max_features parameter determines how many features are considered for splitting at each node. It affects the model’s diversity and performance.

Using fewer features can lead to simpler models, while more features typically increase accuracy but may risk overfitting.

How do you perform hyperparameter optimization for a Random Forest classifier in Python?

In Python, hyperparameter optimization can be performed using libraries like GridSearchCV or RandomizedSearchCV from the scikit-learn package. These tools search over a specified parameter grid to find the best values for the hyperparameters and improve the model’s performance.

What role does tree depth play in tuning Random Forest models?

The depth of the trees, controlled by the max_depth parameter, influences the complexity of the model.

Deeper trees can capture more details but may overfit. Limiting tree depth helps keep the model general and improves its ability to perform on unseen data.

Can you explain the impact of the min_samples_split parameter in Random Forest?

The min_samples_split parameter determines the minimum number of samples required to split an internal node.

By setting a higher value for this parameter, the trees become less complex and less prone to overfitting. It ensures that nodes have sufficient data to make meaningful splits.

Categories
Uncategorized

Learning How To Perform Nuanced Analysis of Large Datasets with Window Functions: A Comprehensive Guide

Understanding Window Functions in SQL

Window functions in SQL are essential for performing complex data analysis tasks efficiently. They allow users to execute calculations over specific sets of rows, known as partitions, while maintaining the original data structure.

This capability makes them distinct and invaluable tools in any data analyst’s toolkit.

Definition and Importance of Window Functions

Window functions in SQL are special functions used to perform calculations across a set of rows that are related to the current row. Unlike aggregate functions that return a single result for a set of rows, window functions can provide a result for each row in that set. This makes them ideal for nuanced analyses where detail and context are crucial.

These functions replace the need for subqueries and self-joins in many scenarios, simplifying queries. They are incredibly useful for tasks such as calculating running totals, moving averages, and rank calculations.

The ability to analyze data while keeping the window of data intact is what makes them powerful for data analysis.

The Syntax of Window Functions

The basic structure of a window function includes the use of the OVER clause, accompanied by optional PARTITION BY and ORDER BY subclauses. The syntax is generally as follows:

function_name() OVER ([PARTITION BY expression] [ORDER BY expression])

The PARTITION BY clause divides the result set into partitions. Within each partition, the function is applied independently. This is important for calculations like ranking within certain groups.

ORDER BY defines the order of rows for the function’s operation.

The inclusion of these elements tailors the function’s operation to the user’s needs, ensuring meaningful insights are generated from large and complex datasets.

Distinct Features of Window Functions Versus Aggregate Functions

Window functions differ significantly from traditional aggregate functions. Aggregate functions collapse data into a single output for a dataset, while window functions allow for more granular control.

By using the OVER clause, window functions can provide results related to individual rows while analyzing the entire dataset.

This distinction means window functions can be used to produce results that reflect both summary and detailed data. For example, calculating a cumulative sales total that respects the context of each transaction is made possible with window functions. This feature enhances data interpretation and presentation, making window functions an indispensable tool in SQL.

Executing Calculations with Window Functions

Window functions allow users to perform nuanced analyses on large datasets by providing advanced calculations without aggregating the data into a single result set. This section covers how to execute running totals, calculate moving averages, and tackle complex calculations efficiently.

Running Totals and Cumulative Sums

Window functions can calculate running totals and cumulative sums, which are particularly useful in financial or sales data analysis. The SUM() function calculates totals across a set of rows defined by the window.

For example, calculating the cumulative sales total over a period is straightforward with the use of the SUM() function over a specified data range.

Using PARTITION BY and ORDER BY helps in categorizing data into smaller partitions. This method ensures accurate cumulative totals for each category, such as different product lines or regions.

By doing this, users gain insights into trends over time, which are essential for forecasting and decision-making.

Calculating Moving Averages

Calculating moving averages smooths out data fluctuations over time. This is useful for identifying trends without being affected by short-term spikes or drops in data.

The AVG() function is applied over a moving window, which shifts as it computes the average of a particular number of preceding rows.

Using window functions for moving averages allows analysts to specify the frame of rows they want to average over, known as the sliding window. This flexibility can be used for analyzing sales performance over weeks, for instance, by setting the frame to include the previous week’s data in each calculation.

Complex Calculations Using Window Functions

Window functions provide the framework for more complex calculations that aggregate data while maintaining all records intact. Functions like RANK(), ROW_NUMBER(), and DENSE_RANK() help in ranking and ordering data within window partitions, something that’s vital in scoring and competitive analysis.

They are also essential for calculating differences between rows or groups, such as determining changes in sales figures from one month to the next.

This approach uses functions such as LAG() and LEAD() to access data from prior or subsequent rows without the need for complex self-joins, which optimizes query performance and clarity.

Window functions thus provide a crucial toolkit for in-depth data analysis, allowing for more precise and efficient results across large datasets.

Data Partitions and Ordering in Analysis

When analyzing large datasets, using window functions effectively requires a strong grasp of data partitioning and ordering. These techniques help in organizing and processing data efficiently, thus ensuring meaningful insights.

Partitioning Data with ‘PARTITION BY’ Clause

Partitioning data with the PARTITION BY clause is like grouping data into segments for more granular analysis. It allows analysts to perform calculations within these defined groups without interfering with others.

For instance, when assessing sales data, partitioning by region can help compare total sales across different regions. This ensures that each region’s sales data is analyzed in isolation from others.

This method is particularly helpful in ensuring that calculations like ranks or averages are meaningful within each group rather than across the dataset as a whole.

Sorting Data with ‘ORDER BY’ Clause

The ORDER BY clause is crucial for ordering data in a specified order, usually ascending or descending. This sorting is essential when using functions like ROW_NUMBER, which require a defined order to allocate ranks or retrieve top values.

For example, sorting sales data by date allows an analyst to examine trends over time.

Accurate use of ORDER BY ensures that the sequence of data aligns with the analysis goals. It is pivotal when dealing with time-sensitive data where trends need to be identified accurately.

Importance of Accurate Data Ordering for Analysis

Accurate data ordering plays a vital role in achieving precise analysis outcomes. Incorrect ordering can lead to misleading insights, especially in trend analysis or time series data.

For instance, evaluating total sales over consecutive months requires meticulous order. Without this, conclusions drawn may not reflect actual business trends or performance.

Reliability in data interpretation hinges on the correct sequence, as even a small mistake here can skew entire analysis results. Ensuring data is accurately ordered eliminates ambiguity, thus enhancing the confidence in the conclusions drawn.

Advanced Ranking with SQL Window Functions

Advanced ranking in SQL uses window functions like RANK, DENSE_RANK, and ROW_NUMBER. These functions help data scientists analyze large datasets, identify trends, and rank data based on specified criteria.

Utilizing ‘RANK’ and ‘DENSE_RANK’ Functions

The RANK function is used to assign a rank to each row in a partition of data. It orders the entries based on a specified column, such as sales figures. When two rows have identical values, they receive the same rank, but the next number assigned jumps, leaving gaps.

In contrast, the DENSE_RANK function also provides ranks, but does not leave gaps between groups of identical values. This is particularly useful in sales data where continuity in ranking is necessary.

Data scientists can leverage both functions for nuanced data analysis, ensuring they choose the appropriate one based on the need for gaps in rankings or continuous ranks.

The ‘ROW_NUMBER’ Function and Its Applications

The ROW_NUMBER function assigns a unique identifier to each row within a specified partition of a result set. Unlike RANK or DENSE_RANK, it does not account for ties.

This function is ideal for scenarios where distinct ranking is required, such as determining the order of employees based on their hire date.

This function provides an efficient method for tasks that require a clear sequence of results. The clear assignment of numbers enables easier identification of outliers or specific data points in large datasets.

Identifying Trends with Ranking

Ranking functions play a crucial role in identifying data trends. By using these functions, analysts can look at how rankings change over time to uncover patterns or predict future trends.

This is especially relevant in sales data, where understanding shifts in ranking can help make informed decisions.

For example, data scientists might use these functions to track monthly sales performance, identifying top-performing products or regions. Monitoring these changes helps businesses optimize strategies and allocate resources effectively based on identified trends.

Analyzing Time-Series Data

Analyzing time-series data often involves comparing and examining sequential data points. By using functions like LEAD, LAG, FIRST_VALUE, and LAST_VALUE, one can gain insights into trends, variations, and changes over time.

Leveraging ‘LEAD’ and ‘LAG’ Functions for Comparison

The LEAD and LAG functions are essential for comparing time-series data points. LEAD retrieves data from a later row, while LAG fetches data from a previous one.

These functions allow analysts to compare values and identify patterns over different time periods.

For instance, in a sales dataset, using LAG can show how current sales compare to previous months. Code examples often demonstrate how these functions facilitate viewing differences in sequential data points. They make it easier to detect upward or downward trends, which can indicate changes in the business environment.

Utilizing LEAD and LAG helps in achieving precise temporal comparisons. It enhances understanding of relationships between consecutive data points.

Utilizing ‘FIRST_VALUE’ and ‘LAST_VALUE’ in Analyses

The FIRST_VALUE and LAST_VALUE functions are useful for examining initial and final data points within a time-series window. FIRST_VALUE gives insight into the starting data point, while LAST_VALUE shows the endpoint.

This information helps in determining changes that occur over a specified range.

For stock price analysis, FIRST_VALUE might reveal the starting price at the beginning of a trading period, whereas LAST_VALUE can show the ending price. This comparison helps in assessing overall change. Additionally, these functions highlight anomalies in trends, such as unexpected peaks or drops.

These techniques provide a clear framework for evaluating the progression of data points over time and understanding long-term shifts or transformations within a dataset.

Filtering and Window Functions

A computer screen displaying a complex dataset with rows and columns, with various filters and window functions being applied to analyze the data

Window functions in SQL allow for complex data analysis without losing individual row context. Key aspects include filtering data efficiently with the OVER clause and refining analysis by harnessing powerful filtering capabilities of window functions.

Filtering Data with Over Clause

The OVER clause in SQL enables the use of window functions for filtering data with precision. It defines a window or set of rows for the function to operate on.

Using the OVER clause, one can specify partitions, which are subsets of data, and ordering of rows within each partition. This setup is crucial in performing tasks like ranking each employee by salary within different departments.

For instance, defining partitions can make reports more precise by focusing calculations within specific data groups. The clause aids in identifying patterns in large datasets by customizing the frame of calculation.

This approach contrasts with traditional aggregate functions, which summarize data into single results. By keeping each row’s context during computation, the OVER clause enhances the SQL skills needed for detailed data assessment.

Refined Data Analysis Through Window Function Filtering

Filtering within window functions is vital for data refinement and precision. The capability to manage calculations like running totals or moving averages depends on how filters are applied.

Window functions can handle intricate calculations by allowing conditions that separate relevant data from noise, similar to advanced analytical queries.

These functions are particularly beneficial when analyzing trends over time or comparing segments without collapsing the dataset into aggregated numbers.

The fine-tuning potential of filters in window functions helps analysts maintain row integrity, delivering insights efficiently. This nuanced analysis supports businesses in making informed decisions based on their unique data contexts, showcasing the advanced capabilities of SQL when combined with effective filtering strategies.

Practical Applications in Real-World Scenarios

A computer screen displaying a complex dataset with rows and columns, highlighted by window function analysis

Window functions in SQL are essential for nuanced data analysis. They’re used in various sectors to manage inventory, find patterns, and transform data for better business decisions.

By offering efficient calculations, these functions enhance data insights significantly.

Inventory Management and Sales Analysis

In the retail industry, keeping track of inventory and sales performance is crucial.

Window functions allow analysts to calculate running totals and measure sales trends over time. This helps identify the best-selling products or detect slow-moving inventory.

By segmenting data by time units like days, weeks, or months, businesses can better plan stock levels and promotions.

These insights lead to more informed decisions about what products to keep in stock.

For instance, calculating the average sales during different seasons can guide inventory purchases. This prevents both overstocking and stockouts, ensuring optimal inventory management.

Pattern Discovery in Large Datasets

Detecting patterns in vast amounts of data is another significant application of window functions. Analysts use these functions to discover emerging trends or anomalies.

By doing so, companies can predict consumer behavior and adapt their strategies.

For example, businesses may analyze patterns in sales data to determine peak shopping times or identify geographical sales differences.

Window functions allow for filtering and ranking data points, making it easier to compare them across different dimensions like time and location.

This type of analysis helps businesses tailor their campaigns to specific audiences and improve targeting.

Additionally, pattern discovery can support event detection, such as fluctuations in traffic or sales spikes, allowing businesses to react promptly.

Data Transformations for Business Intelligence

Data transformations are a key part of business intelligence, enabling organizations to convert raw data into actionable insights.

Window functions play a crucial role in this process by enabling complex calculations and data manipulations.

These functions can perform cumulative and rolling calculations that provide a deeper look into business statistics, such as moving averages and share ratios.

Such transformations allow businesses to create comprehensive reports and dashboards that guide strategic planning.

It enhances decision-making by giving firms a clearer view of key performance indicators and operational trends.

Furthermore, these insights inform everything from resource allocation to financial forecasting, making businesses more agile and competitive.

Optimizing SQL Queries with Window Functions

A computer screen displaying complex SQL queries with window functions, surrounded by data charts and graphs for nuanced analysis of large datasets

Using window functions can significantly enhance query performance and efficiency. This involves strategic use of indexes, temporary tables, and partitioning strategies to manage large datasets effectively.

Use of Indexes and Temporary Tables

Indexes play a crucial role in speeding up SQL queries. By creating indexes on columns involved in the window functions, SQL Server can quickly locate the required data, reducing query time. This is particularly useful for large datasets where searches would otherwise be slow.

Temporary tables can also optimize performance. They allow users to store intermediate results, thus avoiding repeated calculations.

This reduces the computational load and improves query speed by handling manageable data chunks. Using temporary tables effectively requires identifying which parts of the data require repeated processing.

Performance Tuning with Partitioning Strategies

Partitioning strategies can greatly improve query performance, especially with large datasets.

By dividing a large dataset into smaller, more manageable pieces, the database engine processes only the relevant partitions instead of the entire dataset. This can lead to faster query execution times.

Choosing the right partitioning key is vital. It should be based on the columns frequently used in filtering to ensure that only necessary data is accessed.

This approach not only enhances performance but also reduces resource usage.

Effective partitioning keeps data retrieval efficient and organized, ensuring that SQL queries with window functions run smoothly.

SQL Techniques for Data Professionals

A computer screen displaying a complex SQL query with window functions, surrounded by scattered data charts and graphs

Data professionals frequently leverage advanced SQL techniques to manage, analyze, and manipulate large datasets efficiently.

Key methods involve using subqueries and Common Table Expressions (CTEs), integrating window functions into stored procedures, and using dynamic SQL with procedural programming techniques.

Combining Subqueries and CTEs with Window Functions

Subqueries and CTEs are powerful tools in SQL for data manipulation and transformation.

Subqueries allow data professionals to nest queries for more complex operations, while CTEs provide a way to temporarily name a set for use within a query execution.

When combined with window functions, these techniques enable enhanced calculations.

Window functions, like ROW_NUMBER(), RANK(), and DENSE_RANK(), work across partitions of a dataset without limiting the rows returned.

By using subqueries and CTEs with window functions, users can tackle multi-step data transformations efficiently. This combination is particularly useful for tasks such as ranking, data comparisons, and trend analysis.

Integrating Window Functions within Stored Procedures

Stored procedures are essential for encapsulating SQL code for reuse and performance optimization.

By integrating window functions into these procedures, data analysts can perform advanced operations without re-writing code for each query.

For instance, calculating running totals or cumulative sums becomes more streamlined.

Stored procedures enhance efficiency by reducing code redundancy. They leverage window functions to execute complex set-based calculations more consistently.

Stored procedures save time by enabling users to automate recurring analytical tasks within a database environment, boosting productivity and accuracy in data handling.

Dynamic SQL and Procedural Programming Techniques

Dynamic SQL is employed when SQL code needs to be constructed dynamically at runtime. This technique is often paired with procedural programming to expand the capabilities of standard SQL operations.

Using programming constructs like IF statements or loops, dynamic SQL can adapt to varied analytical requirements.

Procedural programming within SQL uses user-defined functions and procedures to handle complex logic. This approach allows for more interactive and responsive SQL scripts.

By applying these techniques, data professionals can create more adaptable databases that respond to changing data analysis needs, improving flexibility and interactivity in processing large datasets.

Improving Data Analysis and Reporting Skills

A computer screen displaying a complex dataset with multiple columns and rows, with window function code being written in a programming environment

Data analysis and reporting are crucial for making informed decisions in any industry.

By improving SQL skills and engaging in practical exercises, both junior and senior data analysts can enhance their capabilities in handling complex datasets.

Developing SQL Skills for Junior and Senior Analysts

SQL is one of the most important tools for data analysts. Skills in SQL help analysts retrieve, modify, and manage data in databases effectively.

Junior analysts should start by learning basic SQL commands like SELECT, INSERT, UPDATE, and DELETE. These form the foundation for more complex operations.

For senior analysts, focusing on advanced SQL functions is essential. Window functions are particularly valuable for performing nuanced analyses.

Functions such as ROW_NUMBER(), RANK(), and LEAD() allow analysts to gain deeper insights from data, performing calculations across specific rows.

Learning these skills can significantly improve their ability to deliver detailed reports.

Tips for Improving SQL Skills:

  • Participate in online courses.
  • Use mock datasets to practice SQL queries.
  • Join forums and online communities.

Hands-On Exercises for Mastery

Practical exercises are key to mastering data analysis and reporting.

Coding exercises can greatly enhance an analyst’s ability to solve complex problems. Hands-on practice helps in understanding data wrangling, which involves cleaning and organizing data for analysis.

Junior analysts should engage in exercises that involve basic data transformation tasks. This includes extraction of data from different sources and cleaning it for analysis.

For senior analysts, exercises should focus on complex data modeling and integration techniques.

Benefits of Hands-On Exercises:

  • Builds problem-solving skills.
  • Enhances understanding of data processes.
  • Encourages collaboration with data engineers.

Regular practice and continuous learning through hands-on exercises are essential for improving skills in data analysis and reporting.

Understanding Data Types and Structures in SQL

A computer screen displaying a complex dataset with various data types and structures, alongside a window function performing nuanced analysis on the data

When working with SQL, data types and structures are foundational. They determine how data is stored, retrieved, and manipulated.

Proper awareness of these concepts is essential, especially when using features like window functions for complex data analysis.

Working with Different Data Types for Window Functions

Data types in SQL define the kind of data stored in a table. Common types include integers, floats, strings, dates, and boolean values. Each type serves a specific purpose and ensures data integrity.

Integers are used for whole numbers, while floats handle decimals. Strings store text, and knowing how to work with them is key when dealing with names or addresses.

Dates are vital for time-based analysis, often used with window functions to track changes over periods. Incorrect data type usage can lead to errors and ineffective analysis.

Understanding the nature of data types ensures the correct use of window functions.

For example, using a date range to calculate running totals or averages is only possible with the right data types. Comprehending this helps in optimizing queries and improving performance.

Manipulating Table Rows and Subsets of Data

Tables in SQL are collections of rows and columns. Each row represents a unique record, while columns represent data attributes.

SQL allows for precise manipulation of these elements to extract meaningful insights.

To manage subsets, SQL uses commands like SELECT, WHERE, and JOIN to filter and combine data. These commands are crucial when analyzing complex datasets with window functions.

For instance, one might retrieve sales data for a specific quarter without sifting through an entire database.

Identifying patterns is often achieved by manipulating these subsets. Whether identifying trends or anomalies, the ability to select specific table rows and subsets is invaluable.

Clear understanding of how to access and modify this data streamlines analytical processes and enhances overall data analysis capabilities.

Frequently Asked Questions

A computer screen displaying a complex dataset with various data points and visualizations, surrounded by open books and notes on window functions

Window functions in SQL are powerful tools used for complex data analysis that allow more detailed insights than regular aggregate functions. These functions can perform tasks like calculating running totals, moving averages, and ranking, offering tailored solutions for large datasets.

What is the definition and purpose of window functions in SQL?

Window functions are used to perform calculations across a set of rows related to the current row. Unlike standard functions, they do not collapse rows into a single output. Instead, they provide a value for every row. This helps in achieving more nuanced data analysis.

How do window functions differ from aggregate functions in data analysis?

While both aggregate and window functions operate on sets of rows, aggregate functions return a single value for each group. In contrast, window functions return a value for every row. This allows analysts to retain the granular view of the data while applying complex calculations.

What types of problems are best solved by implementing window functions?

Window functions are ideal for tasks that require accessing data from multiple rows without losing the original row-level detail. These include calculating running totals, moving averages, rankings, cumulative sums, and other operations that depend on row-to-row comparisons.

Can you provide examples of calculating running totals or moving averages using SQL window functions?

Running totals and moving averages can be calculated using window functions like SUM() combined with OVER(PARTITION BY ...). For example, calculating a running total in SQL can be done by defining a window frame that spans from the start of a partition to the current row.

In what ways can window functions be optimized for performance when analyzing large datasets?

Optimizing window functions involves carefully indexing data and using partitions effectively to reduce unnecessary computations. Reducing the number of columns processed and ordering results efficiently also helps improve performance.

It’s crucial to plan queries to minimize resource usage when handling large-scale data.

How are partitioning, ordering, and framing concepts utilized within SQL window functions?

Partitioning divides the dataset into groups, where window functions are calculated separately.

Ordering determines the sequence of rows within each partition for calculation.

Framing specifies which rows to include around the current row, allowing precise control over the calculation scope, like defining a sliding window for averages.

Categories
Uncategorized

Azure Data Studio Delete Table: Quick Guide to Table Removal

Understanding Azure Data Studio

Azure Data Studio serves as a comprehensive database tool designed to optimize data management tasks.

It is ideal for working with cloud services and boasts cross-platform compatibility, making it accessible on Windows, macOS, and Linux.

Users benefit from features like source control integration and an integrated terminal, enhancing productivity and collaboration.

Overview of Azure Data Studio Features

Azure Data Studio is equipped with a variety of features that improve the experience of managing databases.

One of its key strengths is its user-friendly interface, which simplifies complex database operations.

Users can easily navigate through various tools, such as the Table Designer for managing tables directly through the GUI.

The software also supports source control integration, allowing teams to collaborate effortlessly on database projects.

This feature is crucial for tracking changes and ensuring consistency across different systems.

Additionally, the integrated terminal provides a command-line interface within the application, streamlining workflow by allowing users to execute scripts and commands without switching contexts.

These features collectively make Azure Data Studio a powerful tool for database professionals.

Connecting to Azure SQL Database

Connecting Azure Data Studio to an Azure SQL Database is straightforward and essential for utilizing its full capabilities.

Users need to enter the database details, such as the server name, database name, and login credentials.

This connection enables them to execute queries and manage data directly within Azure Data Studio.

The tool supports multiple connection options, ensuring flexibility in accessing databases.

Users can connect using Azure accounts or SQL Server authentication, depending on the security requirements.

Once connected, features like query editors and data visualizations become available, making it easier to analyze and manipulate data.

The seamless connection process helps users integrate cloud services into their data solutions efficiently.

Getting Started with Databases and Tables

Azure Data Studio is a powerful tool for managing databases and tables.

In the steps below, you’ll learn how to create a new database and set up a table with key attributes like primary and foreign keys.

Creating a New Database

To create a database, users typically start with a SQL Server interface like Azure Data Studio.

It’s essential to run an SQL command to initiate a new database instance. An example command might be CREATE DATABASE TutorialDB;, which sets up a new database named “TutorialDB.”

After executing this command, the new database is ready to be used.

Users can now organize data within this database by setting up tables, indexes, and other structures. Proper database naming and organization are crucial for efficient management.

Azure Data Studio’s interface allows users to view and manage these databases through intuitive graphical tools, offering support for commands and options. This helps maintain and scale databases efficiently.

Setting Up a Table

To set up a table within your new database, a command like CREATE TABLE Customers (ID int PRIMARY KEY, Name varchar(255)); is used.

This command creates a “Customers” table with columns for ID and Name, where ID is the primary key.

Including a primary key is vital as it uniquely identifies each record in the table.

Adding foreign keys and indexes helps establish relationships and improve performance. These keys ensure data integrity and relational accuracy between tables.

Users should carefully plan the table structure, defining meaningful columns and keys.

Azure Data Studio helps visualize and modify these tables through its Table Designer feature, enhancing productivity and accuracy in database management.

Performing Delete Operations in Azure Data Studio

Deleting operations in Azure Data Studio provide various ways to manage data within SQL databases. Users can remove entire tables or specific data entries. It involves using features like the Object Explorer and query editor to execute precise commands.

Deleting a Table Using the Object Explorer

Users can remove a table easily with the Object Explorer.

First, navigate to the ‘Tables’ folder in the Object Explorer panel. Right-click on the desired table to access options.

Choose “Script as Drop” to open the query editor with a pre-made SQL script.

Users then run this script to execute the table deletion.

This process provides a straightforward way to manage tables without manually writing scripts. It is particularly useful for those unfamiliar with Transact-SQL and SQL scripting.

Writing a Drop Table SQL Script

Crafting a drop table SQL script allows users to tailor their commands. This method gives more control over the deletion process.

Users must write a simple script using the DROP TABLE command followed by the table name. For example:

DROP TABLE table_name;

This command permanently deletes the specified table, removing all its data and structure.

Using such scripts ensures precise execution, especially in environments where users have many tables to handle. Writing scripts is crucial for automated processes in managing databases efficiently.

Removing Data from Tables

Apart from deleting entire tables, users might need to only remove some data.

This involves executing specific SQL queries targeting rows or data entries.

The DELETE command allows users to specify conditions for data removal from a base table.

For example, to delete rows where a column meets certain criteria:

DELETE FROM table_name WHERE condition;

These targeted operations help maintain the table structure while managing the data.

This is particularly useful in situations requiring regular data updates without affecting the entire table’s integrity. Using such queries, users ensure data precision and relevance in their databases, maintaining efficiency and accuracy.

Working with SQL Scripts and Queries

An open laptop displaying SQL scripts and queries in Azure Data Studio, with a delete table command highlighted

Working effectively with SQL scripts and queries is vital in Azure Data Studio. This involves using the query editor, understanding Transact-SQL commands, and managing indexes and constraints to ensure efficient database operations.

Leveraging the Query Editor

The query editor in Azure Data Studio is a powerful tool for managing databases. Users can write, edit, and execute SQL scripts here.

It supports syntax highlighting, which helps in differentiating between keywords, strings, and identifiers. This makes it easier to identify errors and ensures clarity.

Additionally, the query editor offers IntelliSense, which provides code-completion suggestions and helps users with SQL syntax.

This feature is invaluable for both beginners and seasoned developers, as it enhances productivity by speeding up coding and reducing errors.

Executing Transact-SQL Commands

Transact-SQL (T-SQL) commands are crucial for interacting with Azure SQL DB.

These commands allow users to perform a wide range of operations, from data retrieval to modifying database schema.

Running T-SQL commands through Azure Data Studio helps in testing and deploying changes efficiently.

To execute a T-SQL command: write the script in the query editor and click on the “Run” button.

Feedback is provided in the output pane, displaying results or error messages.

Familiarity with T-SQL is essential for tasks such as inserting data, updating records, and managing database structures.

Managing Indexes and Constraints

Indexes and constraints are key for optimizing databases.

Indexes improve the speed of data retrieval operations by creating data structures that database engines can search quickly.

It’s important to regularly update and maintain indexes to ensure optimal performance.

Constraints like primary keys and foreign key constraints enforce data integrity.

A primary key uniquely identifies each record, while a foreign key establishes a link between tables.

These constraints maintain consistency in the database, preventing invalid data entries.

Managing these elements involves reviewing the database’s design and running scripts to add or modify indexes and constraints as needed.

Proper management is essential for maintaining a responsive and reliable database environment.

Understanding Permissions and Security

A computer screen displaying Azure Data Studio with options to delete a table, surrounded by security permission settings

Permissions and security are crucial when managing databases in Azure Data Studio. They dictate who can modify or delete tables and ensure data integrity using triggers and security policies.

Role of Permissions in Table Deletion

Permissions in Azure Data Studio play a vital role in managing who can delete tables.

Users must have proper rights to execute the DROP command in SQL. Typically, only those with Control permission or ownership of the database can perform such actions.

This ensures that sensitive tables are not accidentally or maliciously removed.

For example, Azure SQL databases require roles like db_owner or db_securityadmin to have these privileges. Understanding these permissions helps maintain a secure and well-functioning environment.

Working with Triggers and Security Policies

Triggers and security policies further reinforce database security.

Triggers in SQL Server or Azure SQL automatically execute predefined actions in response to certain table events.

They can prevent unauthorized table deletions by rolling back changes if certain criteria are not met.

Security policies in Azure SQL Database provide an extra layer by restricting access to data.

Implementing these policies ensures that users can only interact with data relevant to their role.

These mechanisms are vital in environments where data consistency and security are paramount.

Advanced Operations with Azure Data Studio

A computer screen displaying Azure Data Studio with a prompt to delete a table. The interface shows options for advanced operations

Azure Data Studio extends capabilities with advanced operations that enhance user flexibility and control. These operations include employing scripts and managing databases across varying environments. Users benefit from tools that streamline database management and integration tasks.

Using PowerShell with Azure SQL

PowerShell offers a powerful scripting environment for managing Azure SQL databases.

It allows users to automate tasks and configure settings efficiently.

By executing scripts, data engineers can manage both Azure SQL Managed Instances and Azure SQL Databases.

Scripts can be used to create or modify tables, such as adjusting foreign keys or automating updates.

This approach minimizes manual input and reduces errors, making it ideal for large-scale management.

PowerShell scripts are executed through the Azure Portal, enabling users to manage cloud resources conveniently.

Integration with On-Premises and Cloud Services

Seamless integration between on-premises databases and cloud services is critical. Azure Data Studio facilitates this by supporting hybrid environments.

Users can manage and query databases hosted locally or in the cloud using Azure Data Studio’s tools.

Connection to both environments is streamlined, allowing for consistent workflows.

Data engineers can move data between systems with minimal friction.

This integration helps in maintaining data consistency and leveraging cloud capabilities alongside existing infrastructure.

Azure Data Studio bridges the gap effectively, enhancing operational efficiency across platforms.

Frequently Asked Questions

A person using a computer to navigate through a menu in Azure Data Studio, selecting the option to delete a table

Deleting tables in Azure Data Studio involves several methods depending on the user’s preferences. Users can drop tables using scripts, the table designer, or directly through the interface. Each method involves specific steps and considerations, including troubleshooting any errors that may arise during the process.

How can I remove an entire table in Azure Data Studio?

Users can remove a table by right-clicking the table in the object explorer and selecting “Script as Drop”. Running this script will delete the table. This step requires ensuring there are no dependencies that would prevent the table from being dropped.

What are the steps to delete data from a table using Azure Data Studio?

To delete data from a table, users can execute a DELETE SQL command in the query editor. This command can be customized to remove specific rows by specifying conditions or criteria.

Can you explain how to use the table designer feature to delete a table in Azure Data Studio?

The table designer in Azure Data Studio allows users to visually manage database tables. To delete a table, navigate to the designer, locate the table, and use the options available to drop it from the database.

Is it possible to delete a database table directly in Azure Data Studio, and if so, how?

Yes, it is possible. Users can directly delete a database table by using the query editor window to execute a DROP TABLE command. This requires appropriate permissions and consideration of database constraints.

In Azure Data Studio, how do I troubleshoot table designer errors when attempting to delete a table?

Common errors may relate to constraints or dependencies. Ensure all constraints are addressed before deleting.

Checking messages in the error window can help identify specific issues. Updating database schema or fixing dependencies might be necessary.

What is the process for dropping a table from a database in Azure Data Studio?

To drop a table, users should write a DROP TABLE statement and execute it in the query editor.

It is important to review and resolve any constraints or dependencies that may prevent successful execution.

For more details, users can refer to this overview of the table designer.

Categories
Uncategorized

Knight’s Tour: Mastering Implementation in Python

Understanding the Knight’s Tour Problem

The Knight’s Tour problem is a classic challenge in mathematics and computer science involving a knight on a chessboard. The aim is to move the knight so that it visits every square exactly once.

It’s important in algorithm studies and has historical significance in chess puzzles.

Definition and Significance

The Knight’s Tour problem revolves around a standard chessboard, typically 8×8, where a knight must visit all 64 squares without repeating any.

In this context, the knight moves in an “L” shape: two squares in one direction and then one square perpendicular, or vice versa.

This problem helps students and professionals understand algorithmic backtracking and heuristics. Solving a complete tour creates a path that visits all squares, showcasing skills in planning and logical reasoning.

If the knight returns to the starting position to complete a loop, it is called a closed tour problem. This variation is more complex and involves deeper problem-solving techniques.

These concepts are not only critical in understanding algorithms but also have applications in various computational and real-world scenarios.

Historical Context

The origins of the Knight’s Tour problem trace back to ancient India, with references found in early mathematical literature. It gained prominence in Western culture during the 18th century.

Mathematicians like Euler explored the challenge, making significant advancements in solving it. Over time, it became a popular puzzle in Europe, further sparking interest in both recreational mathematics and serious scientific inquiry.

Chess enthusiasts often use this historical puzzle to test their strategic thinking. The legacy of the problem also influences modern studies in computer algorithms.

This historical context illustrates how the knight’s tour problem continues to inspire new generations in the fields of mathematics and computer science.

Setting Up the Chessboard in Python

Setting up a chessboard in Python involves creating a matrix that represents the board and ensuring that the knight’s movements are legal. This guide breaks down how to initialize the board and validate knight moves effectively in Python.

Initializing the Board

To simulate a chessboard in Python, use a two-dimensional list or matrix. For an 8×8 chessboard, create a list with eight rows, each containing eight zeroes. This represents an empty board where the knight hasn’t moved yet.

board = [[0 for _ in range(8)] for _ in range(8)]

Each zero on this matrix represents an unvisited square. As the knight moves, mark squares with increasing integers to log the sequence of moves.

Initial placement of the knight can be at any coordinates (x, y). For example, starting at position (0, 0) would mark the initial move:

start_x, start_y = 0, 0
board[start_x][start_y] = 1

This setup helps in tracking the knight’s movement across the board.

Validating Knight Moves

A knight move in chess consists of an L-shaped pattern: two squares in one direction and one in a perpendicular direction.

To validate moves, check if they stay within the boundaries of the board and avoid already visited squares.

First, define all possible moves of a knight as pairs of changes in coordinates (x, y):

moves = [(2, 1), (1, 2), (-1, 2), (-2, 1), 
         (-2, -1), (-1, -2), (1, -2), (2, -1)]

To check a move’s validity, calculate the new position and verify:

  1. The move stays within the chessboard.
  2. The target square is not visited.
def is_valid_move(x, y, board):
    return 0 <= x < 8 and 0 <= y < 8 and board[x][y] == 0

These checks ensure that every knight move follows the rules of the game and helps the knight visit every square on the chessboard exactly once.

Exploring Knight’s Moves and Constraints

Understanding the Knight’s tour involves examining the unique movement patterns of the knight and the various constraints that affect its path. This knowledge is essential for implementing an efficient solution using Python.

Move Representation

A knight moves in an “L” shape on the chessboard. Specifically, this means it can jump two squares in one direction and then one square perpendicular. This results in up to eight possible moves from any position.

It’s helpful to use a matrix to represent the board, where each cell denotes a potential landing spot.

The movement can be described by pairs like (2, 1) or (-2, -1). These pairs dictate how the knight can traverse the board, making it crucial to track each move’s outcome accurately.

Constraint Handling

Constraints in the Knight’s tour include ensuring the knight remains within the board’s edges and visits each square only once.

Detecting when a move would exceed the board’s limits is crucial. This requires checking boundary conditions before each move, ensuring the x and y coordinates remain within permissible ranges.

In Python, this can be managed by verifying if new positions lie within a defined matrix size.

Another critical constraint is avoiding revisiting any square. Tracking the visited positions with a boolean matrix helps manage this. Each cell in the matrix records if it has been previously occupied, ensuring the knight’s path adheres strictly to the tour’s rules.

Algorithmic Approaches to Solve the Tour

Several methods can be employed to solve the Knight’s Tour problem, each with its strengths and considerations. The approaches include brute force, backtracking, and graph-based techniques, which offer different perspectives to address this classic problem.

Brute Force Methods

The brute force approach involves trying all possible sequences of moves to find a solution. This method systematically generates all valid paths on the chessboard, examining each to check if it forms a valid tour.

Given the complex nature of the Knight’s movements, the sheer number of possibilities makes this method computationally expensive. Although it can theoretically find a solution, it’s usually impractical for large boards due to the time required.

Brute force can be useful for small boards where the number of potential paths is manageable. This method acts as a baseline for understanding the complexity of the problem, often serving as a stepping stone to more efficient algorithms.

Backtracking Fundamentals

Backtracking is a fundamental approach for solving constraint satisfaction problems like the Knight’s Tour. It involves exploring possible moves recursively, backtracking upon reaching an invalid state, and trying another move.

The algorithm prioritizes unvisited squares, searching for a valid path by probing different sequences of moves. Each move is part of a potential solution until it reaches a conflict.

In practice, backtracking is more efficient than brute force. By discarding unpromising paths early, it significantly reduces the search space, finding solutions faster. This method is implemented in various programming languages and is often a preferred technique to solve the problem.

Graph Algorithms in Theory

Viewing the Knight’s Tour as a graph problem offers another angle. A chessboard can be seen as a graph where each square is a node, and valid Knight moves are edges connecting these nodes.

Using graph algorithms like Warnsdorff’s rule significantly simplifies solving the tour. This heuristic approach chooses the next move that has the fewest onward moves, aiming to complete the tour more strategically.

Graph theory provides a structured way to analyze and solve the tour, emphasizing efficient pathfinding. These algorithms highlight important concepts in both theoretical and practical applications, exemplifying how mathematical models can enhance problem-solving.

Programming the Backtracking Solution

The backtracking algorithm is used in computer science to find solutions by exploring possibilities and withdrawing when a path doesn’t lead to the solution. In the context of the Knight’s Tour problem, this method helps navigate the chessboard effectively. Key aspects are addressed by using recursive functions and focusing on important details of algorithms.

Developing the solveKT Function

The solveKT function is crucial for finding a path where a knight visits every square on a chessboard exactly once. This function initiates the exploration, preparing an initial board with unvisited squares. It uses a list to store the tour sequence.

A helper function checks for valid moves, ensuring the knight doesn’t revisit squares or step outside the board boundaries.

The function tries moves sequentially. If a move doesn’t work, the algorithm backtracks to the last valid point, making solveKT a central part in using the backtracking algorithm for this problem.

This organized method successfully tackles the tour by following a procedure that iterates through all possible moves.

Recursion in the Algorithm

Recursion is essential to this algorithm. It involves calling a function within itself to approach complex problems like chessboard traversal.

The recursive approach tests every possible position, mapping out paths for the knight. If a solution is found or no more moves remain, the function returns either the successful path or an indication of failure.

By structuring the solve function recursively, each call represents a decision point in the search tree. This allows the algorithm to explore various possibilities systematically. If a path is a dead end, recursion facilitates stepping back to try new alternatives, ensuring every potential route is investigated for a solution.

Implementing the Knight’s Tour in Python

The Knight’s Tour problem involves moving a knight on a chessboard to visit every square exactly once. Implementing this in Python requires creating an efficient algorithm to handle the knight’s movements and ensuring every square is visited without repetition.

Code Structure and Flow

To implement the Knight’s Tour in Python, the code is typically based on a recursive backtracking algorithm, such as solveKTUtil. This function aims to place knights on a board while following the rules of movement in chess.

A crucial aspect is checking every possible move before making it. The board state must be updated as the knight moves, and if a move leads to no further actions, it should be undone. This backtracking ensures all possibilities are explored.

Lists or other data structures can store possible moves, which helps in analyzing which path to take next. For ease of understanding, using a matrix to represent the board is common practice.

Utilizing Python Algorithms

The Depth First Search (DFS) algorithm is valuable for this problem. By using DFS, the algorithm can explore the deepest nodes, or moves, before backtracking. This helps in finding the knight’s path effectively.

Python’s capabilities are further harnessed by employing functions that can evaluate each move. This involves checking board boundaries and ensuring a square hasn’t been visited.

To facilitate this, a visited list can track the status of each square.

Heuristic methods are sometimes employed to optimize the path, like moving to the square with the fewest onward moves next. This approach is known as Warnsdorff’s rule and can enhance performance in some cases.

Optimizations and Enhancements

Optimizing the Knight’s Tour problem involves both reducing computation time and improving solution efficiency. These methods focus on enhancing the performance of search algorithms by leveraging techniques such as the backtracking algorithm and depth-first search (DFS).

Reducing Computation Time

One effective strategy is using a backtracking algorithm. This method allows the search to backtrack when a potential path is not feasible, avoiding unnecessary calculations.

By doing this, less time is spent on dead-end paths.

Additionally, applying the Warnsdorff’s rule is another optimization. It involves choosing the next move based on the fewest available future moves.

This heuristic reduces the number of checks required at each step, effectively cutting down computation time.

In programming languages like Python, these approaches help manage resources and improve performance on large chessboards.

Improving Solution Efficiency

A key enhancement is improving vertices traversal by using advanced search strategies like DFS. This helps explore all possible paths without revisiting already explored vertices, thus improving efficiency.

Incorporating heuristics into search algorithms can streamline the pathfinding process. These heuristics, such as prioritizing moves leading to lower unvisited degree, help reach a solution more effectively.

Python’s capabilities can be extended by using libraries that facilitate complex calculations. By focusing on these enhancements, solutions to the Knight’s Tour become faster and more efficient.

Handling Dead Ends and Loop Closures

Managing dead ends and creating loop closures are crucial in solving the Knight’s Tour problem efficiently. These techniques help ensure the tour is complete and circular, allowing the knight to return to the starting square.

Detecting Dead Ends

Dead ends occur when the knight has no valid moves left. During the knight’s tour, detecting these dead ends ensures that the solution is correct.

One method is to implement a depth-first search algorithm, which explores possible moves deeply before backtracking. When a move leaves the knight with no further options, it signals a dead end.

Another approach is using heuristic methods, such as the Warnsdorff’s Rule, which suggests prioritizing moves that lead to squares with fewer onward options. This strategy helps reduce the chances of hitting dead ends by keeping the knight’s path more open.

Achieving a Closed Tour

A closed tour means the knight returns to its starting position, forming a complete circuit. To achieve this, it is pivotal to continually evaluate the knight’s moves to ensure a path back to the original square. Adjustments to the algorithm might be necessary if the tour is incomplete.

One popular method for ensuring a closed tour is combining backtracking techniques with specific rules, as described for addressing loop closures.

Implementing pre-fill methods where possible loop closures are identified and tested beforehand also helps.

By focusing on these techniques and understanding the nature of each move, programmers can create efficient algorithms that handle both dead ends and closures effectively.

Visualizing the Knight’s Tour

Visualizing the Knight’s Tour helps bring clarity to how a chess knight can move across the board, visiting each square once. Key aspects include generating a visual representation and exploring different techniques for effective solution visualization.

Creating a Visual Output

One effective way to visualize the Knight’s Tour is by creating a visual output using programming tools. For instance, the printsolution function in Python can display the path taken by the knight. This allows each move to be indexed neatly, forming a grid that maps out the entire sequence.

Libraries like Matplotlib or Pygame can be utilized to enhance this visualization. They provide graphical interfaces to draw the knight’s path and help track the moves more dynamically.

By representing moves with arrows or lines, users can easily follow the knight’s journey. It’s helpful to mark starting and ending points distinctly to highlight the complete tour.

Solution Visualization Techniques

There are several techniques for solution visualization to display the tour effectively. One approach is using a matrix to represent the chessboard, where each cell contains the move number. This detailed mapping aids in understanding the knight’s progression.

Another method involves interactive visualizations. Platforms such as Medium offer examples of how to visually present the tour using digital diagrams.

These techniques can illustrate complex paths and show potential routes the knight might take. Visualization tools are invaluable for diagnosing issues in algorithms and improving pathfinding in more complex versions of the problem.

Evaluating Tour Solutions

Evaluating solutions for the Knight’s Tour involves understanding the structure of the search tree and identifying key characteristics of a successful tour. The considerations help determine the efficiency and effectiveness of a solution.

Analyzing the Search Tree

A search tree is an essential tool in solving the Knight’s Tour. Each node in the tree represents a possible move of the knight on the chessboard. The root of the tree starts with the initial position, and branches represent subsequent moves.

Analyzing the depth and breadth of the tree helps in assessing the efficiency of finding a solution.

The complexity of the search tree grows with the size of the chessboard. Efficient algorithms reduce unnecessary branches.

Methods like backtracking, where the algorithm reverses moves if it reaches a dead-end, help manage the complexity. Using a heuristic method like Warnsdorff’s rule can also guide the knight by selecting the move that leaves the fewest onward moves, which optimizes the search process.

Tour Solution Characteristics

A successful Knight’s Tour must meet specific characteristics. It involves visiting every square exactly once, which ensures that the solution covers the entire chessboard.

A common feature in solutions is the knight’s ability to form a path, either open or closed. An open tour does not end on a square reachable by a knight’s move from the start position. Conversely, a closed tour, or cycle, does.

The Python implementation of Knight’s Tour often utilizes recursive functions, backtracking, and heuristics to accomplish this task.

The movement and flexibility of the knight across the board are pivotal. Observing these features in the tour ensures a comprehensive understanding and assessment of the executed solution.

Navigating Complex Chessboard Scenarios

The Knight’s Tour problem involves strategies to navigate varied and complex chessboard challenges. Important considerations include dealing with different board sizes and varying starting positions, which add complexity to finding a complete tour.

Variable Board Sizes

The size of the chessboard dramatically influences the complexity of the Knight’s Tour. On larger boards, the number of unvisited vertices grows, requiring more sophisticated algorithms. The time complexity increases as the board size grows because each move offers multiple possibilities.

To address this, backtracking algorithms are often used. This method helps cancel moves that violate constraints and systematically tries alternative paths.

Such strategies have proved effective, especially on non-standard board dimensions.

These algorithms help find solutions efficiently, even when faced with large grid sizes that exponentially increase possible paths. FavTutor explains that understanding the time complexity becomes crucial as the board expands.

Starting from Different Positions

Choosing different starting positions for the knight adds another layer of complexity. Each starting point influences the sequence of moves and the likelihood of finding a successful tour. A knight starting position that is central may have more accessible paths compared to one on the board’s edge.

Different starting positions require adjustments in strategy to ensure all squares are visited. Algorithms must account for this flexibility, often using heuristics like Warnsdorff’s rule to prioritize moves that have the least subsequent options.

This ensures that the knight doesn’t become trapped in a corner of unvisited vertices.

Exploring various starting points offers a broader understanding of potential solutions, enhancing the algorithm’s robustness in addressing diverse scenarios. The article on GeeksforGeeks discusses how these variations impact the approach.

Best Practices and Tips

When tackling the Knight’s Tour problem in Python, focusing on code readability and maintaining a strong grasp of algorithmic thinking can make the process smoother. These practices enhance understanding and enable effective problem-solving.

Code Readability and Maintenance

Writing clear and readable code is crucial in Python, especially for complex problems like the Knight’s Tour. Use descriptive variable names to convey the purpose of each element involved. For example, use current_position or possible_moves instead of generic identifiers like x or y.

Comments play a vital role. Explaining tricky sections, such as the logic for checking valid moves, helps others and your future self understand the thought process.

Consider formatting your code with proper indentation to distinguish between different levels of logic, such as loops and conditionals.

Implementing the Knight’s Tour often involves using backtracking, which can be complex. Breaking down the solution into functions, each handling specific tasks, ensures cleaner, more readable code. For example, separate functions can be made for generating all possible moves versus actually placing the knight on the board.

Algorithmic Thinking

The Knight’s Tour requires strategic thinking and planning. Begin by understanding the backtracking concept. This involves exploring all potential moves by placing the knight on each square of the chessboard, then retracing steps if a dead-end is reached.

Incorporate the concept of neighbors—all possible squares a knight can jump to from a given position. This helps when analyzing moves the algorithm can consider.

Utilize data structures like a stack to store states when simulating moves.

Visualizing the problem using lists or tables may help map potential paths clearly. This insight assists in assessing which moves are optimal at each step.

Prioritize moves that fewer neighbors can reach, reducing future complexities. This technique, known as Warnsdorff’s Rule, can improve efficiency and solution reliability.

Frequently Asked Questions

Understanding the Knight’s Tour involves exploring different techniques and rules used to navigate a chessboard. This section addresses specific concerns about implementing the Knight’s Tour in Python, focusing on strategies, complexity, and data structures.

What is the Warnsdorff’s Rule, and how is it applied in the Knight’s Tour problem?

Warnsdorff’s Rule is a heuristic used to guide the Knight’s moves. It suggests choosing the move that leads to the square with the fewest onward moves.

This rule aims to minimize dead ends and improve the chances of completing the tour successfully. By doing this, the pathfinding is more efficient and solvable.

How can you represent a chessboard in Python for solving the Knight’s Tour?

A chessboard can be represented in Python using a two-dimensional list (a list of lists). Each sublist corresponds to a row on the board. This setup allows easy access to individual squares by their row and column indices, which is crucial for navigating the Knight’s moves effectively during the implementation.

In terms of algorithm complexity, how does the Backtracking method compare to Warnsdorff’s Rule for the Knight’s Tour?

The Backtracking method is generally more computationally intensive compared to Warnsdorff’s Rule. Backtracking involves exploring all potential paths, which can be time-consuming.

In contrast, Warnsdorff’s Rule reduces unnecessary calculations by prioritizing moves that are less likely to lead to a dead end, making it a more efficient option for solving the tour.

What data structure can be utilized to efficiently track the Knight’s movements in solving the Knight’s Tour?

An array or list can efficiently track the Knight’s movements.

Typically, this involves using a list to store tuples containing the coordinates of each visited square. This method allows for quick checks of the Knight’s current position and the path taken, facilitating efficient backtracking and move validation.

How do you ensure all moves are valid when implementing the Knight’s Tour algorithm in Python?

To ensure all moves are valid, the algorithm must check that each potential move stays within the chessboard’s boundaries and that squares are visited only once.

This involves conditions in the code to validate each move’s position against the board’s limits and a tracking system to mark visited squares.

What techniques are used to optimize the search for a Knight’s Tour solution?

Optimizing the Knight’s Tour solution can involve using both Warnsdorff’s Rule and backtracking with pruning strategies.

Pruning reduces redundant paths by cutting off those that lead to dead ends early.

Additionally, starting the tour from the center rather than the corners can further decrease the search space and improve efficiency.

Categories
Uncategorized

Building Time Series Forecasting Models in SQL: A Comprehensive Guide

Understanding Time Series Data in SQL

Time series data consists of sequences of data points collected or recorded at successive times, usually at uniform intervals.

In SQL, this type of data is stored in tables where each row represents a specific time and includes one or more metrics. This setup makes it possible to analyze trends, detect seasonality, and forecast future values.

Understanding trends and seasonality is crucial when working with time series data. A trend indicates a long-term increase or decrease in values, while seasonality shows periodic fluctuations.

SQL functions and queries can help identify these patterns by analyzing historical data, allowing analysts to detect underlying trends.

To perform time series analysis, SQL offers aggregation functions, window functions, and various date-based operations.

These tools help in breaking down data into manageable parts, computing averages, or identifying spikes. Such capabilities make SQL a powerful tool for gaining insights into time series data.

Here’s a simple table of SQL functions often used in time series analysis:

Function Use
AVG() Compute the average of a metric over time
SUM() Total sum of a metric over specified time periods
ROW_NUMBER() Rank or order events in time series data
DATE_TRUNC() Truncate date/time to particular precision

Setting Up the SQL Environment

To start building time series forecasting models in SQL, it’s important to create appropriate time series data structures and understand the necessary SQL functions for managing time. This section will guide you through setting up these essential components.

Creating Time Series Data Structures

When working with time series data, it’s crucial to organize the data in a way that allows efficient querying and analysis.

This typically involves the use of a CREATE TABLE statement. Selecting the right data types for each column is a central consideration. For time-related data, using DATETIME or TIMESTAMP ensures accurate time representation.

Another essential aspect is defining indexes on time columns. Indexing can enhance query performance significantly when retrieving time-specific data.

Including time-stamped columns like created_at or recorded_time helps filter and sort data efficiently.

When using SQL Server, ensure that your tables are optimized for time series data by considering partitioning strategies that facilitate quick data retrieval and storage.

Defining Time-Related SQL Functions

SQL provides several powerful functions to handle date and time data effectively.

Functions like DATEADD, DATEDIFF, and DATENAME enable manipulation and calculation of date and time values. Understanding these functions helps transform and analyze time-stamped data easily.

For platforms like T-SQL in SQL Server, advanced features such as LEAD and LAG functions can be used to access previous or next rows in a dataset, vital for time series analysis.

Additionally, time zone functions are crucial if the data source involves multiple time zones.

Leveraging these tools appropriately ensures the time series model can process and predict accurately based on historical data.

SQL Techniques for Time Series Analysis

A computer screen with SQL code for time series analysis

Time series analysis in SQL relies on robust techniques to manage and interpret chronological data. Focusing on data aggregation methods and specific SQL functions enhances the depth of analysis possible.

Data Aggregation and Window Functions

Data aggregation is vital for summarizing time series data, providing insights into trends over specified periods.

SQL’s window functions excel in calculating these summaries without altering the dataset structure. Using functions like SUM(), AVG(), and COUNT() over specified partitions enables users to create moving averages and cumulative totals.

Window functions allow you to define a “window” of data points for these calculations. This approach retains row-level details while providing context through aggregated views.

For instance, calculating a moving average over a monthly window helps in identifying long-term trends and smoothing out noise.

Utilizing the Lag Function for Time Series

The LAG() function in SQL is instrumental in analyzing time series data by referencing the previous row of data within a result set. This function is crucial for computing differences or growth rates over time, such as finding daily or monthly changes in data.

By specifying an offset, LAG() retrieves data from earlier periods, which is particularly useful in t-sql for tasks like calculating period-over-period changes.

Combined with other SQL techniques, such as window functions, the LAG() function provides a comprehensive view of time-related changes, supporting more detailed and nuanced analysis.

Implementing SQL-Based Moving Averages

A computer screen with SQL code for moving averages and time series forecasting models displayed, surrounded by notebooks and a cup of coffee

Moving averages are key tools in time series analysis, helping to smooth data and identify trends. In SQL, both simple and exponential moving averages can be implemented to uncover patterns in data. This section explores how to compute these moving averages using SQL, offering practical guidance and examples.

Calculating Simple Moving Averages

A Simple Moving Average (SMA) calculates the average of a set number of past data points. SQL can handle SMAs using window functions, which streamline the calculation.

For example, using PostgreSQL, one might use the AVG function combined with OVER to determine the average over a specified window of data points.

Here’s an example SQL query for calculating a simple moving average:

SELECT date, value,
       AVG(value) OVER (ORDER BY date ROWS BETWEEN 4 PRECEDING AND CURRENT ROW) as simple_moving_average
FROM time_series_data;

This query computes the SMA over the previous five data points, helping to smooth short-term fluctuations and highlight longer-term trends.

Applying Exponential Moving Averages

An Exponential Moving Average (EMA) gives more weight to recent data points, making it more responsive to changes. Unlike SMAs, EMAs require recursive calculations, where each previous EMA impacts the current calculation.

To implement an EMA in SQL, user-defined functions may be necessary because SQL does not natively support recursion in calculations.

Users can also break the task into iterative components in application code, computing each EMA value step by step and storing results back into the database for analysis.

EMAs are particularly useful for detecting short-term trends while maintaining sensitivity to recent changes. They prioritize recent data, which can be vital for timely decision-making in fields like finance and inventory management.

Time Series Forecasting Fundamentals

A computer screen with SQL code and a time series forecasting model graph displayed

Time series forecasting plays a crucial role in predicting future data points by analyzing past trends. It involves techniques to model patterns like trends, seasonality, and cycles.

Time series data consist of observations collected sequentially over time. They are used to make predictions based on historical data. An example includes predicting sales based on past transaction data.

Forecasting models need to account for various components:

  • Trend: The overall direction of the data over a long period.
  • Seasonality: Regular fluctuations that occur at specific intervals.
  • Noise: Random variations that cannot be explained by the model.

A common method in time series forecasting is linear regression. It’s praised for its simplicity and ability to identify relationships between variables. For deeper insights, more complex models like ARIMA or exponential smoothing are also used.

Key Steps in Time Series Forecasting:

  1. Data Collection: Gather historical data.
  2. Data Preparation: Clean and preprocess the data.
  3. Model Selection: Choose appropriate techniques like ARIMA or linear regression.
  4. Model Training: Fit the model using the data.
  5. Evaluation: Test the model’s accuracy.

By selecting the right model, analysts can better forecast future trends and make informed decisions.

Implementing these models in SQL can be effective for analysts working within database environments. SQL offers tools to prepare data, apply models, and evaluate results.

Techniques for using SQL in forecasting include data functions and specialized commands to manage time series data.

To learn more about SQL techniques, check out SQL techniques for time series forecasting.

Advanced SQL Forecasting Techniques

A computer screen displaying SQL code for time series forecasting models

Advanced SQL forecasting techniques provide robust tools for building precise time series models. These methods often incorporate elements such as regression analysis and seasonality, giving analysts the power to make more informed predictions.

Regression Analysis in SQL

Regression analysis is a core technique in time series forecasting. In SQL, specifically T-SQL, linear regression is commonly used to model relationships between variables over time. It helps in understanding how different factors influence the trend of the dataset.

One method involves using the LINEST function or similar commands to compute statistical values. This process identifies trends by generating a best-fit line through the data points. The coefficients of the line can then predict future values.

SQL Server facilitates this by allowing regression analysis directly in the database, minimizing the need for external tools. This integration enhances data processing speed and efficiency, making it a valuable tool for time series forecasting with SQL.

Incorporating Seasonality into Models

Incorporating seasonality is crucial for more accurate time series forecasts, especially for datasets showing recurring patterns.

SQL enables this through models like ARIMA and SARIMA, which are sophisticated tools for handling seasonal data.

For ARIMA models, SQL Server features can process seasonal differencing to remove seasonality before applying the model.

SARIMA, an extension of ARIMA, accommodates both seasonal and non-seasonal components. This makes it particularly useful when datasets show complex periodicity.

These models require careful tuning of parameters to match the seasonal patterns present in the data.

Advanced techniques in T-SQL make it possible to create these models directly in the database, streamlining the forecasting process and improving the accuracy of predictions.

Integration of SQL and Machine Learning

A computer screen displaying SQL code and a machine learning algorithm building time series forecasting models

Integrating SQL with machine learning simplifies data handling and analysis by combining the robust data querying capabilities of SQL with the predictive power of machine learning models. This section explores how to build and evaluate forecasting models using SQL.

Building Machine Learning Models for Forecasting

Machine learning models can be trained using SQL to forecast future trends from historical data.

SQL facilitates data preparation by allowing users to clean and transform data efficiently. Once data is ready, Python or R can be used to create models.

Through seamless integration, SQL retrieves data while machine learning libraries handle the model training process.

In some cases, SQL extensions may directly support machine learning tasks, reducing the need for external scripts.

For instance, platforms like Nixtla’s StatsForecast offer statistical models that integrate with SQL to provide robust solutions.

Evaluating Machine Learning Model Performance

Evaluating a machine learning model involves assessing its accuracy and reliability in predicting future values.

SQL plays a crucial role here by enabling the calculation of key performance metrics.

After training a model using Python or another language, SQL can be used to query and summarize these metrics from the model outputs.

Metrics such as Mean Absolute Error (MAE) or Root Mean Squared Error (RMSE) help determine model effectiveness.

SQL’s ability to handle large datasets makes it invaluable for tracking and comparing different model performances over time. This integration ensures that models are not only accurate but also can be efficiently managed and monitored.

Introduction to ARIMA Models within SQL

A computer screen displaying SQL code for building ARIMA time series forecasting models

ARIMA models can be a powerful tool for time series forecasting. These models help predict future values based on past data.

In SQL, ARIMA models provide a structured approach to analyzing time series data.

Time series data comprises data points indexed in time order. In SQL, this data is stored in tables. Each row represents a point in time with corresponding metrics.

Using ARIMA in SQL involves managing large datasets effectively to forecast future trends.

To build an ARIMA model, one first needs to prepare the data in SQL. Create a VIEW to focus on the relevant dataset. This keeps your processes clear and organized.

The model works by identifying patterns, such as trends or seasonality, and predicting future values.

Model building in SQL with ARIMA requires the identification of three components: AutoRegressive (AR), Integrated (I), and Moving Average (MA). These components use lags of the data, differences, and errors to create forecasts.

Steps in Building ARIMA Models in SQL:

  1. Data Collection: Gather time series data and store it in your SQL database.
  2. Data Preparation: Preprocess the data by creating SQL views.
  3. Model Training: Use SQL queries to calculate ARIMA parameters.
  4. Forecasting: Apply the model to predict future data points.

Properly organizing and querying the data in SQL helps in building efficient ARIMA models. SQL provides robust functionality for managing and extracting insights from large datasets, which is critical for accurate time series forecasts.

Optimizing SQL Queries for Performance

A computer screen displaying a complex SQL query with a time series forecasting model being optimized for performance

Efficient SQL queries are key to maximizing database performance and reducing processing time. This section explores essential techniques for enhancing SQL query performance and the role of SQL Server Analysis Services (SSAS) in managing data analysis and mining.

Performance Tuning SQL Code

Optimizing SQL code can greatly improve run-time efficiency. Indexing is a crucial method that speeds up data retrieval. Proper indexing strategies involve using primary keys and avoiding excessive or redundant indexes.

Another approach is to minimize the use of wildcard characters in LIKE queries, which can significantly slow down searches.

Query execution plans provide valuable insights into query performance. Tools like SQL Server Management Studio can be used to analyze these plans, allowing developers to identify bottlenecks.

Eliminating unnecessary columns in SELECT statements and using joins judiciously also enhances performance. Lastly, leveraging stored procedures instead of dynamic SQL can reduce overhead and increase speed.

SQL Server Analysis Services (SSAS)

SQL Server Analysis Services (SSAS) is pivotal in data analysis, particularly for complex calculations and time series predictions. SSAS supports features like data mining and OLAP (Online Analytical Processing), enabling advanced analytics.

It processes data in ways that can optimize query performance by pre-aggregating data, reducing the load on SQL queries.

To optimize SSAS performance, the design of dimensions and cubes should be carefully considered. Effective usage of partitioning can decrease processing time by dividing data into manageable parts.

Furthermore, tuning SSAS memory settings helps to allocate sufficient resources for analysis tasks. SSAS management tools also assist in monitoring and optimizing cube processing and partition strategies.

Practical SQL Applications for Financial Time Series

A computer screen displaying a financial time series chart with SQL code on the side, a calculator, and a notebook with handwritten formulas

Financial time series can be effectively managed with SQL to analyze trends and make strategic decisions. This includes tracking key financial securities and generating critical buy and sell signals.

Tracking Financial Securities

Tracking financial securities like stocks or bonds requires accurate data analysis to identify trends. SQL can manage and analyze large datasets efficiently.

By using SQL queries, it is possible to extract information on stock values, trading volumes, and other key indicators over time.

For instance, tracking the performance of a specific stock like AAPL involves examining historical trading data. Queries can be crafted to compare past performance with current data, helping to identify potential growth or downturns.

SQL functions such as AVG() to calculate moving averages and MAX() or MIN() to find peaks and troughs can be particularly useful. These tools help in identifying long-term trends, ensuring decisions are data-driven.

Generating Buy and Sell Signals

Generating accurate buy and sell signals is crucial for traders. SQL supports the development of algorithms that analyze financial data to determine optimal trading windows.

By examining historical data, SQL can pinpoint when securities reach specific thresholds, indicating a time to buy or sell.

SQL helps automate this by using triggers and stored procedures. For example, setting a threshold using SQL queries can alert traders when the stock price of AAPL hits certain high or low points.

This involves analyzing data patterns within set periods to identify a buy-sell cycle.

Traders can benefit from SQL’s ability to process data in real-time, ensuring signals are timely and actionable. This efficiency helps in maximizing profits and minimizing risks in trading decisions.

Enhancing Business Strategies with Time Series Analysis

A person working at a computer, analyzing time series data in SQL, with charts and graphs displayed on the screen

Time series analysis helps businesses use historical data to make informed decisions. By focusing on resource allocation and predictive modeling, companies can improve efficiency and boost profits.

These techniques allow for precise planning and forecasting, ensuring that resources are used wisely and returns on investments are maximized.

Data-Driven Resource Allocation

Allocating resources efficiently is crucial for business success. Time series analysis enables companies to predict future needs and adjust their resources accordingly.

By analyzing patterns in data over time, businesses can identify peak demand periods and allocate staffing or inventory more effectively.

Using SQL to manage and query time series data allows for quick updates and real-time analysis. This data-driven approach ensures that decisions are based on actual trends rather than assumptions, reducing waste and optimizing operations.

Businesses can also set alerts in their systems to anticipate changes in demand, allowing them to act swiftly when needed. This proactive approach minimizes downtime and maintains service quality.

Maximizing ROI with Predictive Modeling

Predictive modeling uses historical data to project future events, helping businesses invest wisely.

By leveraging time series analysis, companies can predict sales trends, market changes, and customer behavior.

This foresight allows businesses to focus efforts on areas with the highest potential returns. SQL queries can identify these patterns in the data, highlighting opportunities for growth.

Investing in predictive modeling tools enhances decision-making by providing clear insights into future possibilities.

Companies can test different scenarios and strategies, ensuring they choose the best path for maximum ROI. This strategic foresight helps businesses stay competitive and responsive to market demands.

Choosing the Right Tools for Time Series Analysis

A desk with a computer, notebook, and pen. A whiteboard with time series data and equations. An open SQL software on the computer screen

Choosing the right tools is crucial for effective time series analysis. SQL, especially in PostgreSQL, is widely used to handle and query large datasets. It is great for storing and retrieving data, but for statistical analysis, combining SQL with other tools can be beneficial.

Python is a popular choice due to its rich ecosystem of libraries like Pandas and NumPy. These libraries offer robust functions for data manipulation and statistical operations.

Additionally, machine learning frameworks such as TensorFlow or PyTorch extend Python’s capabilities for more complex analyses.

R is another powerful tool for time series analysis. It is known for its statistical packages like forecast and timeSeries, which are tailored for time-related data. Analysts favor R for its comprehensive visualization capabilities and ease in statistical modeling.

Each tool has its own strengths and weaknesses:

Tool Strengths Weaknesses
SQL Efficient querying Limited statistical analysis
Python Versatile libraries Steeper learning curve
R Strong statistical packages Slower with very large datasets

Combining tools can offer the best approach. For instance, using SQL for data extraction, Python for processing, and R for visualization can harness the strengths of each tool.

Selecting the appropriate software tools depends on the specific needs of the analysis and the available resources.

Frequently Asked Questions

Time series forecasting in SQL involves using SQL queries and functions to analyze past data and predict future trends. Through various methods, such as linear regression and exponential smoothing, SQL can be a powerful tool for forecasting in data science.

How can one perform forecasting in SQL using time series data?

Performing forecasting with SQL involves analyzing time-series data by writing queries that utilize SQL’s built-in functions. Users can manipulate data, extract trends, and make predictions by applying techniques like moving averages and linear regression.

What are the steps to aggregate time series data in SQL for forecasting purposes?

Aggregating time series data in SQL typically involves using SQL’s GROUP BY and ORDER BY clauses. These functions help organize data by time intervals. Once data is sorted, applying calculations like sums or averages enables clearer trend analysis for forecasting.

What methods are available in SQL Server for building time series forecasting models?

SQL Server supports several methods for building forecasting models, including linear regression and moving averages. By leveraging SQL queries, users can construct time series models directly in SQL Server environments, analyzing data for more accurate forecasts.

How do you implement exponential smoothing for time series data in SQL?

Exponential smoothing can be implemented in SQL by creating queries that calculate weighted averages of past data. These weighted averages are used to smooth out short-term fluctuations and highlight longer-term trends, aiding accurate forecasts.

Which SQL functions facilitate linear forecasting in time series analysis?

SQL functions like LINEAR_REGRESSION and FORECAST can be utilized for linear forecasting in time series analysis. These functions help compute linear trends, making it easier to predict future data points based on historical data in SQL.

Can you outline the different time series forecasting approaches that can be executed within SQL?

Various approaches for time series forecasting in SQL include linear regression, moving average, and exponential smoothing.

Each method has specific use cases and strengths, allowing users to choose based on data characteristics and desired forecast precision.

Categories
Uncategorized

Learning Beginner SQL Skills for Data Analysis: A Clear Guide for New Analysts

Understanding the Basics of SQL

Structured Query Language (SQL) is key for managing and using data in relational databases.

It includes fundamental concepts like data types, commands, and syntax that are essential for data analysis.

Essential SQL Data Types

SQL uses a variety of data types to ensure data is stored correctly. Numeric data types such as INT and FLOAT accommodate whole numbers and decimals.

Character data types, like CHAR and VARCHAR, handle strings of text. Date and time data types, such as DATE and TIMESTAMP, handle date and time information.

It’s important to select the appropriate data type for each field to ensure data integrity and optimize database performance.

Knowing these types helps efficiently store and retrieve data across different SQL operations.

Database Structure and Schemas

Each SQL database typically follows a certain structure. A database schema defines the organization of data, detailing tables, fields, and their relationships. Schemas ensure that data is organized consistently.

Tables are the core components, consisting of rows and columns. Each table might represent a different entity, like customers or orders, with a set of fields to hold data.

Understanding how tables are connected through keys, such as primary and foreign keys, enables complex data queries and operations.

Fundamental SQL Commands

SQL commands are vital for database management. Data Definition Language (DDL) commands like CREATE, ALTER, and DROP are used to define and modify database structures.

Data Manipulation Language (DML) commands such as INSERT, UPDATE, and DELETE manage the data within tables.

Data Query Language (DQL) commands, with SELECT being the most common, allow users to retrieve and view data.

Mastery of these commands enables precise data handling and is essential for executing tasks related to data analysis and manipulation.

SQL Syntax and Statements

A solid grasp of SQL syntax is necessary. SQL statements follow a structured format, beginning with a command followed by clauses that specify actions and conditions.

Clauses like WHERE, ORDER BY, and GROUP BY refine queries to target specific data and organize results.

Understanding syntax helps craft efficient queries and commands, ensuring that operations yield correct and useful data results.

Familiarity with statements such as joins and subqueries enhances data analysis capabilities by allowing for more complex data manipulations.

Writing Basic SQL Queries

Learning how to write basic SQL queries is essential for data analysis. The ability to craft select statements, filter data, and sort results using SQL gives analysts the power to interact effectively with databases.

Crafting Select Statements

The SELECT statement is the foundation of SQL queries. It is used to retrieve data from one or more tables in a database.

The syntax begins with the keyword SELECT, followed by the columns you want to retrieve.

For example, SELECT name, age FROM employees; fetches the name and age columns from the employees table.

If you need to select all columns, you can use the asterisk (*) wildcard.

It’s important to use this feature carefully, as retrieving unnecessary columns can impact performance, especially in large datasets.

By mastering the SELECT statement, users can efficiently extract data tailored to their needs.

Filtering Results with the Where Clause

The WHERE clause is vital for filtering data in SQL queries. It allows users to specify conditions that the data must meet.

For example, SELECT * FROM employees WHERE age > 30; retrieves records where the age is greater than 30.

Several operators help refine conditions in the WHERE clause. These include LIKE for pattern matching, IN for specifying multiple values, and BETWEEN for selecting a range.

The use of logical operators like OR enhances flexibility, enabling complex conditions.

For instance, SELECT * FROM employees WHERE department = 'Sales' OR age > 40; filters based on department or age criteria.

Sorting Results with Order By

The ORDER BY clause is used to sort query results. It defaults to ascending order (ASC) but can be changed to descending (DESC) to reverse the order.

The syntax follows the column name with ORDER BY, such as SELECT * FROM employees ORDER BY age DESC;, which sorts employees by age in descending order.

Multiple columns can be included, allowing for secondary sorting criteria.

For example, ORDER BY department ASC, age DESC; sorts primarily by department in ascending order, then by age in descending order within each department.

This sorting flexibility allows users to display data in the most informative way.

Data Retrieval Techniques

Extracting useful insights from databases is crucial in data analysis. Knowing how to retrieve data efficiently can transform raw information into actionable knowledge. These techniques highlight how to work with multiple tables, integrate data using joins, and leverage advanced queries.

Retrieving Data from Multiple Tables

To work with data spread across multiple tables, using SQL effectively is key. Retrieving data from multiple tables often involves managing relationships between them.

Joins play a critical role here, allowing users to fetch coordinated information without duplicating datasets.

Another technique is the use of foreign keys. These help in maintaining relationships between tables, ensuring data consistency.

For larger databases, setting clear relationships is important for maintaining accuracy and avoiding errors during retrieval. Indexes are also essential; they speed up data retrieval by reducing the amount of data SQL has to scan.

Utilizing SQL Joins for Data Integration

SQL joins are fundamental when it comes to data integration.

An inner join is used to return records with matching values in both tables. It’s helpful when users need only the common data between two tables.

Meanwhile, a left join retrieves all records from the left table and the matched ones from the right. It is useful when there are missing values in one table.

A right join, on the other hand, returns all records from the right table. This is less common but still valuable for specific data needs.

The full outer join includes records when there’s a match in either table. These joins enable complex queries, facilitating comprehensive data integration across diverse tables.

Mastering Subqueries and CTEs

Subqueries and Common Table Expressions (CTEs) provide advanced data retrieval options.

A subquery, or nested query, is a query inside another query. It’s used to perform operations like filtering and complex aggregations.

Subqueries can be used in SELECT, INSERT, UPDATE, or DELETE statements, offering flexibility in data retrieval.

CTEs, introduced by the WITH clause, improve readability and maintainability of complex queries. They allow the definition of temporary result sets which can be referenced within the main query.

This makes it easier to break down and understand parts of complex queries, facilitating data management and analysis.

Data Manipulation and Modification

Data manipulation and modification in SQL focus on managing and altering the data within tables. Key operations include inserting new rows, updating existing records, and deleting unwanted data. These actions ensure the database remains accurate and up-to-date.

Inserting Rows with Insert

The INSERT command is fundamental for adding new data into a table. It involves specifying the table where the new data will reside and providing values for each column.

For instance, to add a new student record, you might use:

INSERT INTO Students (Name, Age, Grade)
VALUES ('John Doe', 16, '10th');

This command places a new row with the specified values into the Students table.

Understanding how to insert rows is crucial for expanding your dataset effectively.

Be mindful of primary keys; these must be unique and defined when inserting to maintain data integrity.

Updating Records with Update

Updating records involves modifying existing data within a table. The UPDATE command allows for specific changes to be made, targeting only the necessary fields.

For example, adjusting a student’s grade would look like this:

UPDATE Students
SET Grade = '11th'
WHERE Name = 'John Doe';

It’s important to pair the UPDATE command with a WHERE clause. This ensures changes are made only to selected records, preventing accidental modifications to all rows.

This controlled approach helps maintain the reliability of data while reflecting real-time updates or corrections.

Deleting Records with Delete

The DELETE command removes data from tables and is used when data is no longer needed. This might happen when entries become outdated or unnecessary.

The basic syntax is:

DELETE FROM Students
WHERE Name = 'John Doe';

Like updates, deletions should use a WHERE clause to avoid removing more data than intended.

Deletion should be handled with care, as it permanently removes information from the database.

Regular use and understanding of this command help keep the database organized and efficient by getting rid of obsolete data.

Managing Data Aggregation

Data aggregation in SQL involves collecting and summarizing information from databases. Techniques like using aggregate functions, grouping, and filtering are crucial for analyzing large datasets and generating insightful summary reports.

Applying Aggregate Functions

Aggregate functions in SQL perform calculations on multiple rows and return a single value. Common functions include SUM, MIN, MAX, AVG, and COUNT.

These functions help identify trends and anomalies within datasets.

For example, using SUM can total sales figures, while COUNT can determine the number of customers.

Applying these functions is straightforward: just include them in the SELECT statement.

For instance, SELECT SUM(sales) FROM sales_data provides the total sales.

These functions are essential for generating comprehensive summary reports that highlight important dataset characteristics.

Grouping Data with Group By

The GROUP BY clause sorts data into groups based on column values, facilitating detailed analysis. By grouping data, SQL users can apply aggregate functions to each group, revealing deeper insights.

For instance, grouping sales data by region or product line allows analysts to evaluate performance in each category.

To use GROUP BY, specify the columns to group within the SELECT statement, like SELECT region, SUM(sales) FROM sales_data GROUP BY region.

This approach efficiently organizes data, enabling multi-level summaries that improve understanding of patterns and trends in datasets with varying characteristics.

Enhancing Summaries with Having

The HAVING clause filters grouped data based on specified conditions. It acts as a filter for aggregate function results, whereas WHERE filters individual rows.

HAVING is crucial for refining summary reports, ensuring only relevant groups are displayed.

To apply the HAVING clause, include it after GROUP BY to set conditions on grouped data.

For example, SELECT region, SUM(sales) FROM sales_data GROUP BY region HAVING SUM(sales) > 10000 shows only regions with sales over 10,000.

This selective approach enhances the quality of reports by focusing on significant data points without unnecessary details.

Implementing Advanced SQL Functions

Advanced SQL functions are crucial for extracting deeper insights from data. This section will explore two important sets of functions—window functions and text functions—to enhance analytical capabilities and maintain clean, formatted datasets.

Utilizing Window Functions for Advanced Analysis

Window functions are a powerful tool for carrying out complex calculations across SQL data sets. They allow users to perform operations like calculating moving averages and running totals without altering the original data set.

Using the OVER clause with PARTITION BY, they can define specific data groups on which functions like RANK() are applied. By segmenting data this way, analysts can understand trends and patterns over defined categories.

Examples of Common Window Functions:

  • Moving Averages: Helps smooth out data fluctuations for better trend analysis.
  • Running Totals: Accumulates a total over a range of rows in the data set.

These functions empower users to conduct precise and detailed analyses, essential for strategic data-driven decisions.

Applying Text Functions for Data Cleaning

Text functions in SQL are essential for maintaining clean and usable datasets. They aid in text manipulation, allowing analysts to standardize and format string data for consistency.

Key functions include UPPER() and LOWER(), which adjust the casing of text, and TRIM(), which removes unwanted spaces. These functions are crucial to ensure uniformity and readability in data analysis.

Important Text Functions:

  • CONCAT(): Combines strings for consolidated fields.
  • SUBSTRING(): Extracts specific portions of text for focused analysis.

By applying these functions, data analysts can effectively tidy up messy datasets, boosting accuracy and reliability in their work. This standardization process is vital for delivering consistent data insights.

Working with SQL for Analytics

A laptop displaying SQL queries, surrounded by data charts and graphs

SQL is a powerful tool for data analysis, enabling users to make data-driven decisions through comprehensive data manipulation.

When working with SQL for analytics, it is crucial to focus on generating detailed reports, calculating summary statistics, and constructing informative data visualizations.

Generating Data-Driven Reports

Creating SQL reports is an essential aspect of data analysis. Reports help identify patterns and provide insights. Analysts often use SELECT statements to gather specific data from large datasets.

Aggregation functions like COUNT, SUM, and AVG help in compiling meaningful data summaries.

By filtering and sorting, users can tailor reports to specific business needs, allowing decision-makers to evaluate performance metrics effectively.

Reports are a core component in understanding how a business functions, leading to informed data-driven decisions.

Calculating Summary Statistics

Summary statistics are vital in transforming raw data into useful information. SQL provides several functions to calculate statistics such as averages, medians, and variance.

Using functions like MIN, MAX, and AVG, professionals can assess data trends and variability.

GROUP BY ensures data is organized effectively, allowing detailed breakdowns for deeper analysis.

These statistics are foundational for interpreting data and are often crucial for identifying areas of improvement and optimizing operations.

Constructing Data Visualizations

Visualizing data with SQL aids in simplifying complex datasets. Analysts can export SQL data into visualization tools, enabling the creation of charts and graphs that are easy to understand.

For instance, integrating SQL databases with tools like Tableau and Power BI enhances the ability to spot trends and anomalies.

Visual representation is important for communicating results to stakeholders clearly, ensuring that insights lead to strategic actions.

Learning SQL through Practical Exercises

A person using a computer to practice writing SQL queries for data analysis

Practical exercises are key to mastering SQL. Engaging with interactive tutorials and tackling hands-on challenges help build and refine SQL skills effectively. These methods offer real-world applications and make learning both engaging and productive.

Interactive SQL Tutorials and Courses

Interactive tutorials provide a structured way to learn SQL. They often include step-by-step guides and real-time feedback, which helps to reinforce learning.

Platforms like Dataquest offer comprehensive SQL tutorials with exercises built into the courses. A good tutorial should cover the basics, including SQL queries, joins, and data manipulation.

Many online courses also provide a free trial, allowing learners to explore the content before committing.

These courses often come with interactive coding environments. This setup allows learners to write and test SQL queries within the course itself, enhancing their learning experience.

Hands-On SQL Exercises and Challenges

Hands-on exercises are vital for deeply grasping SQL concepts. Websites like LearnSQL.com offer beginner-friendly SQL practice exercises, which are perfect for those new to data analysis.

These exercises focus on real-world scenarios and help learners gain practical experience.

Challenges can range from basic queries to more complex problems involving multiple tables and joins. Working through these challenges helps learners understand how SQL can solve real-world data analysis tasks.

A mix of easy and challenging exercises ensures a comprehensive learning path suitable for various skill levels.

Optimizing SQL Query Performance

A person studying SQL with a laptop and notebook, surrounded by data analysis books and resources

Optimizing SQL query performance is crucial to handle large datasets efficiently. By focusing on indexing strategies and query optimization techniques, users can significantly improve the speed and performance of their SQL queries.

Effective Indexing Strategies

Indexing is a fundamental part of enhancing performance in SQL databases. It allows faster retrieval of rows from a table by creating a data structure that makes queries more efficient.

For beginners, understanding which columns to index is important. Key columns often used in WHERE clauses or as JOIN keys are good candidates for indexing.

Avoid over-indexing as it can slow down INSERT, UPDATE, and DELETE operations. A balance is needed to improve query performance without compromising data modification speed.

Clustered indexes sort and store data rows of the table in order, allowing faster access to data. On the other hand, non-clustered indexes create more flexible paths by keeping a separate structure from the data rows themselves.

For a practical SQL tutorial on indexing, users can explore SQLPad’s detailed guides to understand these strategies better.

Query Optimization Techniques

Optimizing SQL queries is about crafting precise and efficient commands to improve performance.

Using specific column names instead of the asterisk (*) in SELECT statements reduces the amount of data load.

It is also beneficial to filter records early using the WHERE clause to limit the data processed.

Joining tables with explicit conditions helps in reducing unnecessary computation. Opting for JOIN instead of subqueries can also enhance performance because SQL engines typically execute joins more efficiently.

Understanding how to leverage database query optimization techniques can further aid in maintaining efficient data retrieval times and manage to scale effectively with growing datasets.

Understanding SQL Database Systems

A person at a desk, computer screen with SQL database interface, notebook, and pen

SQL database systems are crucial for managing and analyzing data efficiently. Each system offers unique features and capabilities. PostgreSQL, SQL Server, and SQLite are popular choices, each providing specific advantages for data handling and manipulation tasks.

Exploring PostgreSQL Features

PostgreSQL is an open-source database system known for its robustness and versatility. It includes advanced features like support for complex queries and extensive indexing options.

Users can rely on its ability to handle large volumes of data with high accuracy.

PostgreSQL also supports various data types, including JSON, which is useful for web applications. Its community-driven development ensures continuous improvements and security updates.

Postgres is favored in scenarios where data integrity and extensibility are priorities. For beginners, exploring its features can provide a strong foundation in database management.

Leveraging SQL Server Capabilities

SQL Server, developed by Microsoft, is renowned for its integration with other Microsoft products. It offers a wide range of tools for data management and business intelligence.

Its robust security features make it suitable for enterprises that require stringent data protection.

Enhancements like SQL Server Management Studio facilitate easier database management. SQL Server is optimized for high availability and disaster recovery, ensuring that data is consistently accessible.

For beginners, leveraging the capabilities of SQL Server can enhance their skills, particularly in environments that already utilize Microsoft technologies.

Working with SQLite Databases

SQLite is a lightweight database system often embedded in applications and devices. It requires minimal setup, making it a great choice for projects with limited resources.

Unlike other database systems, SQLite stores data in a single file, simplifying backup and distribution.

It supports most SQL syntax and is useful for situations where a full-scale database server is unnecessary.

SQLite offers portability across platforms and is often used in mobile apps and browsers. Beginners can benefit from its simplicity, making it an excellent starting point for learning SQL and database concepts.

Building Relationships with SQL Joins

Multiple tables connected by lines, each labeled with SQL keywords. One table has customer data, another has product data, and a third has sales data

SQL joins are essential for combining data from multiple tables. They enable users to merge and analyze complex datasets effectively. The following sections discuss how different types of joins work.

Inner Joins for Table Merging

Inner joins are a powerful tool for merging tables based on a common column. They retrieve rows with matching values in both tables, providing a way to explore connected data points.

For example, if a student table and a course table share an ID, an inner join helps find which students are enrolled in specific courses.

To execute an inner join, use the INNER JOIN keyword in an SQL query. It ensures that only the rows with overlapping values in both tables appear in the result set.

This type of join is widely used in data analysis and can handle large datasets efficiently. Inner joins are particularly helpful when clear relationships need to be established between datasets.

Outer Joins and Complex Data Relationships

Outer joins, including left and right joins, are used when data from one or both tables need to be retained even if there is no match.

A left join keeps all records from the left table and matching records from the right one. A right join does the opposite.

These joins are vital for analyzing more complicated data sets, where incomplete information could be important.

Consider using a left join or right join when some records should appear in the results regardless of having matches in the related table. They are particularly useful in scenarios where data availability varies across tables. Outer joins allow users to preserve context and ensure critical insights are not lost when working with large datasets.

SQL for Data Analysts

A person using a laptop to study SQL, with a notebook and pen nearby

SQL is crucial for data analysts because it allows them to effectively retrieve and manipulate data. By mastering SQL, analysts can efficiently clean, sort, and transform data into actionable insights.

The Role of SQL in Data Analysis Professions

In data analysis professions, SQL plays a vital role in handling large datasets. Analysts often use SQL to sort, filter, and compute data. This is crucial for companies that rely on data-driven decision-making.

SQL skills allow analysts to extract insights from databases, making their work more efficient and precise.

SQL’s ability to handle structured data sets is essential for businesses that deal with complex data relationships. This makes SQL a valuable tool for any data-driven role, including business intelligence and data science.

SQL Skills Essential for Data Analysts

Data analysts need a solid foundation in key SQL skills to succeed.

Understanding SQL basics such as SELECT statements, JOIN operations, and WHERE clauses is crucial. These allow analysts to efficiently query databases and extract necessary information.

Advanced SQL skills, like writing complex queries and using aggregate functions, enable analysts to perform deeper data analysis.

Consistent SQL practice, such as through a structured SQL tutorial, helps build these skills.

Developing proficiency in SQL makes data manipulation and analysis efficient and precise, which are vital for success in data analysis roles.

Frequently Asked Questions

A person studying a book titled "Frequently Asked Questions Learning Beginner SQL skills for Data Analysis" at a desk with a laptop and notes

Learning SQL for data analysis can be approached from several angles. Beginners might wonder about the resources available, the necessity of programming experience, the focus areas within SQL, effective practice methods, and the necessity of proficiency in SQL.

What are the best resources for a beginner to learn SQL for data analysis?

Beginners have many options to start learning SQL. Platforms like Coursera and Dataquest offer comprehensive tutorials and courses focused on data analysis. Books and online tutorials can also provide step-by-step guidance.

Can one learn SQL without any prior experience in programming for data analysis purposes?

Yes, SQL is often considered user-friendly for newcomers. It is a query language rather than a full programming language, making it accessible even without prior coding experience. Many introductory courses focus on building skills from the ground up.

What variations of SQL should a data analyst focus on to enhance their skill set?

Data analysts should become familiar with SQL variations like MySQL, PostgreSQL, and Microsoft’s SQL Server. This knowledge will provide versatility when working with different databases. Specialized functions and extensions in these variations can also help tackle diverse data challenges.

How can a beginner practice SQL skills effectively when aiming to use them in data analysis?

Effective ways to practice SQL include completing projects on platforms like LearnSQL.com and participating in online coding challenges. Working with real or simulated datasets helps reinforce SQL concepts and hones analytical skills.

Is it necessary for a data analyst to have proficiency in SQL?

Proficiency in SQL is crucial for data analysts. It allows them to extract, filter, and manipulate data stored in databases easily.

SQL skills enable analysts to access data essential for generating insights and making data-driven decisions.

Where can I find SQL data analysis courses that offer certification upon completion?

Courses offering certification can be found on platforms like Coursera and DataCamp.

These platforms provide structured learning paths with recognized certificates upon completion, which can boost a learner’s credentials.

Categories
Uncategorized

Learn How to Determine The Goal Of The Database: Expert Tips and Strategies

Understanding Database Design Goals

Clear database design goals are crucial for creating efficient systems. They help in guiding the design process, ensuring alignment with business needs, and optimizing both logical and physical designs for performance and scalability.

Defining Database Objectives

Defining objectives involves determining what the database needs to accomplish. This includes identifying the types of data that will be stored and how this data will be accessed. Goals like improving retrieval speed or ensuring data accuracy can guide this process.

These objectives are critical in good database design, as they influence the choice of data models and the overall architecture.

Creating a list of objectives aids in aligning the database with overall business strategies. It is also important to involve stakeholders to ensure that the database meets user demands and supports enterprise data management systems efficiently.

Understanding the scope and limitations from the start helps in avoiding costly redesigns later.

Importance of Data Requirements Analysis

Data requirements analysis is an essential step in good database design. It ensures that all necessary data is collected systematically to support the database’s objectives.

This analysis involves detailed study of how the data will be used, stored, and retrieved.

It is crucial for planning both logical and physical designs, ensuring that the database can handle current and future needs.

By analyzing data requirements meticulously, designers can prevent data redundancy and improve data integrity and security. This process often includes interviews with users to gather real-world insights, aligning the database design with practical demands.

Fundamentals of Data Modeling

Data modeling is a crucial skill in database design, focusing on how data is structured and interrelated. This process often involves creating visual representations to simplify complex data arrangements. Understanding these aspects can improve data organization and enhance the overall functionality of a database.

Exploring Entity-Relationship Diagrams

Entity-Relationship Diagrams (ERDs) are visual tools used in data modeling to represent entities and their relationships within a database. They simplify complex data structures by showing how data entities like customers or products are connected.

In ERDs, entities are typically depicted as rectangles, while relationships are shown as diamonds or lines connecting entities.

These diagrams help developers and analysts understand data flow and identify linkages between different data elements. ERDs utilize cardinality to indicate the numerical relationship between entities, such as one-to-one, one-to-many, or many-to-many associations.

By providing a clear blueprint of the database structure, ERDs aid in accurate database design and implementation.

Attributes and Data Types

Attributes in data modeling define the properties of an entity. For instance, a “Customer” entity may have attributes like “Name,” “Email,” and “Phone Number.” Each attribute is assigned a specific data type, which dictates the kind of data it can hold. Common data types include integers, strings, and dates.

Selecting the appropriate data type is critical as it affects data integrity and storage efficiency. For example, using an integer data type for a phone number could lead to errors, as phone numbers often require a string type for proper formatting.

By correctly defining attributes and data types, developers ensure that the database accurately reflects real-world scenarios and maintains high data quality.

Effective Database Structures

Creating effective database structures is crucial for data management and performance. Key factors include understanding data relationships and applying normalization principles.

Identifying Key Data Relationships

Identifying data relationships is foundational in database design. Understanding how data entities relate to each other helps in determining the optimal structure for a relational database. Relationships can be one-to-one, one-to-many, or many-to-many.

In a one-to-many relationship, a single record in one table is linked to multiple records in another table, which enhances organization and efficiency. Many-to-many relationships require an associative table to map connections effectively.

Clarifying these relationships ensures efficient data retrieval and integrity. It also reduces redundancy, enhancing the database’s overall efficiency and performance.

Clear relationship mapping is central to robust and scalable database structures.

Integration of Normalization Practices

Normalization is crucial in crafting an efficient database design. It involves organizing data to reduce redundancy and improve data integrity. This process breaks down tables into smaller, more manageable pieces, ensuring data is stored logically and consistently.

Normalization typically includes several standard forms, with each focusing on different aspects of data organization. For instance, the first normal form eliminates duplicate columns, while the second normal form ensures all columns depend on the primary key.

Applied correctly, normalization leads to more efficient data storage and retrieval. It also aids in maintaining data consistency and cost-effectiveness, resulting in a streamlined database system that is easier to manage and scale.

Design Process and Logical Planning

A well-structured database design involves clear strategies and a detailed development process. Effective database design ensures efficiency, consistency, and integrity.

Conceptual Design Strategies

In the initial stage, the focus is on understanding the data requirements. Designers identify the data that needs to be stored. This involves defining the types of data, such as customer details or transaction records. Concepts like entities, attributes, and relationships are crucial.

Entities represent real-world objects or concepts. Attributes describe the properties of these entities. Relationships define how entities interact with each other.

A good conceptual design helps in creating a blueprint that systematically prepares for the logical design phase. Using diagrams and models, designers can visualize the database structure.

Logical Design Development

Logical design translates conceptual models into a technical framework. This phase focuses on how the database will be structured technically. The process involves creating a logical data model, which includes defining tables, columns, data types, and relationships.

Normalization is a key part of the logical design, ensuring data redundancy is minimized.

The aim is to develop a logical model with efficiency in mind. Relationships between tables are clearly outlined, supporting data integrity and retrieval efficiency.

This stage sets the foundation for the physical implementation, ensuring that the database is both practical and functional.

Physical Database Design Considerations

Physical database design plays a critical role in balancing performance and cost-efficiency. Key factors include selecting appropriate hardware and software, alongside strategies for partitioning and storage.

Choosing Hardware and Software Systems

Selecting the right hardware resources is essential for optimal database performance. These include processors, memory, and storage devices. Ensuring that the database server has sufficient CPU power and memory helps process data efficiently. High-performance disk storage space like SSDs can significantly reduce data retrieval times.

Software systems are equally important. The choice of database management systems (DBMS) affects how the physical database design is implemented. Some DBMS options offer more flexibility with indexing and data retrieval strategies.

It’s crucial to match the hardware capabilities with the software features to maximize efficiency.

Regular updates and performance tuning of both hardware and software ensure that the system remains capable of handling growing data volumes. This balance can prevent future bottlenecks and reduce long-term costs.

Partitioning and Storage Solutions

Partitioning divides the database into smaller, more manageable pieces. This process can improve query performance and facilitate easier backups and management. Horizontal partitioning, which involves distributing data rows across partitions, often speeds up access times.

For storage solutions, choosing between RAID configurations can influence data redundancy and speed. RAID 0 offers improved speed through striping, while RAID 1 provides redundancy with mirroring.

Selecting the appropriate configuration depends on the balance between performance and data safety requirements.

Efficient storage management also involves monitoring and optimizing disk space. Implementation of data compression and deletion of unnecessary data can free up valuable resources and maintain system efficiency. Regular evaluation of storage practices ensures scalable database environments.

Ensuring Data Integrity and Consistency

A computer screen displaying a database schema with interconnected tables and data fields, accompanied by a flowchart outlining the process of determining the database's goal

Data integrity and consistency are key elements in maintaining reliable databases. Ensuring these aspects involves implementing rules and relationships that keep data accurate and dependable. Specific methods include setting up constraints and managing dependencies, alongside reinforcing referential integrity.

Constraints and Dependencies

Constraints play a crucial role in maintaining data integrity by setting specific rules on data entries in a database. Common constraints include primary keys, which ensure each entry is unique, and unique constraints, which prevent duplicate values.

Dependencies define relationships between data elements, often using keys like primary keys, foreign keys, and dependency chains. These elements help maintain data consistency by ensuring changes in related data elements do not lead to inconsistencies or errors.

Well-implemented constraints and dependencies ensure no invalid data disrupts database operations. They act as safety nets, preventing users from entering data outside predefined limits, thus safeguarding data reliability over time.

A well-managed data governance framework can help manage these constraints effectively.

Referential Integrity

Referential integrity is essential for managing relationships between tables in a database. It ensures that references between data, such as foreign keys, remain valid. For instance, if an entry on one table links to another table, both entries must be correct and meaningful.

This relationship is often maintained using foreign keys, which link tables by referencing specific entries in other tables.

Enforcing referential integrity avoids accidental data loss or corruption, maintaining data integrity throughout database operations. Databases like SQL systems provide mechanisms to enforce these rules automatically.

Ensuring that every table connection remains accurate reduces errors and enhances the usability of reports and queries, leading to more robust data management.

SQL and Data Manipulation Techniques

A person analyzing a database schema with SQL queries and data manipulation techniques

SQL plays a crucial role in data retrieval and processing. Effective data manipulation in SQL involves techniques like indexing for speedy data access and using SQL commands to handle data operations efficiently.

Database Indexing for Efficient Retrieval

Database indexing improves the speed of data retrieval. By creating indexes, a database can quickly locate and access data without scanning each row. Indexes are like a table of contents in a book, pointing to where information is stored.

There are different types of indexes, like B-trees, which are commonly used. Indexes are especially useful when querying large datasets. They reduce the search area, making SELECT queries run faster. However, they need to be kept up-to-date, which may involve some extra storage space and maintenance effort.

Using indexing carefully ensures that the balance between performance and storage is maintained.

SQL Commands and Data Processing

SQL commands are essential for data processing in any relational database. The most common data manipulation commands are SELECT, INSERT, UPDATE, and DELETE. These involve accessing and modifying data stored in tables.

The SELECT command is crucial for data retrieval. It allows users to specify which columns to view and provides filtering options like WHERE clauses. INSERT adds new data, UPDATE modifies existing data, and DELETE removes data from tables.

Mastering these commands is vital for any database professional. They enable effective data analysis and ensure that the data remains accurate and organized.

Proper use of these commands helps in maintaining data integrity and consistency within the database.

Database Management and Security

Database management systems (DBMS) play a crucial role in organizing, storing, and retrieving data efficiently. Security measures are essential to protect sensitive information and ensure the reliability of database systems.

Roles of DBMS in Data Management

DBMS are designed to handle large amounts of data and provide multiple users access without compromising integrity. They ensure that data is consistently organized, making it easier to retrieve, update, and manage.

Key functions include maintaining the structure of databases, allowing queries for specific data, and facilitating backups.

DBMS also support data integrity by enforcing rules that prevent erroneous data entry. The ability to manage transactions effectively ensures that all operations are completed successfully, or the data system returns to its original state in case of errors. This maintains the accuracy and consistency of information within the database.

Implementing Security Measures

Ensuring database security involves protecting the data and the system it resides on. This includes implementing strong access controls, such as authentication and authorization, to ensure only qualified users can access sensitive data.

Encryption is vital for data both at rest and in transit, adding a layer of protection against unauthorized access.

Regular audits and monitoring are necessary to detect any suspicious activity quickly. Backup and recovery plans are also part of a robust security strategy, ensuring that data can be restored in the event of a breach or failure.

These measures safeguard databases against potential threats, ensuring data confidentiality, availability, and integrity are maintained. For more information on database security best practices, Microsoft Azure provides detailed insights at database security best practices and solutions.

Scalability and Performance Optimization

Optimizing a database involves making it scalable and improving query performance. Scalability ensures that the database can handle increased loads.

Query performance tuning helps in speeding up data retrieval, which is essential for efficient database management.

Scaling Databases for Load

Scalability refers to the ability of a database to grow with increasing demands. To achieve this, one strategy involves adding more hardware resources, known as vertical scaling.

Another approach is horizontal scaling, where additional database instances are created to distribute the load.

Choosing between these options depends on the application’s needs and budget. Techniques like database normalization also play a role. They reduce redundancy and anomalies, making it easier for the database to scale efficiently.

Monitoring tools help identify bottlenecks, ensuring the database adjusts dynamically to user demands without compromising performance.

Query Performance Tuning

Improving query performance is critical for database efficiency. Slow queries can become bottlenecks, affecting overall application speed.

Performance tuning starts with analyzing query execution plans to identify inefficient operations. Indexing can significantly enhance performance by reducing data retrieval time.

Regularly reviewing and updating indexes is important to keep queries efficient. Cleaning up unused indexes and optimizing existing ones aids in performance.

Additionally, understanding the physical data design model is vital. It influences how data is accessed and stored, which can impact query speed.

Optimized schema design ensures faster and more efficient data retrieval processes.

Data Redundancy and Duplication

Data redundancy and duplication can lead to errors, slowed performance, and increased storage costs. Balancing database design to eliminate these issues ensures efficient data management and retrieval.

Avoiding Redundancy in Design

Reducing redundancy is crucial in database design. When the same piece of information is stored multiple times, it takes up extra space and can result in inconsistencies.

One way to avoid this is through database normalization. This process involves organizing data into tables and defining relationships to ensure that each piece of data is unique.

Normal forms are stages of normalization that help in structuring a database. For example, First Normal Form (1NF) ensures that all columns contain atomic values. As normalization progresses, additional rules are implemented in Second Normal Form (2NF) and Third Normal Form (3NF), each of which further reduces redundancy.

Appropriate indexing and careful schema design also contribute to minimizing redundancy.

Dealing with Data Duplication

Data duplication occurs when identical data appears in different areas of the database. This can complicate data processing and analysis.

Deduplication techniques help in managing this issue by identifying and removing exact copies. Automated tools can be used to scan databases and highlight duplicate entries.

Additionally, data normalization can help in reducing duplication. By ensuring that the same data is not unnecessarily replicated across tables, normalization keeps data management efficient.

Regular audits of the database can also catch and fix duplication issues. These practices contribute to maintaining the integrity and accuracy of the database.

Testing and Validation Practices

A person analyzing data on a computer, with various charts and graphs displayed on the screen, while referencing a database schema diagram

Testing and validation practices in databases ensure data integrity and accurate results. Key aspects include ongoing testing throughout the development cycle and meticulous checks for data accuracy.

Development Lifecycle Testing

During the database development lifecycle, testing begins at the design phase and continues through deployment. This ongoing process involves unit testing, integration testing, and regression testing.

Unit testing focuses on database objects like procedures and functions. Each code segment is tested individually before being integrated into the main build. This ensures that each part functions correctly on its own.

Integration testing checks if these parts work together as expected. It verifies that data flows smoothly between different database components without errors or data loss.

Regression testing helps ensure that updates or changes do not adversely affect existing functionality. It is crucial to conduct these tests regularly to catch any issues early.

By maintaining a testing schedule that aligns with the development timeline, potential problems can be identified and rectified, ensuring a robust and reliable database system.

Validation for Data Accuracy

Validation for data accuracy focuses on ensuring that the data within the database is correct and consistent. This involves several strategies:

Data integrity checks confirm that data is not duplicated, corrupted, or incorrectly formatted. These checks help maintain the quality of data stored in tables.

Cross-referencing data sources is another technique. By comparing data entries with source documents or systems, inaccuracies can be identified and corrected.

Data validation rules are implemented to enforce specific standards. These rules prevent invalid data entry by checking data types, formats, and ranges at the time of input.

Such precautions ensure that the database only contains accurate and reliable information, crucial for decision-making processes and compliance with standards.

Considering Alternative Databases

A person researching different types of databases, surrounded by books, computers, and various data storage devices

Exploring alternative databases requires identifying specific database types that support various data needs. The focus will be on NoSQL databases and their typical use cases, as well as business intelligence and analytic databases, which are tailored for data analysis and insights.

NoSQL Databases and Their Use Cases

NoSQL databases are designed to handle varied data types and offer flexible schema configurations. They are particularly effective for applications with big data and real-time web applications.

These databases, such as MongoDB and Cassandra, support semi-structured or unstructured data, making them ideal for managing social media, logs, and other complex data elements.

Unlike relational databases, NoSQL databases can horizontally scale across multiple servers, providing robust performance for handling vast amounts of data.

Many startups and tech companies leverage NoSQL databases to rapidly adapt to changing data requirements. Using a NoSQL approach can be beneficial when the application requires speed, scalability, and the ability to handle different data formats. This flexibility makes NoSQL databases a powerful component in building modern applications.

Business Intelligence and Analytic Databases

Business intelligence and analytic databases are tailored for extracting and analyzing data to deliver actionable insights. These databases, like Snowflake and Amazon Redshift, are optimized for complex queries and report generation.

They support business intelligence tools by providing efficient access to large datasets, allowing organizations to process and visualize data effectively.

Key features include data warehousing capabilities and support for ETL processes, which transform raw data into an analyzed format.

Such databases are essential for companies focused on data-driven decision-making. They enable users to derive patterns, trends, and forecasts, which are crucial for strategic planning.

By choosing the right analytic database, businesses can enhance their data analysis capabilities, offering detailed insights for various operational needs.

Frequently Asked Questions

A person at a desk, surrounded by books and computer screens, studying and analyzing data to determine the goal of a database

Determining the goals of a database involves understanding its design process and objectives. This section addresses essential steps, best practices, tools, and principles that contribute to successful database design.

What are the essential steps involved in the database design process?

Designing a database starts with gathering requirements to understand user needs. This is followed by creating a conceptual model that outlines the data and relationships.

The logical model comes next, detailing data structures. Finally, the physical design is implemented in a database system.

Can you outline the primary objectives of implementing a database system?

The main objectives of a database system include ensuring efficient data storage, retrieval, and management. It aims to maintain data integrity and security while supporting multiple user access.

The system also helps in organizing data to facilitate easy updates and robust reporting features.

What are the recognized best practices in database design to ensure optimal performance?

Best practices include normalizing data to reduce redundancy, indexing to speed up retrieval times, and maintaining clear relationships between tables.

Regular backups and the use of constraints to ensure data accuracy are also crucial. Using these practices ensures a well-performing database.

Which tools and resources are recommended for facilitating the online database design?

Tools like MySQL Workbench, dbdiagram.io, and Lucidchart are often used for online database design. These platforms provide intuitive interfaces for creating and managing databases effectively.

They support various database systems, making them versatile choices for designers.

How do principles of database design contribute to achieving a database’s goals?

Database design principles ensure organized data storage, which enhances accessibility and reliability. By following these principles, databases maintain data consistency and integrity.

This approach allows for efficient scaling, more accurate data analysis, and improved user experience.

What distinguishes a well-designed database from a poorly designed one?

A well-designed database is characterized by its ability to handle large volumes of data efficiently and accommodate future growth. It minimizes redundancy and ensures accuracy and consistency.

In contrast, a poorly designed database may suffer from slow performance, lack of scalability, and data integrity issues.

Categories
Uncategorized

Learning DAX – Quick Measures: A Guide to Streamlining Calculations

Data Analysis Expressions (DAX) play a vital role in managing data for business intelligence and analytics.

It is a powerful tool used to create measures and calculations in Power BI, enabling users to generate insights efficiently.

Understanding how to use DAX, particularly through quick measures, can significantly enhance data analysis capabilities.

A person using a computer to learn DAX, surrounded by books and notes

Quick measures offer a simplified approach to creating DAX formulas, making it easier for users to perform complex data analysis without deep technical expertise.

This approach allows individuals to leverage templates for commonly used measures, which can save time and improve accuracy.

The ability to implement and utilize quick measures effectively can transform data analysis processes and outcomes.

1) SUMX Calculation

The SUMX function in DAX is a powerful tool for performing calculations on a table before summing up. It evaluates an expression for each row in a table and returns the sum of those expressions.

This makes it ideal for scenarios where there is a need to apply dynamic calculations to each row individually.

Unlike the simple SUM function, SUMX allows for more complex calculations. It is particularly useful when calculations are not simply additive.

For instance, users can calculate the total sales by multiplying two columns, such as price and quantity, for each row in a sales table.

When using SUMX, the function takes in two main arguments: the table and an expression that defines the calculation. The table can be a direct table reference or a filtered table.

The expression is evaluated for each row within the specified table. Check out Microsoft’s SUMX function guide for more details.

Filtering conditions can be applied within the SUMX function using DAX functions like FILTER. This flexibility allows for precise data analysis, such as calculating sales for only specific product categories.

Choosing between using SUMX with FILTER or other methods like CALCULATE with SUM can depend on the specific requirements of the dataset. More guidance on this can be found in discussions about best practices for SUMX.

By combining SUMX with other DAX functions, users can perform intricate calculations across datasets in Power BI. This makes it a versatile choice for data professionals seeking to enhance their data models.

2) AVERAGEX Function

The AVERAGEX function in DAX is a powerful tool for analyzing data. It helps compute the average of a set of numbers in a table by considering an expression for each row.

This function is similar to the AVERAGE function, but AVERAGEX is used when you need to consider calculations row by row.

For example, if a table holds sales data, AVERAGEX can average the profit margin by performing the calculation for each item sold. It takes two arguments: a table and an expression.

The table specifies the data to work with, and the expression determines the calculation for each row.

Additionally, AVERAGEX is helpful in contexts where filtering is necessary. Filters applied to tables can change the data considered by the function.

This feature makes it suitable for dynamic reports in Power BI.

The expression part of AVERAGEX can include other DAX functions, allowing for complex calculations. This versatility makes it a preferred choice for users who need in-depth insights into their data.

Another advantage is that AVERAGEX works well with quick measures in Power BI, making it accessible for those less familiar with writing DAX code.

It is important to ensure that AVERAGEX is used correctly. Misuse can lead to unexpected results, especially if the data has inconsistent row structures or missing values. Hence, understanding its application thoroughly is essential.

3) Ranking with RANKX

RANKX is a powerful DAX function used to add ranking to data based on specific criteria. It helps users arrange data in order and see relative rankings. Often used in Power BI, RANKX evaluates and ranks data within a selected column or table.

To use RANKX effectively, it’s crucial to understand its syntax. The basic syntax includes the function name and parameters like table, expression, and order.

By inputting these details, RANKX can rank data based on given measures.

For a practical example, ranking sales data per product can be achieved with RANKX. By applying the function to the sales column, users can see which products are best sellers.

This data-driven approach helps in making informed business decisions.

In some cases, RANKX may show the same rank for different entries. This happens when values are tied. Adjusting the function to handle ties can provide more specific insights.

Learning the nuances of this function can greatly enhance data analysis skills.

It’s worth noting that RANKX has proven useful in various scenarios. For detailed guidance, exploring specific use cases can be beneficial.

Resources like the guide on using RANKX with calculated measures can offer deeper insights.

Additionally, understanding the importance of accurate measures is highlighted in articles on protecting code with RANKX.

4) Time Intelligence Date Filtering

Time intelligence date filtering is a powerful feature in Data Analysis Expressions (DAX) used to analyze and manipulate data over specific time periods. It allows users to perform calculations constrained by defined time periods like days, months, quarters, or years.

Users can create dynamic reports to compare these periods effectively.

When using time intelligence functions, it’s crucial to mark one of the tables containing a date column as a Date Table. This ensures the date calculations are accurate and consistent.

Tools like Power BI and Excel utilize these functions to help users filter data based on dates easily.

Several vital functions in DAX facilitate time intelligence by providing straightforward ways to calculate over different periods.

Functions like SAMEPERIODLASTYEAR, PREVIOUSMONTH, and PARALLELPERIOD are commonly used. These functions allow comparisons with similar periods in prior years, months, or other intervals.

Moreover, quick measures in Power BI offer pre-defined calculations to simplify time-based analysis.

Users can calculate year-to-date, quarter-to-date, and month-to-date totals without deep DAX knowledge. This is particularly helpful for those less familiar with the intricacies of DAX syntax.

For those working with external tabular models in Power BI, ensuring the primary date column is correctly marked as a date table is essential.

This step is necessary to take full advantage of time intelligence quick measures within the software. More details on using custom date tables can be found through resources like Microsoft Learn’s guide on quick measures.

A thorough understanding of time intelligence functions and their implementation can significantly enhance data analysis capabilities. This makes it an essential skill for anyone working with large datasets over various time periods.

5) Dynamic Cumulative Total

A dynamic cumulative total, also known as a running total or cumulative sum, is a calculation frequently used in data analysis to track the sum of values over a period. It provides insights into trends over time.

Dynamic cumulative totals are often used in Power BI. They allow users to see the changing sum of data points as new data is added. This feature is especially helpful in financial reports and inventory tracking.

In Power BI, dynamic cumulative totals can be created using DAX functions. This involves calculating current values plus all previous ones. Such a total is adaptable, changing as the data context or filter changes.

To create a dynamic cumulative total, DAX functions like CALCULATE and FILTER can be utilized. These functions adapt the cumulative total to new data as it appears in the report, providing real-time updates.

Using a built-in feature in Power BI called Quick Measure, users can create running totals without complex formulas. Quick Measure generates the necessary DAX code automatically.

Understanding how to apply these components can significantly enhance data exploration and reporting. As users manipulate data ranges or filters, the cumulative total reflects those changes instantly.

6) Year-Over-Year Growth

Year-over-year (YoY) growth is a key metric in data analysis and reporting. It helps businesses understand how their performance has changed over different periods. By comparing results from one year to the next, companies can spot trends and make informed decisions.

In Power BI, calculating YoY growth involves using DAX formulas. DAX, short for Data Analysis Expressions, is a powerful language used to perform calculations and data analysis.

One common approach is to use a DAX formula to calculate the percentage change between two time periods.

For example, to find YoY growth of sales, a formula calculates the difference between the current year and the previous year sales.

This involves subtracting last year’s sales from the current year’s sales, then dividing by last year’s sales, and multiplying by 100 to get a percentage. Power BI offers features to simplify this process.

The use of quick measures in Power BI can be especially helpful for those who don’t want to write DAX code manually. Quick measures provide pre-made templates of common calculations.

Users can apply these without needing deep knowledge of DAX.

For more tailored or complex business scenarios, writing a custom DAX formula might be necessary.

For instance, in specific cases, like the comparison of a unique calendar week, developers might create custom year-over-year calculations using DAX expressions.

Learning how to calculate YoY growth using tools like Power BI enhances decision-making by providing clear insights into business trends over time. Understanding these processes is valuable for anyone looking to gain deeper business insights through data analysis.

7) Rolling Average Measures

Rolling average measures are a handy tool in data analysis. They help smooth out fluctuations and highlight trends over a specific period.

By averaging data over time, analysts can better understand key movements without the noise of daily variations.

To create rolling average measures in Power BI, start by ensuring you have a comprehensive date table. This is crucial because the rolling average needs a continuous timeline to function correctly.

With the date table in place, use DAX formulas to define the rolling average period, like 7 days or 30 days.

Quick measures in Power BI simplify this process. They provide pre-made templates, which automatically generate the DAX formula needed for the rolling average.

By using these, you can save time and reduce errors.

For instance, selecting “-6” or “-7” will determine whether your rolling average spans 7 days when setting it up in the panel. This ensures the average includes the current day or spans completely past days, depending on the selection.

Utilizing rolling averages can enhance reports, particularly in visualizations. They allow for smoother trends and make it easier to spot overall patterns in the data over time.

You can see examples of their application in Power Tech Tips, which explains how rolling averages are calculated in Power BI.

For those new to these concepts, rolling averages present a straightforward way to start exploring more advanced data analysis techniques. They offer an entry point into more complex measures, allowing users to gradually build their skills and understanding of data trends.

8) Custom Format Strings

Custom format strings in Power BI let users change how fields appear in visuals, ensuring reports look precise. They work by applying a specific format to numbers, dates, or text, making information easier to understand.

This feature is vital in creating reports that are not only functional but also visually appealing.

Within Power BI, users can set these formats at different levels. The model level is one option where users can define a format string for fields. This provides consistency across all visuals using that field.

For a more flexible approach, dynamic format strings offer the ability to adjust based on the data context, enhancing the overall presentation.

In Power BI Desktop, adding a custom format is straightforward. Users can navigate to the Measure tools ribbon and explore the Format dropdown to find various options.

Selecting the right format can present data clearly, highlighting key metrics effectively.

Dynamic format strings are particularly useful as they allow for more responsive displays. This means that the format can change according to the values or other conditions set in the report.

This helps in emphasizing specific data points and can improve the way the content communicates insights.

Immersing oneself in options like these not only saves time when building reports but also ensures that reports are more intuitive for users.

For users seeking more information, exploring resources such as the deep dive into dynamic format strings can offer further insights into optimizing data presentations.

9) Top N Filter Measure

A Top N filter measure is a way to show only the top entries from a data set based on specific criteria. It helps in analyzing top performers, such as best-selling products or high-revenue customers.

This feature is valuable in focusing on significant contributors to business results.

In DAX, the TOPN function is often used to create this measure. This function selects a defined number of top items from a table according to an expression or criteria.

By applying it to a measure, users can filter data visuals to highlight top performers effectively.

For example, users might apply a Top 5 filter on sales data to show only the five customers with the highest sales volume. This approach simplifies complex data sets, allowing users to concentrate on key data points and uncover valuable insights.

When implementing a Top N filter, it’s important to determine the specific ranking criteria. Usually, this involves calculating a measure like total sales or quantity, over which the top entries will be ranked.

Once determined, adjustments may be needed to fine-tune the filter according to particular analysis requirements.

Using Top N filters can enhance reports and dashboards by focusing on the most relevant information. This enables better decision-making by providing clear insights into which items or performers are leading in specific metrics.

For further details on implementing these filters, consider examining examples and methodologies shared in community discussions, such as those found on the Microsoft Fabric Community.

10) Dynamic Segmentation Techniques

Dynamic segmentation in DAX is an advanced method used to classify data based on specific metrics. This technique helps in categorizing entities like customers based on data such as purchase volume or transaction frequency.

Dynamic segmentation is valuable because it adjusts automatically. For example, customers can be grouped based on their spending patterns, changing as new data updates. This provides flexible insights for decision-making.

When using dynamic segmentation in Power BI, selecting data through slicers can influence the segmentation groupings. This allows users to adjust views based on different time frames or criteria, making analysis more interactive and insightful.

A common application is clustering customers by the count of their orders. This method uses measures to distinguish customer groups dynamically, reflecting real-time changes and selections made by users in reports.

The basis of this technique involves using DAX measures, which are expressions that calculate and return data based on conditions set in the report.

DAX measures enable segmentation to be sensitive to filters and parameters, making the analysis robust and adaptable.

Creating dynamic and custom groupings is possible through DAX patterns, which might be categorized as a more advanced approach. This involves understanding the data model and how different elements interact with each other in Power BI.

The flexibility and depth provided by dynamic segmentation are important for users looking to perform detailed data analysis. Techniques, like custom groupings, offer powerful methods for uncovering insights into customer behaviors and sales trends.

Using resources such as those found in the DAX Patterns guide can provide further insights into implementing these techniques effectively.

Understanding DAX Basics

Data Analysis Expressions (DAX) is crucial for anyone working with Power BI, Power Pivot, or SQL Server Analysis Services. It is a formula language that enables users to work with data models to perform advanced calculations and data manipulation.

What is DAX?

DAX stands for Data Analysis Expressions. It is a collection of functions, operators, and constants that are used in Power BI and other Microsoft services like Power Pivot.

DAX formulas are similar to Excel formulas but are more powerful in handling relational and tabular data.

This language is specifically designed to work with a model-driven approach, allowing users to perform dynamic and complex calculations.

Whether creating calculated columns or measures, DAX is essential for enriching data analysis. For beginners, it may seem challenging, but with practice, it becomes a powerful tool in data modeling.

For more on learning DAX quickly, resources like the DAX Basics in Power BI guide can be useful.

Key Concepts in DAX

Understanding DAX requires familiarity with several key concepts such as functions, context, and relationships.

Functions in DAX include a range of operations like mathematical calculations, logical tests, and text manipulation.

Context, in DAX, refers to the environment in which a DAX formula is evaluated—either row context or filter context. Row context applies when functions are used to process each row individually, while filter context applies when filters are applied to data tables.

Relationships are crucial as they dictate how tables are connected and how data flows between them.

Mastering these concepts enables users to write efficient and complex DAX formulas.

Useful tools like quick measures in Power BI can help beginners understand and apply DAX expressions effectively.

Creating Quick Measures

Creating quick measures in Power BI simplifies the process of implementing calculations using DAX. These pre-made templates make it easy for users to generate complex formulas efficiently.

Benefits of Quick Measures

Quick measures offer significant advantages for both beginners and experienced Power BI users. They allow users to perform calculations without needing to write DAX code manually, which can save time and reduce errors.

Quick measures automatically generate the necessary DAX formulas based on user input, enhancing the user’s ability to produce accurate reports efficiently.

Additionally, they provide a great learning tool, as users can see the DAX behind each calculation and understand how it functions within their reports. This educational aspect can help users become more proficient with DAX over time.

How to Implement Quick Measures

Implementing quick measures in Power BI is straightforward. Users start by selecting the data they want to analyze and then choose from a variety of quick measure templates. These templates cover common calculations such as month-over-month changes and running totals.

To add a quick measure, navigate to the desired report and select the field on which you want to apply the calculation. Then, choose “Quick Measure” from the menu, and pick the calculation type.

After providing necessary parameters, Power BI generates the DAX formula automatically. This process significantly speeds up report creation and ensures consistency across multiple visuals in a project.

Advanced Techniques in DAX

DAX, or Data Analysis Expressions, in Power BI offers many advanced techniques to enhance data modeling and calculations. These techniques include using variables for simplification and optimizing calculations for performance improvements.

Using Variables in DAX

In DAX, variables enhance readability and efficiency. They allow complex formulas to be broken down into simpler parts.

For instance, using variables helps by storing a value or result that can be used multiple times in a formula, reducing repetition and potential errors.

Variables are defined with VAR followed by the variable name and expression. To utilize a variable, the RETURN statement is used.

This technique is beneficial for debugging since it allows the developer to check intermediate results.

When using variables effectively, the overall complexity of writing, reading, and maintaining formulas is reduced, leading to cleaner and more understandable code. It also improves performance by preventing the recalculation of repeated expressions within a formula.

Optimizing DAX Calculations

Performance is key when working with DAX, so optimizing calculations is crucial.

One technique is to minimize the use of row-level operations. Instead, using aggregate functions across columns can reduce computational load.

Avoiding iterative calculations like SUMX or FILTER on large datasets can also enhance performance. Instead, using calculated columns or measures can be more efficient.

To further optimize, developers can use smaller, more specific tables for analysis, and filter data early in calculations.

Using tools like DAX Studio can help in analyzing queries for optimization opportunities. These strategies ensure faster report performance and better resource management in Power BI.

Frequently Asked Questions

Power BI offers a wide range of tools, including quick measures, which streamline the process of creating DAX calculations. Understanding the differences between quick measures and regular measures is vital. Below are key questions often asked by users starting their journey with DAX in Power BI.

How can I create a quick measure in Power BI for common calculations?

Creating a quick measure in Power BI involves using a set of built-in templates for frequent calculations like month-over-month change.

Users simply select the desired calculation from a list, and Power BI generates the associated DAX formula automatically.

What distinguishes a quick measure from a regular measure in Power BI?

Quick measures are pre-defined calculations that utilize templates, making them easier for beginners. They are designed to simplify the creation of common measures, whereas regular measures require manual input of DAX code and offer more flexibility for customized calculations.

Where can I find a comprehensive list of DAX formulas used in Power BI measures?

Comprehensive lists of DAX formulas are available in various online resources and documentation provided by Microsoft.

These resources cover formulas for a range of operations in Power BI, which help both beginners and advanced users in their tasks.

What are the initial steps to learning DAX for Power BI effectively?

Starting with the basics of DAX, such as understanding its syntax and common functions, is crucial.

Resources like QuickStart: Learn DAX Basics in 30 Minutes provide a helpful introduction to get started efficiently.

Can you explain the difference between calculated columns and measures in DAX?

Calculated columns are added to data tables and evaluated for each row. They are used to create new data based on calculations.

Measures, however, are calculations used in aggregation and evaluation contexts, often providing insights across entire datasets rather than row-by-row.

Approximately how much time is required to become proficient in DAX for Power BI?

The time required to become proficient in DAX varies based on prior experience with similar tools.

Some users may grasp basic concepts in a few weeks, especially if focusing on common functions like SUMX or AVERAGEX, but advanced proficiency can take several months of practice and study.