Getting Started with Seaborn for Data Visualization
Seaborn is an essential tool for creating beautiful, informative graphics in Python. Built on top of Matplotlib, this library enhances data visualization by providing a high-level interface for drawing attractive statistical graphics.
Seaborn’s ease of use makes it a popular choice for beginners. Its well-designed API allows users to generate many types of plots with minimal code, facilitating a smoother learning curve.
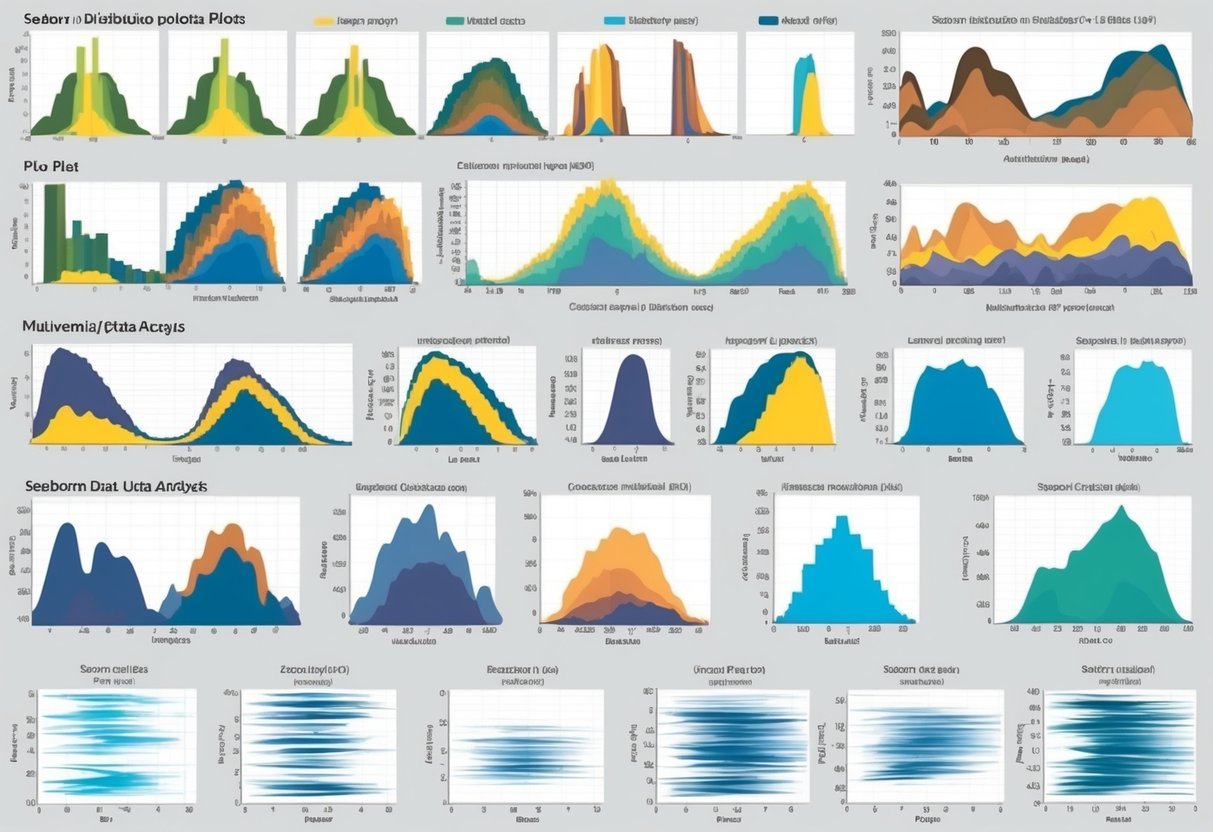
Users can create a variety of plots using Seaborn, including scatter plots, line plots, and distribution plots. This versatility helps in understanding different aspects of data. For example, distribution plots reveal data trends and patterns, essential in statistical analysis.
Key steps to get started with Seaborn:
-
Installation: Install Seaborn using
pip:pip install seaborn -
Basic Setup: Import Seaborn alongside Matplotlib to begin plotting:
import seaborn as sns import matplotlib.pyplot as plt -
Example Use: Create a simple plot using built-in datasets:
sns.set_theme()
tips = sns.load_dataset("tips")
sns.histplot(tips['total_bill'])
plt.show()
Seaborn’s plots are aesthetically pleasing and informative, adding value to any data analysis task. The library’s ability to create complex visualizations with simplicity in syntax makes it a preferred choice for data scientists and analysts.
Explore the potential of Seaborn by experimenting with different styles and themes to enhance the appearance of your plots. For more on specific types of distribution plots, refer to the realpython.com tutorial on Seaborn.
Understanding the Data: Importing and Preparing
To effectively use Seaborn for visualizations, it is crucial to start by importing and preparing your data. This involves loading datasets using Seaborn’s built-in functions and performing essential pre-processing tasks with Pandas. These steps ensure that the data is in the right format and ready for analysis.
Loading Data with Seaborn’s load_dataset
Seaborn offers an easy way to load example datasets using the load_dataset function. This function is handy for testing and learning purposes. By simply calling seaborn.load_dataset(), one can access well-known datasets such as the tips dataset, which contains data about restaurant tips, or the iris dataset, which includes measurements of iris flowers.
To load a dataset, specify the dataset name as a string argument in the function. For example:
import seaborn as sns

# Load the "tips" dataset
tips = sns.load_dataset('tips')
The load_dataset function returns a Pandas DataFrame, which is crucial for further analysis and manipulation. These example datasets are stored in a format that is readily usable with Seaborn’s plotting functions.
Pre-processing with Pandas
Once data is loaded into a DataFrame, the next step typically involves pre-processing it using Pandas. This is essential for cleaning the data and making it suitable for visualization.
Common tasks include handling missing values, filtering specific rows, and renaming columns for clarity.
For instance, removing any rows with missing values can be done using:
# Drop rows with missing values
tips_clean = tips.dropna()
Pandas also allows for more advanced manipulations, like grouping and aggregating data. Such tasks prepare the dataset for deeper analysis and visualization, making it more informative and easier to interpret.
Preparing clean, well-structured data is key to successful data visualization in Seaborn.
Basic Plotting Functions in Seaborn
Seaborn provides powerful tools for creating various plots that help visualize and understand data distributions and relationships. The key functions include histograms, scatter plots, line plots, and bar plots, each offering unique insights.
Creating Histograms with histplot
Histograms are an excellent way to visualize the distribution of a single variable. The histplot function in Seaborn is designed to create these visualizations. This function allows for customizing the number of bins, which are the intervals used to group data points.
Choosing the right number of bins is crucial for accurately showing the data’s distribution. Users can adjust bins to see more detailed or broader views of the data.
Additionally, it’s possible to apply color to different histogram bars to enhance visual distinction. This feature can help identify patterns or trends that might not be immediately obvious.
Managing the histplot function effectively can reveal significant insights into the data’s frequency distribution.
Scatter Plots and scatterplot Function
The scatterplot function is ideal for displaying relationships between two numerical variables. By plotting individual data points on a scatter plot, users can identify patterns, trends, or potential correlations.
This type of plot is beneficial for understanding how one variable relates to another. The scatterplot function allows for adjusting the size and color of points, which can represent different variables or groups within the data.
This customization provides a deeper layer of information, making it easier to spot clusters or outliers. Additionally, using hues can help separate data by category, adding another dimension to the analysis.
Seaborn’s ability to modify these elements makes scatter plots a flexible tool for data analysis.
Line Plot Essentials
Line plots are useful for visualizing data trends over time or a sequence. The lineplot function in Seaborn facilitates the creation of these plots by connecting data points with a line.
This visualization highlights how values change, making trends easier to observe. Users can customize line style, color, and the addition of markers to indicate specific data points.
These adjustments enhance the clarity of the trends being analyzed. Line plots are especially helpful for identifying consistent patterns or shifts in data over a period.
By effectively using the line plot function, analysts can gain insights into both short-term changes and long-term trends.
Bar Plots and Data Aggregation
Bar plots are excellent for displaying and comparing quantities across different categories. Seaborn’s barplot function assists in aggregating data and representing it using rectangular bars.
The length of each bar corresponds to the value it represents. This plot type is particularly effective for showing distinctions between groups.
One of the primary advantages of bar plots is their ability to represent both raw data and summaries like averages or other statistical measures. They can also be color-coded to highlight specific categories or variables, improving data visibility.
Customizing bar plots allows for highlighting comparisons across distinct categories, making them a versatile tool for data representation.
Univariate Distribution Analysis
Univariate distribution analysis focuses on visualizing a single variable’s data. It uses different plots to showcase the central tendency, dispersion, and shape of the data. Histograms, kernel density estimation, and rug plots are common methods for analyzing these distributions.
Visualizing Histograms and KDE Plots
Histograms are essential for displaying the distribution of a single variable. They divide the data into bins and use bars to show the count of observations in each bin. Choosing an appropriate bin size is crucial for accurately representing the data’s distribution.
The kernel density estimation (KDE) plot adds another dimension by displaying the data’s probability density. While histograms provide a view in discrete bins, KDE plots smooth the data. This results in a curve that is easier to read and offers insight into the central tendency and variability.
The Seaborn library uses the kdeplot() function for this purpose.
Rug Plots and Their Usage
Rug plots are another technique used in univariate distribution analysis. They display each data point directly on the plot as short vertical lines (or “rugs”), typically along the x-axis. This helps in understanding the data’s distribution.
When paired with a histogram or a KDE plot, a rug plot offers a more detailed view of individual data points. This combination provides immediate feedback on where actual data clusters exist, assisting in spotting anomalies or skewed data.
Seaborn’s rugplot() complements other distribution plots, adding depth to the visual analysis of univariate data.
Exploring Bivariate Data
Bivariate data analysis looks at relationships between two variables. This involves understanding how variables interact, often through visual tools like scatter plots and histograms. The focus here will be on using joint plots and pair plots to capture these interactions effectively.
Jointplot: Combining Scatter and Histogram
Joint plots are a powerful tool in data visualization, merging scatter plots and histograms into one compact view. This combination allows users to observe bivariate distributions and see how two variables relate.
The scatter plot shows individual data points, while histograms on the axes reveal the distribution of each variable.
A jointplot in Seaborn often includes options to display additional information, such as correlation coefficients. This makes it easier to measure the strength of the relationship between variables, often quantified by a metric like Pearson’s r.
Users can enhance joint plots with KDE (Kernel Density Estimation) to smooth the distribution line and add clarity.
Joint plots are ideal for exploring data patterns, highlighting clusters, and spotting outliers. Analysts can quickly assess whether a linear or non-linear relationship exists, aiding in further data modeling decisions.
Pair Plot Dynamics
Pair plots provide a dynamic overview of relationships across multiple pairwise combinations of variables. Unlike joint plots, which focus on a single bivariate relationship, pair plots display a grid of scatter plots and histograms, covering every variable in the dataset.
This comprehensive view is especially useful for datasets with more than two variables, offering insights into bivariate interactions between each pair.
Through these interactions, users can identify complex relationships and multivariate structures.
Seaborn’s pair plot feature includes options for customizing plots, such as adding hue to differentiate data classes. The ability to visualize this information easily helps uncover trends and correlations in the data that may not be apparent at first glance.
Overall, pair plots offer a clear, efficient way to explore numerous bivariate relationships simultaneously, making them a versatile choice for in-depth data analysis.
Working with Categorical Data
Categorical data is made up of discrete groups or categories. In data visualization, it’s crucial to display this data clearly to understand patterns and differences. This section explores various types of categorical plots in Seaborn, such as bar plots, box plots, violin plots, scatter plots, strip plots, and swarm plots.
Bar Plots, Box Plots, and Violin Plots
Bar plots are ideal for displaying categorical data. They show information using rectangular bars, where each bar’s length corresponds to the category’s value. This plot is particularly useful for comparing quantities across different categories.
Box plots give a five-number summary: minimum, first quartile, median, third quartile, and maximum. These plots are essential for identifying outliers and observing the spread of the data among categories.
Violin plots are similar to box plots but also show the data distribution’s density. They combine a box plot with a kernel density plot, providing deeper insights into the distribution shape. Violin plots are helpful for comparing data across different categories.
Categorical Scatter Plots
Categorical scatter plots are effective for displaying individual data points along a categorical axis. Strip plots and swarm plots offer nuanced ways to visualize such data.
In a strip plot, individual data points are displayed along a categorical axis. This plot can sometimes make data points overlap, which might obscure the data’s overall pattern.
A swarm plot addresses this by adjusting the position of points along the categorical axis to prevent overlap. This adjustment provides a cleaner view of the data, making it easier to see variations and patterns across categories.
Strip Plot and Swarm Plot
Strip plots show each data point as a single point along the category axis. They’re straightforward but can become cluttered if the data points overlap significantly.
Swarm plots solve this by offsetting points so that they do not overlap, preserving the original data distribution view. This makes it easier to distinguish individual points and provides an organized visualization of the data across different categories, especially when dealing with dense datasets.
These plots are particularly useful when one needs to observe how data points are distributed across different categories, assisting in detecting patterns or trends that may not be apparent otherwise.
Advanced Visualizations
Seaborn offers tools to create advanced visualizations that enhance data analysis. Techniques like heatmaps and facet grids allow users to explore relationships and patterns within datasets effectively.
Constructing Heatmaps
Heatmaps are ideal for visualizing data matrices. They display variable correlations using color gradients, making it easy to spot patterns.
Seaborn simplifies this with the heatmap() function, where users can input a dataset matrix and customize it using various options.
Cluster maps, which extend heatmaps, add hierarchical clustering to both rows and columns, revealing groupings within the data. Annotating heatmaps with numeric values can provide more detailed insights. Adding annotations can help in understanding the specific data values corresponding to each cell.
By leveraging these features, users can generate plots that not only highlight data relationships but also support complex analyses. Interactive Plotly visualizations can be used to explore larger datasets in detail.
Creating Facet Grids
Facet grids facilitate multi-plot visualization by creating a matrix of plots based on data categories. They are particularly useful for exploring relationships in multi-variable datasets.
In Seaborn, the FacetGrid class allows for easy structuring of grids. Users define row, column, and hue categories to create a grid layout.
Pair grids and facet grids are related, with pair grids being more focused on relationship exploration among multiple variables. This is especially helpful for revealing interactions between variables visually.
Facet grids encourage consistent formatting across plots, aiding comparison. They offer a systematic approach to data visualization, making intricate data patterns more accessible.
Customizing Plots for Better Insights

Customizing plots in Seaborn helps reveal deeper insights and makes the visualizations more engaging. By adjusting color palettes and modifying plot sizes and bins, users can create aesthetically pleasing graphics that enhance data analysis.
Adjusting Color Palettes
Color palettes play a key role in how data is perceived. Seaborn offers a wide range of palettes to decorate plots effectively, improving clarity and emphasis.
For instance, users might choose the darkgrid theme for a professional look or whitegrid for a cleaner appearance. Each palette can highlight specific data points and trends.
Choosing colors that contrast well can make plots stand out. Seaborn makes it easy to experiment with different palettes like deep, muted, or colorblind to find the best fit for a dataset. This approach helps ensure that colors are not just visually appealing but also functional in emphasizing critical data points.
Modifying Plot Sizes and Bins
Adjusting plot sizes and bins is crucial for displaying data accurately.
Seaborn’s high-level interface allows easy resizing of plots, which ensures that visualizations fit well on various devices or publications. Modifying plot dimensions can prevent overcrowding or excessive whitespace, making information clearer.
Bins, particularly in histograms, determine the number of intervals that data is divided into. By increasing or decreasing bins, analysts can control the granularity of the data.
More bins can reveal detailed patterns, while fewer bins provide a broader overview, helping to avoid misleading interpretations.
For both size and bin adjustments, Seaborn provides flexibility, making plots more insightful and tailored to specific analytical needs.
Plot Types and Customization in Seaborn
Seaborn is a powerful library for creating a variety of plots. It offers different plot types like displot, relplot, and catplot, each serving specific purposes. Customization is possible through axes-level functions that allow users to tailor visuals to fit their data presentation needs.
Differentiating displot, relplot, and catplot
Displot is used for visualizing the distribution of data. It offers options for histograms and kernel density estimates. It’s ideal for understanding the frequency and spread of data points. This makes it useful for gaining insights into univariate data distributions.
Relplot focuses on relational data. It allows users to explore connections between variables.
This plot type is essential when examining trends or relationships, such as growth over time. Relplot can represent data using scatter plots or line plots, adaptable for both categorical and continuous data.
Catplot is best for categorical data visualization. It includes various plots like bar plots, box plots, and violin plots, among others. They help highlight different aspects of categorical variables.
Catplot is versatile for showing comparisons across categories in a dataset. These plot types allow for comprehensive and insightful data analysis.
Customizing with Axes-Level Functions
Axes-level functions are key for fine-tuning plots in Seaborn. Functions like sns.lineplot or sns.scatterplot provide granular control over the style and mapping of data.
They help customize aspects like color, markers, and line styles, which enhances the clarity of visual data representations.
Users can modify plots to highlight specific data points or trends by adjusting axes, labels, and titles. This customization supports clearer data interpretation.
Axes-level customization can make charts more informative and visually appealing. Customization empowers users by tailoring visuals to specific data analysis needs.
Statistical Data Visualization Techniques
Seaborn offers powerful tools for statistical data visualization, helping users understand complex datasets. This section explores methods for analyzing data distribution and regression, focusing on specific techniques to visualize general trends and detect outliers.
ECDF Plots for Distribution Analysis
Empirical Cumulative Distribution Function (ECDF) plots are crucial for understanding data distribution in a straightforward manner. The ECDF plot is a step function that displays the proportion of observations below or equal to each unique data value.
This plot is particularly useful for comparing multiple datasets, as it provides a visual representation of data spread and central tendencies.
Seaborn’s ecdfplot function is a handy tool for creating these graphs. By plotting data points on a uniform scale, users can easily assess distribution characteristics like skewness and identify outliers.
Compared to traditional histograms or density plots, ECDFs offer a clearer view of the distribution, especially in highlighting data tails. This makes ECDF plots a preferred choice for exploratory data analysis, especially when the goal is to compare distributions between different groups.
Regplot and lmplot for Regression
Seaborn also excels in regression analysis through functions like regplot and lmplot. These tools help visualize the relationship between two variables by fitting a regression line over scatter plots.
Such plots are essential in spotting trends, relationships, and potential outliers within the data.
The regplot function is useful for simply overlaying a linear fit on data, while lmplot offers more advanced options, such as faceting by additional variables. This allows for multi-panel plots that show the regression across subsets of data, thus providing deeper insights into complex relationships.
These plots help clarify whether a relationship is linear or if there are non-linear patterns present.
Incorporating regression plots into analysis allows for a clearer understanding of how variables interact statistically and visually.
Analyzing Distribution Characteristics
When analyzing data, understanding its distribution is key. Seaborn provides various tools to achieve this, especially through distribution plots. These plots help visualize how data points are spread across different values.
The histogram is one of the most common distribution plots. It groups data into bins and shows how many data points fall into each bin. This is useful for identifying patterns like skewness or data concentration.
Another plot type is the density plot, which smooths out data distributions. It provides a more polished view compared to histograms, making it easier to see trends and peaks in the data.
Furthermore, the bivariate plots are excellent for exploring the relationship between two variables. These plots can include scatter plots or heatmaps.
For example, a bivariate distribution plot can reveal correlations by using a heatmap to display data density.
Seaborn also offers the pairplot, which combines different types of plots. This is useful for examining multiple variables at once, allowing for insightful multivariate analysis.
Analyzing distribution characteristics involves inspecting measures like skewness and kurtosis to understand the symmetry and peakedness of the distribution. With Seaborn’s distribution plots, users can effectively examine these features, providing a thorough overview of data characteristics.
Understanding Multivariate Data

Multivariate data involves observations with more than one variable. Analyzing these data points is essential for identifying patterns and relationships among variables. Tools like Seaborn provide versatile plots that reveal these complex structures.
Visualizing Multi-dimension Data
Visualizing multivariate data involves showing relationships between multiple variables. Pairplot is a powerful tool, offering comprehensive visuals by creating a grid of scatter plots for continuous variables. It helps identify clusters, trends, and correlations.
Another useful tool is FacetGrid, which lets users plot subsets of data across multiple facets. This is helpful to compare different categories of a categorical variable while analyzing continuous characteristics.
Seaborn’s scatter plots can also visualize multivariate data by using color to encode a third variable’s information. These methods are crucial in exploratory data analysis to understand and interpret complex datasets better. Learn more about these techniques by exploring the detailed guide on multivariate data analysis.
Frequently Asked Questions

Seaborn offers a variety of options for visualizing data distribution in Python. In this section, users will discover how to work with distribution plots and learn about specific plotting functions and customization techniques available in Seaborn.
How can one create and interpret a seaborn distribution plot in Python?
To create a distribution plot in Seaborn, use the distplot or displot function. These plots help visualize the distribution of a dataset, providing insights into patterns such as central tendency and variability. Interpreting these plots involves examining features like peak areas, spread, and any skewness present in the data.
What are the key differences between histogram and distribution plots in seaborn?
Histograms are used to group continuous variables into bins, showing the frequency of occurrences in each bin. Distribution plots, on the other hand, can include kernel density estimation (KDE) which smoothens the appearance, providing a more detailed view of the data’s distribution shape.
Which seaborn function is used to visualize data distribution?
Seaborn features several functions for visualizing data distribution, such as distplot, displot, and kdeplot. These functions offer flexibility in how data distributions are displayed, including options for histograms, KDE, and empirical cumulative distribution functions (ECDF).
In seaborn, which plots are most suitable for visualizing statistical distributions?
For visualizing statistical distributions, Seaborn’s KDE plots, histograms, and pair plots are quite effective. Each offers unique ways to understand data spread and relationships. KDE plots are particularly helpful for seeing smooth distribution curves, while pair plots can examine multi-variate relationships.
Can you outline the steps to customize the appearance of seaborn distribution plots?
Customization in Seaborn is straightforward. By altering parameters like color, alpha, and bins, users can tailor plot aesthetics. Additionally, using matplotlib settings, plots can be further refined with customized axes, titles, and labels for improved clarity and presentation.
What are the various options for plotting bivariate distributions using seaborn?
Seaborn offers several options for bivariate distributions, including scatterplot, kdeplot, and jointplot functions.
These plots help visualize relationships between two variables, showing patterns like correlation and clustering.
Joint plots, for instance, combine scatter plots with histograms or KDE for enhanced insights.
