Fundamentals of Polynomial Regression
Polynomial regression extends linear regression by allowing relationships between the independent and dependent variables to be modeled as polynomials. This approach provides flexibility to capture more complex patterns, making it a crucial tool in various regression problems.
Understanding Polynomial Features
In polynomial regression, new features are created by raising the original input features to varying powers. For instance, a single feature ( X ) becomes ( X^2, X^3 ), and so on.
This transformation results in a more complex regression model.
The newly derived features interact with coefficients to predict outcomes. This allows the model to fit the data more precisely, effectively handling non-linear patterns.
However, the addition of polynomial terms increases model complexity, which may lead to overfitting, especially if the training data is not sufficiently diverse.
Role of Polynomial Regression in Machine Learning
Polynomial regression plays a significant role in machine learning by modeling complex relationships that linear models cannot describe. By adjusting the polynomial degree, the model can adapt to varying levels of intricacy within the data.
This adaptability is useful in capturing complicated data trends while managing the trade-off between bias and variance.
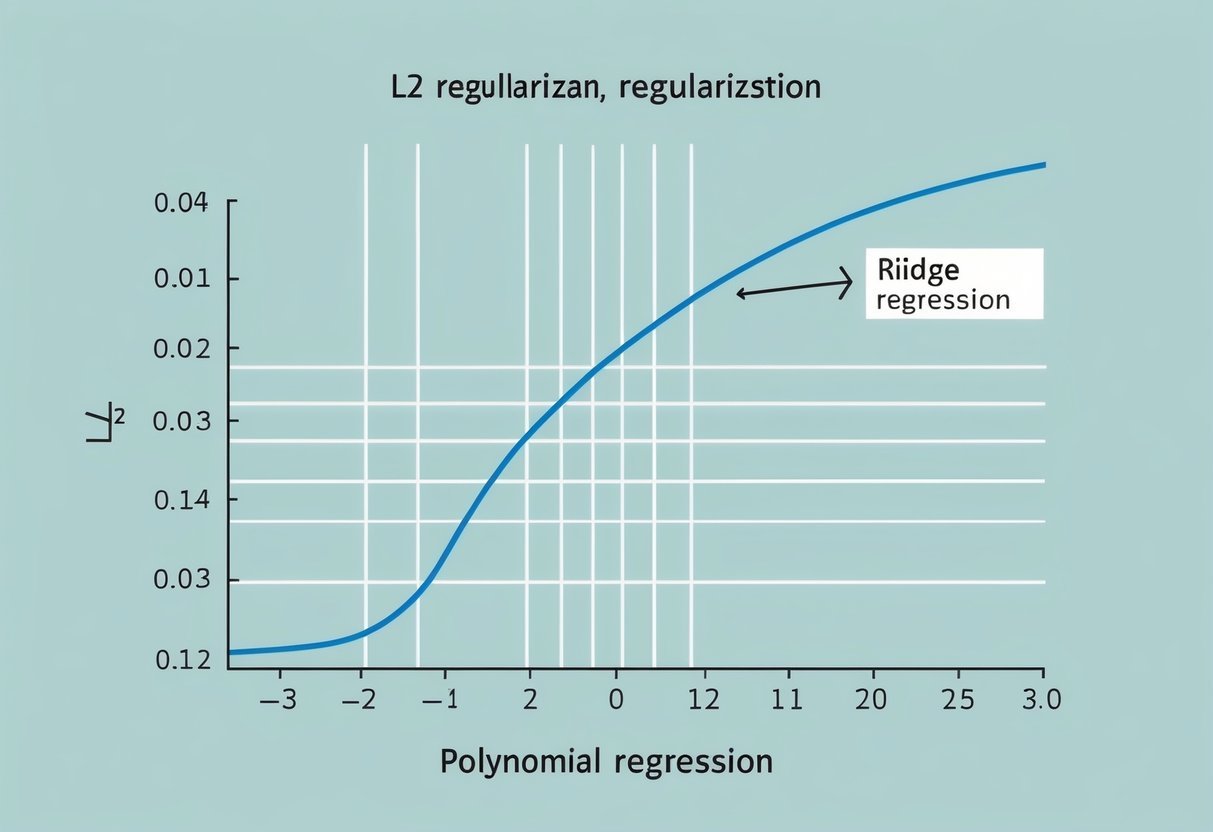
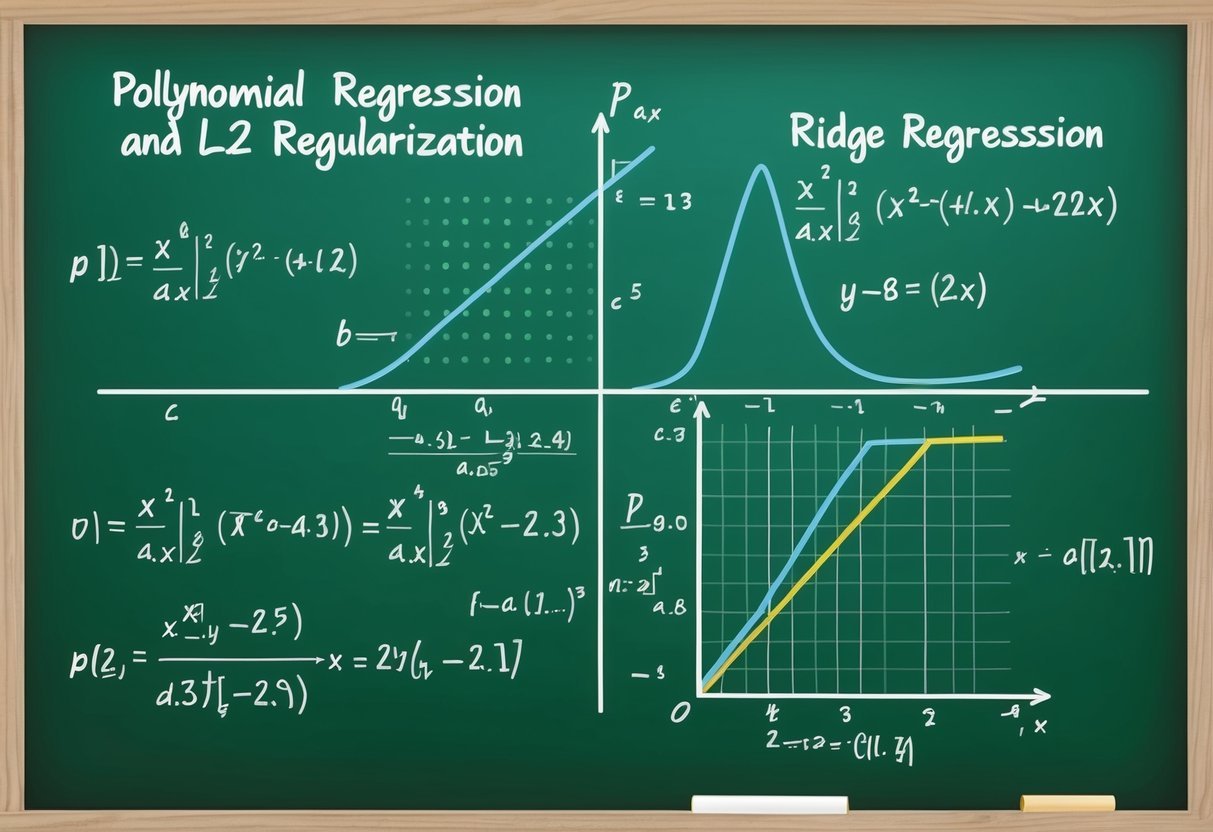
Regularization techniques, such as Ridge regression, are often paired with polynomial regression to address overfitting. This approach penalizes excessive complexity by adjusting the magnitude of the coefficients, ensuring that the model remains generalizable to unseen data.
Employing polynomial regression in this manner offers a balance of flexibility and accuracy, which is valuable in predictive analytics and other real-world applications.
Ridge Regression Explained
Ridge regression, a form of L2 regularization, addresses overfitting in linear models by adding a penalty to the loss function. This technique is beneficial when dealing with multicollinearity in datasets, enhancing model stability and predictions.
Defining Ridge Regression
Ridge regression is a technique used to prevent overfitting in linear regression models. It achieves this by adding a regularization term to the objective function. This term is proportional to the square of the magnitude of coefficients (L2 regularization).
By penalizing large coefficients, ridge regression stabilizes the model’s predictions.
The objective function in ridge regression is modified by the addition of this penalty. It is expressed as:
Objective function:
RSS + λΣβ²
- RSS is the residual sum of squares.
- λ is the regularization parameter
- Σβ² represents the sum of squared coefficients.
This approach is useful in scenarios with high-dimensional data or where predictor variables are highly correlated.
Ridge regression can effectively manage multicollinearity, improving the reliability of predictions by ensuring that the coefficients are not excessively large.
Benefits and Applications
Ridge regression offers several advantages in data modeling. It helps in managing multicollinearity and improving prediction accuracy.
A significant benefit is its ability to handle datasets with many independent variables, especially when these predictors are closely related.
The regularization parameter, λ, controls the extent of the penalty. Choosing a suitable λ involves balancing between bias and variance. A larger λ increases bias but reduces variance, stabilizing the model.
Ridge regression is widely used in machine learning applications where prediction accuracy is crucial. It is particularly beneficial in fields like finance and biology, where multicollinearity is common.
Its capacity to mitigate overfitting makes it a valuable tool for building robust predictive models.
L2 Regularization and Its Impact
L2 regularization, also known as Ridge Regression, plays a crucial role in addressing overfitting by adding a penalty term to the cost function. This approach maintains the balance between fitting the data well and keeping model complexity in check.
Mathematical Foundation of L2 Regularization
In L2 regularization, a penalty term proportional to the square of the magnitude of coefficients is added to the loss function. This penalty term, denoted as λ∑(coef_²), discourages large coefficients.
When λ is large, coefficients shrink significantly, reducing the model’s complexity. This helps prevent overfitting by ensuring the model doesn’t fit noise in the data.
The goal is to improve the model’s generalization to new data, making it a vital technique in machine learning.
For further detail, see the diagram on regularization in this Stanford University document.
Contrast with L1 Regularization
While L2 regularization prevents overfitting by controlling the magnitude of the coefficients, L1 regularization, or Lasso Regression, uses a different approach. L1 adds a penalty equal to the absolute value of the coefficients, λ∑|coef_|.
This can lead to some coefficients becoming exactly zero, effectively selecting features. This makes L1 useful for feature selection in high-dimensional data.
Both techniques can be combined in Elastic Net, which leverages L1’s feature selection and L2’s shrinkage. Each technique addresses different needs, ensuring flexibility in creating robust models.
You can learn more about these differences at Dataquest’s blog.
Preventing Overfitting in Practice
Preventing overfitting in machine learning is crucial for building efficient models. Two key areas are understanding the balance between overfitting and underfitting and tuning the regularization strength, often referred to as alpha.
Comparing Overfitting and Underfitting
Overfitting occurs when a model learns the training data too well, capturing noise along with the underlying pattern. This makes the model perform poorly on new data due to high variance.
Underfitting, conversely, happens when a model is too simple, failing to capture the data’s complexity, leading to high bias. Both extremes increase the mean squared error on unseen data.
To avoid these issues, it’s essential to monitor the model’s performance on both training and validation data.
Balance can be assessed through learning curves that plot error rates against the training set size.
Alpha: Tuning the Regularization Strength
The parameter alpha is vital for controlling the regularization strength in Ridge regression, which uses L2 regularization.
A higher alpha increases the penalty on large coefficients, reducing model complexity and potential overfitting.
Conversely, too high an alpha leads to underfitting as the model becomes overly simple.
Choosing an optimal alpha depends on the specific dataset and model goals.
Cross-validation is a practical technique to test different alpha values and find the one offering the best balance between bias and variance. This process ensures the model generalizes well to new data, maintaining a low mean squared error.
Working with Sklearn for Ridge Regression
Using Sklearn for Ridge Regression allows users to build and fine-tune models efficiently with built-in functions that simplify the process. Key considerations include implementation and understanding how hyperparameters like alpha and max_iter affect the model.
Implementing Ridge Regression with Sklearn
Ridge Regression can be implemented using the Ridge class from the sklearn.linear_model module. This allows for effective prediction while handling multicollinearity by adding an L2 penalty to the loss function. Here’s a simple example:
from sklearn.linear_model import Ridge

ridge = Ridge(alpha=1.0, random_state=42)
ridge.fit(X_train, y_train)
predictions = ridge.predict(X_test)
In this code, alpha controls the amount of regularization. A value of 1.0 is a starting point, but this can be adjusted accordingly.
Setting random_state ensures reproducibility, and fit trains the model on the training data. Predictions are easily made using the predict method on test data.
Hyperparameters and Their Effects
Hyperparameters like alpha, max_iter, and tol play vital roles in model performance.
The alpha parameter influences the strength of the regularization. A higher value typically increases bias and reduces variance, which can help prevent overfitting.
The max_iter parameter sets the maximum number of iterations for the solver. Increasing this may help convergence, especially for complex datasets, but can lead to longer computation times.
Threshold tol decides the solver’s tolerance for stopping. Lower values may increase accuracy but can also raise computational cost.
Understanding and tuning these parameters is essential to optimize Ridge Regression models effectively.
Understanding the Cost Function
In ridge regression, the cost function is crucial in managing the balance between fitting the training data and keeping model simplicity. It helps in controlling the complexity of the model by adding a regularization term that adjusts the coefficients.
The Role of the Cost Function in Ridge Regression
The cost function of ridge regression is an extension of the traditional mean squared error used in linear regression. What sets it apart is the addition of an L2 regularization term.
This term penalizes large coefficients by adding their squared values to the error. This way, the model not only focuses on minimizing the error but also reduces overfitting by shrinking the coefficients.
By integrating the squared magnitude of coefficients into the cost, ridge regression addresses issues like multicollinearity.
In datasets with highly correlated variables, the model performance improves as it prevents any variable from dominating the prediction. This stabilization makes ridge regression a reliable choice for handling complex datasets.
For more insights on this, the article on ridge regression provides useful information.
Minimizing the Cost for Better Model Performance
Minimizing the cost function in ridge regression means finding a set of coefficients that yield the smallest error while maintaining control over their size.
The process involves optimizing both the data fit and the penalty term. Regularization strength, controlled by a parameter known as lambda, plays a key role in this balance.
As lambda increases, the penalty on large coefficients also grows. This usually results in smaller coefficients, which helps in combating overfitting.
The trick is to choose a lambda that achieves a desirable bias-variance trade-off, where the model remains accurate on new data despite slight errors on the training set.
For a practical approach to implementing this, refer to the guide on ridge regression.
Key Model Evaluation Metrics
In evaluating polynomial regression models, understanding key metrics is vital. These include how the model’s score signifies its ability to predict accurately, along with interpreting the coefficients and the intercept to understand the model’s composition and influence.
Assessing Model Performance with Score
The score of a regression model typically refers to the R² value, which indicates how well the independent variables explain the variability in the dependent variable.
An R² value close to 1 implies that the model explains most of the variability.
Ridge Regression, using L2 regularization, adds a penalty to high coefficient values, which helps improve stability and prevent overfitting.
Models with excessively high coefficient values may perform well on training data but poorly on unseen data, a problem known as overfitting. Ridge Regression remedies this by moderating the importance given to each feature.
Calculating the adjusted R² can further refine insights by adjusting for the number of predictors in the model, ensuring a fair assessment.
Interpreting Coefficient Values and Intercept_
In regression analysis, coefficient values represent the amount of change in the dependent variable for a one-unit change in the independent variable, while all other variables are held constant.
In Ridge Regression, these coefficients are shrunk towards zero through L2 regularization, which controls multicollinearity and enhances model stability.
The intercept_ is the expected value of the dependent variable when all independent variables are zero. It provides a baseline prediction.
Adjusting coefficient values in the presence of high correlation among predictors is crucial for valid analysis. The process requires careful balancing to ensure that the model remains interpretable while effectively capturing the nuances of the data dynamics.
Regularized Linear Regression for Feature Selection
Regularized linear regression techniques like L2 regularization help in managing model complexity while selecting important features. These methods can reduce overfitting by controlling the size of the coefficients, leading to more generalizable models.
How Regularization Affects Feature Selection
Regularization modifies the learning algorithm to prevent overfitting by adding a penalty term to the loss function.
In ridge regression, this penalty is the sum of squared coefficients. When this penalty is applied, less important features tend to have their coefficients shrink.
Feature selection arises from this shrinking effect, as it leads to identifying which features have the most influence on the prediction.
By using L2 regularization, models can maintain a balance between fitting the training data and avoiding overly complex models. This approach helps in improving the model’s performance on unseen data.
Balancing Complexity and Performance
Balancing complexity and performance is critical in model development.
Regularization assists in striking this balance by penalizing large coefficients, which helps limit model complexity.
Notably, ridge regression is suitable for situations with many correlated features.
In scenarios where a large number of features are present, regularization techniques ensure that the model does not become just a memorization of the training data.
The regularization parameter, often denoted as λ, controls the strength of the penalty, enabling fine-tuning of the model’s complexity. This process results in a model that is neither too simple nor too complex, achieving both accuracy and generalization.
Optimizing Model Complexity for Generalization
Optimizing model complexity is crucial for ensuring a model’s ability to generalize well. This process involves finding the right balance between bias and variance while using regularization techniques to enhance model performance.
Understanding the Balance between Bias and Variance
Balancing bias and variance is vital in machine learning.
A model with high bias may be too simplistic, missing important patterns (underfitting). On the other hand, a model with high variance may capture noise instead of actual patterns, which leads to overfitting.
To achieve better generalization, a model should manage this balance effectively. Bias-variance trade-off refers to the balance between these two elements.
Lowering variance often involves accepting a bit more bias to avoid overfitting, thus improving the model’s performance on new data.
Finding this balance involves evaluating and adjusting model parameters, often requiring experimentation and iteration to identify the optimal settings.
It’s important to remember that neither extreme is desirable, and the goal is to find the middle ground where the model performs well on unseen data.
Applying Regularization for Generalization
Regularization helps prevent overfitting by adding a penalty to model parameters, which discourages complex models.
L2 regularization, also known as Ridge Regression, is a popular method that adds a penalty proportional to the square of the magnitude of coefficients.
This approach keeps coefficients small and helps maintain simpler models.
L1 regularization and other techniques are also used, but Ridge Regression is particularly effective for linear models.
By controlling model complexity, regularization enhances a model’s capacity to generalize well to unseen data, making it a crucial practice in designing robust machine learning models.
Data Handling for Robust Regressions

Handling data effectively is critical for achieving strong regression models. Addressing outliers and properly splitting data into training and test sets are crucial steps that influence the reliability of predictive outcomes.
Dealing with Outliers in the Data
Outliers can skew the results of regression models, leading to inaccurate predictions. Identifying these outliers is essential, and methods such as box plots or statistical tests like the Z-score can help detect them.
Once identified, outliers may be treated in different ways. They might be removed, modified, or studied in depth to understand their significance.
For ridge regression, outliers can affect the penalty applied to variables, leading to possible biases. Proper handling ensures that the model’s coefficients remain stable and true to the data’s core patterns.
By maintaining a clean dataset, the predictability and reliability of the regression model are enhanced.
Preparing Training and Test Data
Proper preparation of training and test data is vital for creating robust regression models.
Data should be split into distinct sets—typically, 70% for training and 30% for testing. This ensures that the model learns on one set and is evaluated on another, minimizing overfitting.
Training data is crucial for parameter tuning, especially in ridge regression, where the regularization parameter λ must be optimized.
A good practice is to use techniques like cross-validation to determine the best parameter values. The test data, on the other hand, assesses how well the model generalizes to new, unseen samples.
This division ensures the prediction model remains robust and adaptable to real-world scenarios.
Advanced Topics in Ridge Regression
Ridge regression plays a crucial role in regularized linear regression. It addresses multicollinearity and overfitting by using a penalty on the size of coefficients. This section covers different ways to solve ridge regression problems and methods to prepare polynomial features for use in this technique.
Closed-Form Solution Versus Iterative Methods
The closed-form solution for ridge regression is often preferred for its computational efficiency. It involves using matrix operations to find the optimal coefficients by minimizing the regularized cost function.
This solution can be derived by adjusting the ordinary least squares formula to include the regularization term. This approach uses the formula:
[ hat{beta} = (X^TX + lambda I)^{-1}X^Ty ]
where (lambda) is the regularization parameter and (I) is the identity matrix.
This method quickly gives results for small to medium-sized data sets, but it may become impractical for very large matrices due to memory limitations.
On the other hand, iterative methods like gradient descent or coordinate descent are valuable for handling large-scale data sets. These methods iteratively adjust the coefficients, progressively moving toward the optimal solution.
While often slower on small problems, they scale more effectively with bigger data, making them an important alternative in ridge regression analysis.
Engineering Polynomial Features for Ridge Regression
Engineering polynomial features involves transforming original data into polynomial terms to capture more complex relationships. This process makes ridge regression more flexible when dealing with non-linear data patterns.
New features are created by raising the existing features to various powers, creating terms such as (X^2, X^3), and so on.
However, adding polynomial features can cause overfitting, especially with high-degree polynomials. Ridge regression helps manage this risk by including the regularization term that penalizes excessive model complexity.
Practitioners should carefully select the degree of polynomial features and tune the regularization parameter (lambda) for optimal model performance.
When engineering these features, it’s crucial to normalize or standardize the data. This ensures all features are on a similar scale, which favors the effectiveness of ridge regression.
Overall, constructing polynomial features paired with ridge regression allows for sophisticated modeling of complex data patterns while controlling for multicollinearity and overfitting.
Applying Ridge Regression to Unseen Data

Applying ridge regression to unseen data requires careful handling to maintain robust predictive performance. This approach helps to prevent overfitting and allows the regression model to generalize well when introduced to new datasets.
Predictive Performance on New Data
When a regression model is exposed to unseen data, how well it predicts is crucial.
Ridge regression introduces a penalty term to handle overfitting by keeping coefficient values small. This regularization helps the model maintain stable predictive performance even with different datasets compared to models without such techniques.
Testing on unseen data provides a realistic measure of how well the model will perform in practical scenarios.
Evaluating ridge regression’s predictive performance often involves comparing R-squared values from training and test datasets. Consistently high values across both suggest the model’s ability to generalize well.
The goal is to ensure the model predicts outcomes accurately across diverse datasets, minimizing errors.
Case Studies and Practical Applications
In real-world applications, ridge regression shows effectiveness in fields such as finance, healthcare, and social sciences.
In finance, it helps in forecasting stock prices by accounting for numerous variables. In healthcare, predicting disease outcomes benefits from the model’s ability to manage multicollinearity in patient data.
Academic studies often demonstrate the advantages of ridge regression. For instance, ridge regression is applied in clinical research to predict patient responses based on multiple factors.
Such case studies emphasize the practical applications of ridge regression for handling complex data with many predictors while maintaining accuracy and interpretability.
Frequently Asked Questions

Ridge Regression, a type of L2 regularization, aids in addressing overfitting and multicollinearity issues in regression models. It is distinct from Lasso Regression and has specific applications in machine learning.
What is the purpose of using Ridge Regression in machine learning?
Ridge Regression is used to improve the predictive performance of linear models by adding a penalty for large coefficients, which helps prevent overfitting. This method is particularly useful when dealing with multicollinearity, where independent variables are highly correlated, thereby stabilizing the model.
How does L2 regularization in polynomial regression prevent overfitting?
L2 regularization, also known as Ridge Regression, adds a penalty term to the loss function proportional to the square of the magnitude of coefficients. This discourages complex models by shrinking coefficients, ensuring that the model generalizes better to unseen data rather than capturing noise from the training set.
What distinguishes Ridge Regression from Lasso Regression?
The key difference between Ridge and Lasso Regression lies in their penalty terms. Ridge Regression uses the L2 norm, which shrinks coefficients without setting any to zero. In contrast, Lasso Regression uses the L1 norm, which can shrink some coefficients to zero, effectively performing variable selection.
Can you explain the concept of Ridge Regression and L2 Regularization?
Ridge Regression involves enhancing linear models through L2 regularization, which adds a penalty on the size of coefficients. This helps mitigate issues caused by overfitting and multicollinearity by keeping the model coefficients small, thus leading to more robust predictions and reduced variance in the model’s output.
In what scenarios is Ridge Regression preferred over other types of regression?
Ridge Regression is suitable when dealing with datasets where independent variables are highly correlated, known as multicollinearity. It is also preferred when the goal is to mitigate overfitting without eliminating predictors from the model, making it a reliable choice for complex datasets with numerous predictors.
How is Ridge Regression implemented in programming languages like R?
In R, Ridge Regression can be implemented using packages like glmnet. This package provides functions to fit linear and generalized linear models with regularization paths. This enables the use of Ridge Regression through simple function calls.
Users can specify the regularization strength through the lambda parameter to control the penalty applied to the coefficients.
