Categories
Uncategorized

Learning Math for Machine Learning – Partial Derivative Calculus Essentials Explained

Foundations of Calculus for Machine Learning

Calculus is essential for machine learning. It underpins algorithms involving optimization and change. It includes derivatives, gradients, and partial derivatives. Calculus helps algorithms like gradient descent find minima and maxima in functions, crucial for model training.

Basic Concepts of Calculus

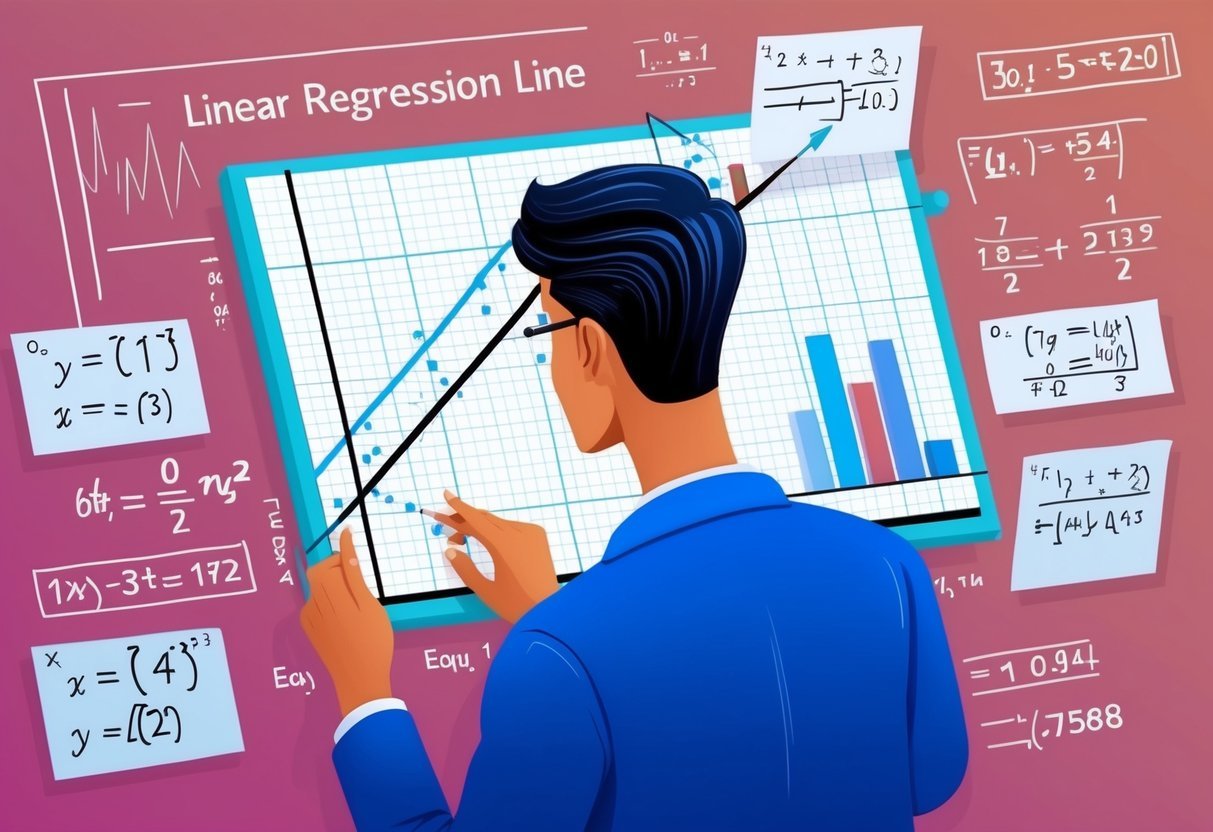
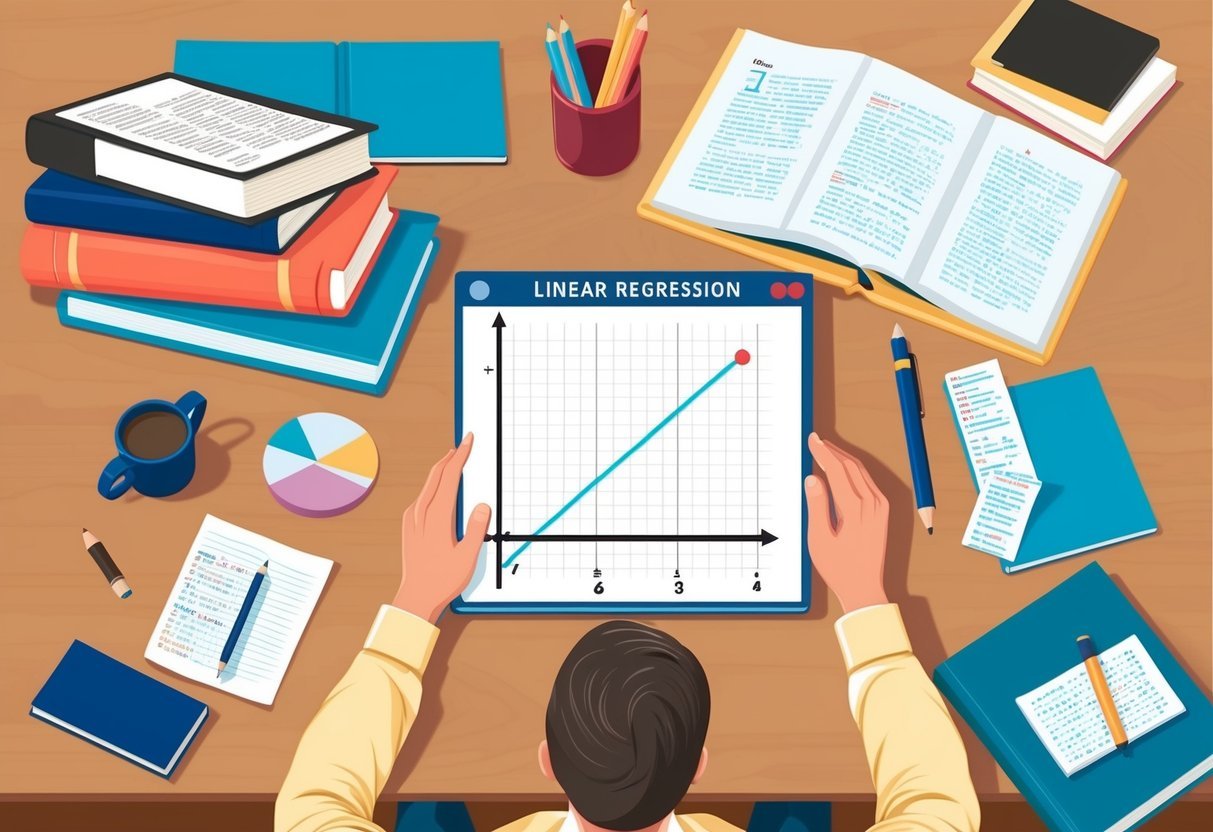
Calculus is divided into two main branches: differential and integral calculus. Differential calculus focuses on the concepts of change and slope, which can be expressed through derivatives.

In machine learning, finding a derivative helps in determining gradients. Gradients measure change in output with respect to input and guide optimization algorithms.

On the other hand, partial derivatives are used in multivariable calculus. They measure how functions change with respect to one variable, keeping others constant.

Knowing these concepts is important for understanding how models learn and adjust their predictions.

Importance of Calculus in AI

Calculus plays a major role in artificial intelligence by aiding in model training. The gradient descent algorithm, for instance, uses partial derivatives to minimize error functions. This process involves iteratively moving towards the lowest error.

By computing gradients, models adjust parameters for improved accuracy.

Linear algebra works with calculus to handle data transformations and matrix operations, crucial in neural networks.

Knowledge of these mathematical tools is vital for developing efficient learning algorithms and achieving accurate models in AI tasks.

Understanding Derivatives and Gradients

Derivatives and gradients play a crucial role in machine learning. They help to optimize algorithms by adjusting parameters efficiently. Knowing how these mathematical concepts function can enhance comprehension and application in diverse machine learning tasks.

Notion of Derivative

A derivative measures the rate of change of a function. It’s analogous to finding the slope of a tangent line at any given point on a curve.

In machine learning, derivatives are vital for understanding how slight changes in input affect outputs. This helps in adjusting model weights or parameters.

The derivative is the foundation for many calculations, enabling developers to fine-tune predictions.

Specifically, partial derivatives are used when dealing with functions of multiple variables. Each variable’s rate of change is calculated separately, which is crucial in complex models such as neural networks.

Gradients and Gradient Vectors

Gradients extend the concept of derivatives to functions of multiple variables. A gradient is a vector comprising all the partial derivatives of a function. It points in the direction of the steepest increase, indicating how to adjust parameters to minimize errors in a model.

In machine learning, the gradient vector guides the optimization process. Algorithms like gradient descent rely on gradients to find the minimum of a cost function.

By moving along the gradient vector, models iteratively improve, enhancing accuracy and performance. Understanding gradients is essential for implementing and troubleshooting various learning algorithms.

Essentials of Partial Derivatives

Partial derivatives are an essential tool in multivariate calculus, particularly relevant in the field of machine learning. They enable the understanding and optimization of functions dependent on multiple variables by evaluating their rate of change with respect to each variable independently.

Concept of Partial Derivative

The concept of a partial derivative involves taking the derivative of a function with several variables while holding the other variables constant. This process is known as partial differentiation.

For example, if a function ( f(x, y) ) needs analysis, the partial derivative of ( f ) with respect to ( x ) is computed by treating ( y ) as a constant.

In mathematical notation, the partial derivative of ( f ) with respect to ( x ) is represented as ( frac{partial f}{partial x} ). This helps identify how changes in just one of the variables impact the overall function.

In multivariate calculus, understanding partial derivatives is crucial for working with complex functions that appear frequently in various scientific fields.

Applications in Machine Learning

In machine learning, partial derivatives are critical for performing optimization tasks, particularly in algorithms that require gradient-based approaches.

During the training of models, such as neural networks, partial derivatives are used to compute gradients. These gradients then guide the adjustment of model parameters to minimize error functions.

A practical implementation involves the backpropagation algorithm, which efficiently calculates partial derivatives of error functions with respect to each network parameter.

This is essential for improving model accuracy and performance. With these insights, partial derivatives facilitate advancements in designing more efficient and accurate algorithms.

Diving Deeper: Multivariable Calculus

Multivariable calculus expands the concept of calculus to functions with more than one variable. This allows for the exploration of vectors, gradients, and more, becoming essential when dealing with machine learning. Central concepts include partial derivatives and matrices like the Jacobian and Hessian.

Understanding Multivariable Functions

Multivariable functions depend on two or more inputs. These functions are often represented as ( f(x, y, z) ), where ( x, y, ) and ( z ) are independent variables.

Vectors play a crucial role here by organizing these inputs into a single mathematical object. Functions can describe spaces beyond three dimensions, which are common in machine learning.

A function’s value changes with each variable, making it key to understanding complex systems. This multidimensional approach helps in optimizing functions by examining how changes in each variable impact the result.

It’s especially useful in techniques like gradient descent, where gradients map out the direction of steepest ascent or descent.

Partial Derivatives in Multiple Dimensions

Partial derivatives involve taking the derivative of a multivariable function with respect to one variable, keeping other variables constant. They help in finding gradients, which are vectors representing the direction and rate of steepest ascent.

The Jacobian matrix is the collection of all first-order partial derivatives of a vector-valued function. Meanwhile, the Hessian matrix contains second-order partial derivatives, providing insight into a function’s curvature.

These matrices are instrumental in advanced optimization problems, as they help refine models and algorithms used in machine learning. This mathematical framework is integral for tasks that require precise adjustments and predictions in high-dimensional spaces.

Critical Role of Linear Algebra

Linear algebra is essential for machine learning. It provides tools like matrices, which help in handling data efficiently. Concepts such as eigenvectors and eigenvalues are crucial for simplifying complex machine learning operations.

Matrices and Their Significance

Matrices are fundamental in linear algebra, serving as a primary way to represent data. In machine learning, they organize input data, making operations like transformations and scaling possible.

Operations on matrices, like multiplication, are central to algorithms in machine learning.

Using matrices, data can be represented in a more structured format, facilitating computations. They’re used in various models, such as neural networks, where weights and activations are stored in matrix form.

This mathematical foundation simplifies complex operations and improves computational efficiency.

Eigenvectors and Eigenvalues

Eigenvectors and eigenvalues are key in understanding data transformations. They help in identifying directions where data varies the most.

This concept is crucial in techniques like Principal Component Analysis (PCA), which reduces data dimensionality by focusing on these significant directions.

In machine learning, eigenvectors indicate principal axes, while eigenvalues measure the variance along these axes.

These concepts allow for simplifying data, reducing noise, and focusing on the most informative features. This approach enhances machine learning models by making them more efficient and faster to train.

Algorithms and Optimization Techniques

A chalkboard filled with equations and graphs related to partial derivative calculus, surrounded by books on algorithms and optimization techniques

Understanding algorithms and optimization techniques is crucial in machine learning, especially to enhance the performance of models. Two key focus areas include the gradient descent algorithm and various advanced optimization methods used to solve complex problems.

Gradient Descent Algorithm

The gradient descent algorithm is a fundamental method for optimizing functions in machine learning. It is used to minimize functions, typically the error function in neural networks.

This algorithm iteratively adjusts parameters to reduce the error by calculating the partial derivative related to each parameter. By identifying the steepest descent direction, it updates the weights to find a local minimum.

Gradient descent comes in several variations, like stochastic, batch, and mini-batch, each with unique advantages.

Stochastic gradient descent updates weights using a single data point, providing quicker updates but more noise. Batch gradient descent uses the entire dataset, offering stability, but is computationally expensive. Meanwhile, mini-batch combines the two approaches for efficiency and speed.

Advanced Optimization Methods

Modern machine learning models often require advanced optimization methods beyond basic algorithms.

Techniques like Adam, RMSprop, and AdaGrad enhance the traditional gradient descent by adapting learning rates for each parameter, leading to faster convergence. These methods are essential for training deep networks effectively.

Large-scale optimization techniques are also critical when dealing with vast datasets and complex models.

Methods such as L-BFGS and conjugate gradients are used in scenarios where efficient computation and memory usage are vital.

These algorithms help in solving large-scale optimization problems, enabling better resource management and accurate model training for significant applications.

Machine Learning Models and Training

Machine learning models use mathematical concepts to train and improve their performance. Calculus is essential to understanding how these models learn and optimize their predictions. Key techniques include the use of derivatives to update model parameters, particularly in neural networks.

Role of Calculus in Model Training

Calculus, especially derivatives, is crucial for optimizing machine learning models. During training, a model needs to minimize a cost function, which measures prediction errors.

Derivatives help calculate the rate of change within these functions.

Through this, models adjust their parameters, aiming to achieve lower errors.

For instance, understanding partial derivatives allows the model to learn how changes in one variable affect the cost function, allowing more precise adjustments.

Model parameters, such as weights, are fine-tuned using these derivatives, which are part of the learning algorithm. The result is more accurate predictions over time.

Backpropagation and Neural Networks

Backpropagation is a critical algorithm in training neural networks. It utilizes calculus to efficiently update model parameters. This involves calculating the gradient of the cost function. Then, this enables the network to adjust its weights.

After a forward pass through the network, errors are propagated backward to update weights using a learning rate. This helps in minimizing errors and improving model accuracy.

The role of matrix calculus is significant here. This is especially true in handling complex networks with multiple layers. By adjusting weights effectively, backpropagation ensures that the neural network learns from data patterns to enhance its predictions. Thus, it is a foundational aspect of training neural networks efficiently in machine learning.

Statistical Concepts in Calculus

Understanding statistical concepts in calculus is crucial for applications in machine learning.

Key areas include the interplay of probability in calculus and the role of statistics in optimization processes. This is particularly as they apply to cost functions in data science.

Probability and Calculus

Probability and calculus are closely linked in many statistical applications. Probability distributions often require calculus to determine areas under curves, which represent probabilities. For example, integrals can be used to calculate the cumulative distribution function (CDF) from the probability density function (PDF).

Calculus also helps in understanding changes and trends in probability. These include calculating expectations and variances for random variables. These tools are essential in data science for modeling and predicting outcomes based on given data.

Statistics in Optimization

Optimization in statistics often involves calculus, especially when working with cost functions. Calculating derivatives helps identify minima or maxima of these functions. This guides optimization algorithms to better model performance.

In machine learning, partial derivatives are used to minimize error in predictions through processes like gradient descent. Statistics and calculus together support fine-tuning models. They improve accuracy and reduce computational costs, which are vital in data-driven decision-making processes in fields like data science. Efficient optimization leads to models that are not only accurate but also faster, making them practical for real-world problems.

Software and Tools for Machine Learning

A desk with a computer displaying machine learning software and tools. A notebook with partial derivative calculus equations and a calculator

Effective use of software and tools can significantly enhance a machine learning project. Popular programming languages and specialized libraries support tasks ranging from data handling to implementing complex neural networks.

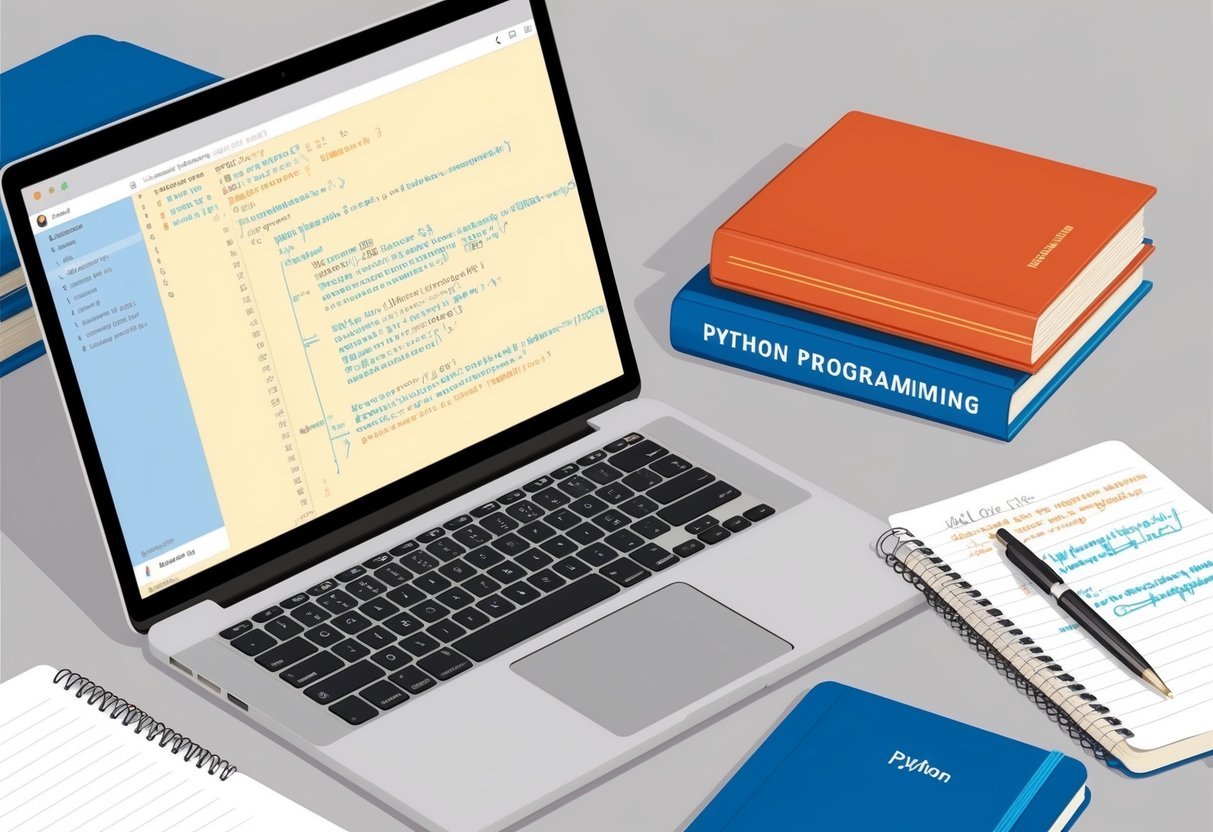
Programming with Python

Python is a versatile language favored in data science and computer science due to its readability and wide range of applications.

It offers dynamic typing and a vast ecosystem of libraries, making it suitable for machine learning tasks. Tools like Jupyter Notebook allow programmers to write, test, and visualize code interactively. This environment supports iteration on data analysis and model development, which is crucial in machine learning.

Its integration with libraries such as NumPy and SciPy further simplifies mathematical computations, including partial derivative calculus.

Machine Learning Libraries

Key libraries like TensorFlow and PyTorch provide robust frameworks for building and training machine learning models.

TensorFlow enables scalable computation, suitable for deploying large models in production. It supports various platforms, making it ideal for both research and application.

PyTorch is known for its flexibility and ease of use, especially in research environments. Its dynamic computation graph allows for modifications on-the-fly, which aids in debugging and experimentation.

These libraries come with pre-built modules to handle standard tasks like data loading, model training, and optimization. This streamlines the development process and allows efficient execution of complex techniques.

Practical Applications and Case Studies

Partial derivative calculus is central in machine learning for optimizing algorithms and improving performance. It is essential in solving real-world optimization problems and utilized in gradient-based learning techniques.

Real-world Optimization Problems

Partial derivatives play a key role in addressing real-world optimization challenges. They help refine machine learning algorithms by determining the rate of change concerning each feature.

In fields like economics and engineering, they assist in maximizing efficiency and outputs.

Partial derivatives are instrumental in constructing partial differential equations for modeling and predicting outcomes in complex systems. They also enable iterative processes to adjust parameters, ensuring solutions are precise.

The use of these derivatives enhances decision-making, from resource allocation to process optimization.

Case Studies of Gradient-Based Learning

Gradient-based learning methods, such as gradient descent, rely heavily on partial derivatives. This technique adjusts model parameters to minimize a loss function, crucial for training machine learning models.

For instance, in neural networks, adjustments are made per layer to enhance prediction accuracy.

Courses like deeplearning.ai’s specialization teach efficient data processing using these concepts.

In practice, neural networks employ partial derivatives to fine-tune weights, leading to improved model performance. This systematic approach underlies significant breakthroughs in artificial intelligence, enabling machines to learn from data effectively.

Complex Calculus Techniques in AI

Complex calculus techniques are essential in AI for tasks like optimizing models and understanding complex functions. Key methods include the chain rule for calculating derivatives and matrices like the Jacobian and Hessian for deeper analysis.

Chain Rule and its Applications

The chain rule is vital in AI for finding derivatives of composite functions. It helps backpropagation in neural networks by efficiently calculating gradients, which are crucial for learning.

This method allows AI models to update weights correctly during training.

For example, when a neural network’s output depends on layers of functions, the chain rule enables the computation of derivatives layer by layer. Consequently, each layer’s gradient is multiplied, allowing precise updates using gradient descent.

Automatic differentiation often leverages the chain rule to handle complex functions without manual computation.

Jacobian and Hessian in AI

The Jacobian matrix and Hessian matrix are crucial in AI for analyzing and optimizing models.

The Jacobian represents the derivative of a vector-valued function and provides insights into how changes in input affect the output of a neural network.

In optimization problems, the Hessian matrix helps evaluate the curvature of the error surface. It supports second-order optimization methods, offering better convergence than first-order methods.

The Hessian is particularly useful for finding minima or maxima in functions by examining the change in gradients.

These matrices are used in various AI applications, from modeling to solving complex differential equations. This includes the study of systems dynamics in fields like physics, chemistry, and economics.

Advancing Machine Learning with Calculus

Calculus plays a pivotal role in the development of machine learning algorithms by addressing complex mathematical challenges. Understanding how calculus integrates into these models highlights its importance in the field. This section delves into specific aspects, such as leveraging calculus for algorithm improvements and exploring future trends in AI techniques.

From Calculus to Machine Learning Algorithms

Calculus provides the foundation for machine learning algorithms by enabling precise adjustments and optimizations.

Partial derivatives are essential for calculating gradients, which guide the optimization processes in models like neural networks. By finding these gradients, algorithms can more efficiently minimize errors and enhance predictive accuracy.

Linear transformations are another key aspect. They help in understanding how inputs change as they pass through a network.

Additionally, the concept of determinants is crucial for calculating matrix inverses, which are often needed in algorithm design and implementation. These mathematical tools, derived from calculus, are indispensable in refining algorithms to process data effectively and make accurate predictions.

Future Trends in AI Techniques

Emerging trends in AI suggest a broader integration of advanced calculus concepts.

Techniques like fractional calculus are gaining attention for their potential to address limitations in traditional models. They offer new ways to handle diverse data patterns and dynamic systems, aligning with the evolving demands in computer science and data science.

As more complex systems arise, the role of calculus in AI is expected to expand. Machine learning models might incorporate more sophisticated mathematical structures to tackle intricate problems.

This evolution not only promises increased computational power but also enhances the ability to solve real-world challenges. The interplay between AI and calculus will likely continue to be a dynamic and transformative force in technology.

Frequently Asked Questions

Partial derivatives are key in machine learning for optimizing models and enhancing neural network performance. Concepts like gradient descent and vector calculus are crucial for developing effective algorithms.

How do partial derivatives facilitate optimization in machine learning models?

Partial derivatives help measure how a function changes as each variable changes. In machine learning, this allows for adjustments that minimize error and improve model accuracy. They are vital in determining which direction to move during optimization.

What is the role of gradient descent in training neural networks?

Gradient descent is an optimization algorithm used to minimize the loss function. By computing the gradient of the loss, which involves partial derivatives, the algorithm iteratively updates weights to find the optimal model parameters.

Why is understanding vector calculus important in machine learning algorithms?

Vector calculus provides tools for analyzing vector fields and functions. It is essential for comprehending how different inputs interact within machine learning models, especially when dealing with high-dimensional data or multiple variables.

How do gradients and partial derivatives differ, and what is their significance in machine learning?

The gradient is a vector containing all partial derivatives of a function. While partial derivatives consider one variable at a time, the gradient provides a multi-variable direction for optimization. In machine learning, gradients are used to update model parameters efficiently.

Which concepts in calculus are essential for understanding machine learning algorithms?

Key calculus concepts include derivatives, integrals, and partial derivatives. Partial derivatives are particularly important for functions involving multiple variables, often encountered in machine learning models.

How does calculus, particularly partial derivatives, apply to improving neural network performance?

Calculus, especially through partial derivatives, is used to adjust neural network weights for better performance. By calculating and applying these derivatives, models can learn from data. This helps reduce the error in predictions and enhance overall accuracy.

Categories
Uncategorized

Learning About Python Object Oriented Programming: A Comprehensive Introduction

Understanding the Basics of OOP

Python’s object-oriented programming (OOP) is a programming paradigm centered around objects. It organizes code by grouping related data and functions, enhancing program structure and readability.

By using objects, programmers can make their code more modular and reusable.

Defining Object-Oriented Programming

Object-oriented programming is a style of coding that uses objects to represent data and methods. An object is an entity with attributes (data) and methods (functions).

For instance, a car object might have data like color and model, and methods such as drive() and stop().

In Python, classes are templates for creating objects. Together, objects and classes make programs easier to manage and scale. This approach brings more flexibility and efficiency in developing applications, making it a popular choice for many programmers.

OOP Principles: Encapsulation, Abstraction, Inheritance, Polymorphism

There are four main principles in OOP: encapsulation, abstraction, inheritance, and polymorphism.

  • Encapsulation: This involves keeping an object’s data private, accessible only through public methods. It prevents unwanted changes and enhances security.

  • Abstraction: It is about hiding complex implementation details while showing only the necessary features. This simplification helps in managing large programs.

  • Inheritance: A subclass inherits attributes and methods from a parent class, allowing code reuse. For example, a sedan class may inherit from a more general car class.

  • Polymorphism: It allows objects to be treated as instances of a parent class. The same method can behave differently depending on the object, providing flexibility in code design.

Comparing OOP with Other Programming Paradigms

OOP differs from other paradigms like procedural programming and functional programming.

  • In procedural programming, the focus is on writing procedures or functions that operate on data. It is linear and straightforward but can become complex as the program grows.

  • Functional programming is centered around using functions as first-class citizens and avoiding shared state. It contrasts with OOP by prioritizing immutability and pure functions.

In contrast, OOP builds on the concept of objects, promoting modularity and code reuse. Understanding these paradigms can help developers choose the best approach for their specific project needs.

Fundamentals of Classes and Objects in Python

Python’s object-oriented programming (OOP) allows developers to model real-world entities using classes and objects. This approach is essential for creating complex applications by bundling data and functionality. Understanding classes and objects in Python is foundational for mastering OOP techniques.

The Class Keyword and Its Purpose

In Python, a class is defined using the class keyword. This keyword serves as a blueprint for creating individual instances, known as objects. Classes encapsulate data in the form of attributes and define behaviors through methods.

The syntax for defining a class is straightforward: class ClassName: followed by an indented block of code. This block typically includes the initializer method __init__(), which sets up initial values for the object’s attributes.

Creating Objects from Classes

Once a class is defined, objects can be created. In Python, an object is an instance of a class, meaning it represents a specific example of the blueprint.

Creating an object is as simple as calling the class as if it were a function, for example, my_object = MyClass().

Each object contains unique attribute values, allowing it to maintain its state. By leveraging the class, these objects can perform specific actions through their methods. This illustrates how the blueprint of a class translates into functional, usable entities.

Understanding Class and Instance Attributes

Attributes in a class are properties that help define the state of an object. There are two main types: class attributes and instance attributes.

Class attributes are shared across all instances of a class, meaning any change to them affects every instance. They are defined directly within the class block but outside any methods.

Instance attributes, on the other hand, are unique to each object. These are typically defined within the __init__() method and are accessed using the self keyword.

The distinction between these attributes is crucial for understanding how data is managed and manipulated within an OOP structure.

Working with Methods and Behaviors

Methods in Python are functions that belong to an object, and they define the behaviors of an object. There are different types of methods, like instance methods, constructors, and class methods, each serving a specific role in object-oriented programming. Understanding these will help create more organized and efficient code.

Instance Methods and the self Parameter

Instance methods are functions defined inside a class and are used to define actions for the objects of that class. They require an instance of the class to be called and use the self parameter.

The self parameter is a reference to the current instance of the class, allowing access to its attributes and other methods.

For example, in a class Dog, an instance method might be bark(), which enables an object of this class to perform this behavior.

The self parameter helps in accessing or modifying the object’s properties and is always passed automatically when calling an instance method on an object.

Defining Constructors with init()

A constructor in Python is typically defined using the __init__() method. It initializes a new object’s state, setting initial attribute values when an instance is created. This method is automatically called when a new instance of a class is initialized.

For instance, consider a class Car where the __init__() method could initialize attributes like make, model, and year.

By defining these attributes through the constructor, each instance of Car holds specific data relevant to its creation. This ensures that objects are carefully initialized with necessary attributes before they are used.

Class Methods and Static Methods

Class methods are defined with the decorator @classmethod and take cls as the first parameter instead of self. This allows them to access class variables and modify class state, rather than instance state. They pertain to the class as a whole.

Static methods, defined with the @staticmethod decorator, do not access class or instance data. They belong to a class but can be called on instances as well.

These methods are useful for utility functions that do not need to access or modify the class state.

Understanding these different methods allows one to design flexible and reusable class structures, promoting better programming practices in Python object-oriented programming.

Delving into Inheritance and Polymorphism

Inheritance and polymorphism are key concepts in object-oriented programming. They enable code reuse and flexibility, allowing developers to create applications that are both manageable and adaptable. These concepts involve relationships between classes and how methods can operate differently on various objects.

Understanding Class Inheritance

Class inheritance allows a new class, known as the derived class, to inherit attributes and methods from another class, the base class. This relationship helps to reduce code duplication and enhance design clarity.

By defining common behaviors in the base class, developers ensure that derived classes only need to implement specific differences.

For example, in Python, class inheritance is as simple as defining a new class and passing the base class as a parameter. Here’s a basic example:

class Animal:
    def speak(self):
        print("Animal speaks")

class Dog(Animal):
    def bark(self):
        print("Dog barks")

This allows Dog to use methods from Animal as well as its own.

Implementing Polymorphism in Python

Polymorphism enables methods to operate differently based on the object type it is invoked on. This flexibility is achieved by allowing a common interface for different underlying forms. For instance, a single method can act on different object types.

Consider the speak method used across different derived classes:

class Cat(Animal):
    def speak(self):
        print("Meow")

class Dog(Animal):
    def speak(self):
        print("Woof")

def animal_sound(animal):
    animal.speak()

In this example, animal_sound can call speak on both Cat and Dog, but each will produce distinct outputs. This concept is fundamental for scalable and clean code.

The Role of the super() Function

The super() function is used to call a method from the base class in a derived class. It is essential for maintaining the behavior of the base class while extending it in the derived class.

This function provides access to inherited methods without directly naming the base class, making changes easy and minimizing errors.

In practice, super() is employed like this:

class Puppy(Dog):
    def speak(self):
        super().speak()
        print("Puppy yaps")

In the Puppy class, super().speak() calls the speak method of Dog, enabling the method to execute additional code without losing the original method’s functionality. This keeps the base class method intact while allowing enhancement.

Exploring Encapsulation and Data Hiding

Encapsulation is a key concept in object-oriented programming (OOP) that helps protect data and maintain code integrity. It involves bundling data with the methods that interact with the data, and limiting access to certain parts of an object.

Protecting Data with Encapsulation

Encapsulation bundles the data and operations on the data into one unit, often found as classes in OOP. This helps in managing code complexity and ensuring the integrity of data.

By controlling access, encapsulation prevents unwanted interference and misuse from outside the class.

Data hiding is a crucial part of encapsulation. It restricts access to certain components of an object, which keeps sensitive data safe.

Public methods act as controlled gateways that manage how others in the program interact with an object’s data.

This approach not only safeguards the data but also allows for changes within the class without affecting external code.

Such protection through encapsulation encourages modular programming and enhances code maintenance.

Private vs Public Attributes

Attributes in a class can be either public or private, affecting how they can be accessed.

Public attributes are accessible to everyone, while private attributes are restricted to within the class itself. In Python, private attributes are prefixed with an underscore (e.g., _attribute).

Private attributes are a form of data hiding, which allows classes to control how these attributes are accessed and modified. This control is vital for maintaining a class’s invariant, ensuring that objects remain in a consistent state as they are used.

Through encapsulation, classes expose only what is necessary via public attributes and methods. This separation between public and private elements fosters better security and helps in building robust applications. Learn more about encapsulation in Python from GeeksforGeeks.

Advanced Concepts in Python OOP

Advanced Python object-oriented programming (OOP) involves powerful features like dunder methods, decorators, and the SOLID principles. These concepts enhance code flexibility, readability, and design, allowing for more efficient and scalable programming.

Dunder Methods and Their Importance

Dunder methods, also known as magic methods, are special functions in Python that start and end with double underscores (e.g., __init__, __str__). These methods enable developers to define custom behavior for various operations like initialization, representation, and comparison of objects.

For instance, __init__ is used to initialize object state, while __str__ provides a human-readable representation of the object.

Implementing method __eq__ allows for custom equality checks, crucial for object comparison.

Through magic methods, Python objects can integrate seamlessly with language features, leading to intuitive class designs and more maintainable code. Understanding and using these methods efficiently can greatly enhance a programmer’s ability to create dynamic and user-friendly applications.

Using Decorators and Properties for Data Access

Decorators in Python are powerful tools that allow wrapping a function or method to alter behavior, adding functionality without changing the actual code. They are used frequently for logging, validation, and access control.

Properties offer a way to handle data encapsulation, giving control over class attributes access.

Using the @property decorator, a method can be turned into a read-only attribute. This prevents direct access to a value, enforcing rules whenever a user tries to retrieve or modify it.

These tools provide a clean approach to handling complex interactions in code. They are essential for maintaining data abstraction, encouraging more structured and protective patterns in managing program state and behaviors.

SOLID Principles in Python

SOLID is a set of five design principles that guide developers in creating robust and scalable software. They are:

  1. Single Responsibility Principle: Each class should have only one responsibility.
  2. Open/Closed Principle: Classes should be open for extension but closed for modification.
  3. Liskov Substitution Principle: Objects should be replaceable by their subtypes without affecting the program.
  4. Interface Segregation Principle: No client should be forced to depend on methods it does not use.
  5. Dependency Inversion Principle: High-level modules should not depend on low-level modules.

Implementing these principles in Python helps developers build flexible and easy-to-maintain systems, encouraging code stability and reducing risks of errors. Understanding these principles is vital for any advanced Python developer aiming for high-quality software solutions.

Implementing Special Structures: Data Classes

Data classes in Python provide an efficient way to handle large or complex data structures. They reduce boilerplate code by automatically generating special methods like __init__, __repr__, and __eq__. This feature makes it easier for developers to build data-driven applications.

Understanding Data Classes

Data classes are a feature in Python introduced with version 3.7, designed to simplify the process of creating classes for storing data. Instead of writing repetitive code, such as initializers and basic operations, data classes offer a blueprint that automates these tasks.

A data class requires the @dataclass decorator from the dataclasses module. By using this, the Python interpreter automatically generates the __init__, __repr__, and __eq__ methods based on the class attributes defined.

This automation reduces the need for boilerplate code, enhancing productivity and making the codebase cleaner and easier to read.

The use of data classes is especially beneficial in scenarios involving multiple attributes or complex nested data structures. They provide a clear, efficient means for handling objects with an emphasis on data preservation and manipulation.

Simplifying Data Structures with Data Classes

Data classes streamline the process of defining and managing structured data by focusing on simplicity and functionality. They allow the quick creation of data containers without extensive coding. This is particularly useful in data science and applications that manage large datasets.

For instance, creating a data class involves minimal syntax. Define class attributes as type-annotated fields, and the data class will automatically manage them. This approach eliminates manual coding of several standard methods.

Furthermore, data classes support additional features like default values for fields, immutability with frozen=True, and field metadata. These options enhance flexibility and adaptability, allowing developers to cater to varied data processing needs. This makes data classes a powerful tool for creating efficient, maintainable code.

Design Patterns and Architecture in Python OOP

In Python Object-Oriented Programming (OOP), design patterns and architecture play crucial roles. Design patterns provide standardized solutions for common problems, while architecture pertains to the bigger structure of scalable applications.

Common Design Patterns in OOP

Design patterns are essential tools that aid developers in solving frequent problems in software design. They simplify the development process by providing tried and tested solutions. The Gang of Four book is a well-known resource that includes many such patterns, such as Singleton, Factory, and Observer.

The Singleton pattern ensures a class has only one instance, while the Factory pattern creates objects without specifying exact classes. The Observer pattern aids in managing the state between objects.

Each pattern has a unique purpose and is selected based on specific needs. For practical examples, check out design patterns in Python.

Architectural Considerations for OOP

Architecture in OOP is crucial for developing scalable applications. It defines high-level structures and helps manage complex systems.

Using patterns like the Model-View-Controller (MVC) can separate concerns and enhance the adaptability of the application.

Scalability is achieved through thoughtful planning and employing principles like SOLID, which helps maintain strong architecture. The SOLID principles guide developers towards designing systems that are easy to maintain, extend, and understand.

Emphasizing modular design is key, as it allows individual components to be scaled or modified independently, thus making the system more robust and flexible.

Comparative Study of OOP Across Languages

Object-oriented programming (OOP) is a key feature in many programming languages, offering different implementations and benefits. Java and Python offer distinct OOP features, while C++ provides low-level control with advanced OOP concepts. JavaScript interprets OOP in a flexible manner, supporting both traditional and modern programming styles.

OOP in Java vs. Python

Java and Python are both popular languages that support OOP, but they do so in different ways. Java is a statically typed language, which means types are checked at compile time. This ensures that errors are caught early, though it may also require more code to define types and variables. In contrast, Python is dynamically typed, allowing more flexibility and less verbose code.

Java enforces strict OOP principles, where everything is encapsulated within classes and objects. This can lead to more structured and predictable code. Python, being a multi-paradigm language, supports OOP but is not restricted to it. This can make Python easier for quick scripting and encourages rapid development without extensive boilerplate code.

Understanding these differences helps developers choose the right tool for a project, balancing flexibility and strictness depending on task requirements.

Similarities and Differences with C++

C++ is known for allowing both procedural and object-oriented programming. It provides powerful features like multiple inheritance and operator overloading, which are not available in Java or Python. This flexibility lets developers write high-performance applications but also requires careful management of resources.

Unlike Java, which uses garbage collection, C++ requires manual memory management. This gives programmers more control over performance but increases complexity. Python simplifies memory management automatically, reducing the chance of memory leaks experienced in C++.

Both Java and C++ use strict data typing, whereas Python is more flexible with its dynamic typing. These distinctions make C++ more suitable for systems programming, while Python and Java often serve higher-level applications.

Interpreting OOP Concepts in JavaScript

JavaScript treats OOP differently from traditional class-based languages. It primarily employs prototype-based inheritance, where objects can inherit directly from other objects. This allows for more dynamic and flexible behavior.

Traditional class syntax was introduced in ECMAScript 6, which offers a more familiar structure for those accustomed to Java and C++. Despite this, the underlying prototype-based system remains.

JavaScript’s loose typing contrasts with Java’s stricter type checks, appealing to developers who prefer flexibility. This versatility makes JavaScript well-suited for web development, where rapid iteration is often essential.

In choosing between these languages, understanding their OOP implementations helps in selecting the best fit for given development needs.

Real-world Applications and Case Studies

Object-Oriented Programming (OOP) in Python has broad applications, influencing system designs and providing concrete examples of use cases. This section explores how OOP translates into practical system designs and examines specific case studies that bring concepts like the animal or dog class to life, showing how abstract ideas become useful real-world solutions.

OOP in System Design

OOP is essential in many system designs, especially for applications requiring complex, scalable frameworks. By using classes and objects, developers can model real-world entities, such as a dog class for an application managing animals. Each dog can have properties like breed and age, demonstrating encapsulation.

Using inheritance, a base animal class can share common traits across different species, while polymorphism allows for specific behaviors—like different sounds animals make.

Such design helps in creating modular and maintainable code, enhancing functionality and adapting to changes without overhauling the entire system. The object-based approach ensures that systems can evolve efficiently, supporting future growth and shifting requirements.

Case Studies: From Conceptual to Concrete

Real-world applications of OOP use classes to handle dynamic scenarios. Consider an e-commerce platform where a product class can adapt to various product types. Each object can store data like price, description, and quantity. This flexibility is crucial for managing diverse inventories.

In another example, a graphics program might use a circle class to generate and manipulate shapes. Properties like radius or color can change, showcasing class usage in artistic fields.

Through these cases, concepts like abstraction and encapsulation prove indispensable, transforming mere ideas into practical solutions. Each case highlights how OOP facilitates real-world problem-solving, making programming more intuitive and aligned with human reasoning.

Evaluating OOP through Performance and Maintainability

A computer displaying code for Python Object Oriented Programming, with performance and maintainability metrics shown

Object-Oriented Programming (OOP) can influence an application’s performance and ease of maintenance. By focusing on how well OOP manages system resources and aids in keeping the codebase clean, developers can make informed decisions about their project structure.

OOP’s Impact on Application Performance

OOP can impact the speed of an application, positively or negatively. By organizing code into classes and objects, OOP can enhance readability and reduce complexity. This can lead to easier optimization. However, it might also introduce overhead from features like dynamic dispatch.

For certain applications, such as those running on limited resources, this could become a bottleneck.

A study on procedural vs. OOP performance details aspects to consider. These include memory usage and execution time. Understanding these factors helps developers optimize code when choosing between OOP and alternative paradigms.

Maintainability and Code Quality

OOP facilitates maintainability through encapsulation, inheritance, and polymorphism. These features keep code modular, allowing for easier updates and changes.

By grouping data and behaviors, OOP promotes clean and organized code. This structure aids in refactoring efforts and testing.

Readable and maintainable code is crucial for long-term projects where different developers work on the same codebase. High cohesion within classes and low coupling between them ensures changes can be made safely with minimal side effects, thus enhancing maintainability.

Professional Growth with Python OOP

A laptop displaying Python code on OOP, surrounded by books on programming and a notebook with handwritten notes

Advancing in the field of Python Object-Oriented Programming (OOP) can significantly boost career opportunities. Certifications ground one’s expertise, while a well-crafted LinkedIn profile can effectively showcase these skills to potential employers.

Certifications and Learning Paths

Obtaining a certificate of completion from a recognized institution can demonstrate a solid grasp of Python OOP principles. Many platforms offer structured learning paths, combining various courses and projects to build comprehensive skills.

Through a mix of theory and practical application, these paths ensure learners can tackle real-world programming challenges.

Courses on platforms like Coursera cover key concepts, such as inheritance and encapsulation. These courses often provide practical exercises and labs, reinforcing learning through application.

Earning certificates from such platforms can significantly enhance a candidate’s resume, showcasing their commitment to professional development.

Presenting Your OOP Skills on Your LinkedIn Profile

A polished LinkedIn profile can help professionals highlight their Python OOP skills. Adding completed certifications and relevant coursework in the ‘Licenses & Certifications’ section can make the profile stand out to recruiters.

It helps to list specific projects, detailing roles and contributions in Python OOP. Additionally, using the ‘Featured’ section to share links to projects or articles on sites like GitHub or personal blogs can showcase skills in action.

The profile summary should briefly articulate Python expertise and enthusiasm for programming. Such a strategic presentation can increase visibility and attract opportunities for career advancement.

Frequently Asked Questions

A stack of books on Python OOP with a computer and notebook

Learning about object-oriented programming (OOP) in Python raises various questions, especially for beginners. These questions cover the core principles, recommended resources, and practical implementation of OOP concepts like polymorphism and inheritance.

What are the core principles of object-oriented programming in Python?

Python’s OOP is based on four main principles: encapsulation, inheritance, polymorphism, and abstraction. Encapsulation bundles data and methods into single units called objects.

Inheritance allows classes to inherit features from other classes, while polymorphism lets methods do different things based on the object calling them. Abstraction simplifies complex systems by modeling classes based on essential qualities.

How can one start learning about object-oriented programming in Python as a beginner?

Beginners should start by learning basic Python syntax and concepts. Then, they can follow tutorials and online courses that focus on using Python’s OOP features.

Understanding examples, practicing coding, and building small projects help reinforce learning. Websites like Real Python offer materials that explain how to use OOP effectively.

What are some recommended books or resources for understanding object-oriented programming in Python?

Books such as “Python Crash Course” by Eric Matthes and “Learning Python” by Mark Lutz are popular choices. Online resources like Real Python’s OOP guide also provide detailed explanations and examples.

These materials help deepen knowledge of OOP concepts in Python.

How can polymorphism and inheritance be implemented in Python?

Polymorphism in Python is achieved by defining methods in different classes with the same name. Inheritance is implemented by creating a class that inherits attributes and methods from a parent class.

For a hands-on approach, exploring courses like Coursera’s Inheritance and Encapsulation can be beneficial.

Are there any comprehensive cheat sheets or quick guides summarizing Python OOP concepts?

There are many cheat sheets available online that summarize Python OOP concepts quickly and clearly. These guides offer concise definitions, code examples, and comparisons to help understand OOP’s main principles.

Searching for Python OOP cheat sheets usually yields several useful resources.

How much time is typically required to become proficient in Python’s object-oriented programming features?

The time needed to become proficient varies depending on prior programming experience. For beginners, dedicating a few hours a week over several months can build a solid foundation.

Consistent practice and exposure to different problems enhance understanding and proficiency.

Categories
Uncategorized

Learning about Linear Regression – Mastering Ordinary Least Squares Techniques

Fundamentals of Ordinary Least Squares (OLS)

Ordinary Least Squares (OLS) is a key technique in linear regression that helps estimate the linear relationship between variables.

Its primary goal is minimizing the differences between observed and predicted values, ensuring the best fit line for data.

Understanding the OLS Method

Ordinary Least Squares is a statistical method used to estimate the coefficients in a linear regression model.

It works by minimizing the sum of the squared residuals, which are the differences between observed values and the values predicted by the model. This process results in a line that best fits the available data.

OLS assumes linearity, meaning the relationship between the dependent variable and each independent variable is linear.

Additionally, it requires that errors, or residuals, are normally distributed and have constant variance. These assumptions are crucial for ensuring accurate and reliable results.

If these conditions are met, OLS provides unbiased and efficient estimates of the coefficients, allowing for meaningful interpretation and predictions.

The Heart of Linear Regression

At the core of linear regression, OLS determines how changes in independent variables affect the dependent variable.

By calculating the equation of a straight line, OLS finds the optimal fit by adjusting the coefficients. These coefficients quantify the effect each independent variable has on the dependent variable, helping to understand how different factors contribute to variations in the outcome.

The resulting regression line reveals patterns and trends within data while highlighting the strength of the relationship between variables.

Practically, this means making accurate forecasts and data-driven decisions becomes possible across various domains, from economics to biology.

The effectiveness of OLS hinges on proper application and adherence to its assumptions, ensuring robust and applicable findings in real-world scenarios.

Key Concepts and Terminology

Understanding linear regression involves grasping a few essential concepts. These include the roles of dependent and independent variables, as well as the function of coefficients and intercept in predicting outcomes.

Defining Dependent and Independent Variables

In a linear regression model, the dependent variable represents the outcome or the variable we aim to predict. It is typically denoted as ( y ).

The independent variables, on the other hand, are the predictors or inputs. They are often represented as ( x_1, x_2, ldots, x_n ), and affect the dependent variable. These variables can be manipulated to see how changes impact the dependent variable, making them crucial for model accuracy.

In practical terms, if one wanted to predict house prices (dependent variable), features such as location, size, and number of rooms are independent variables. By analyzing how these inputs affect price, more accurate predictions can be made.

Exploring Coefficients and Intercept

Coefficients in a linear regression model measure the relationship between each independent variable and the dependent variable.

These values tell us how much the dependent variable is expected to change when the independent variable changes by one unit.

The intercept represents the constant term in the equation. It indicates the expected value of the dependent variable when all independent variables are zero.

In the equation ( y = b_0 + b_1x_1 + b_2x_2 + ldots + b_nx_n ), ( b_0 ) is the intercept, and ( b_1, b_2, ldots, b_n ) are the coefficients.

These elements form the crux of the regression equation, revealing insights about data relationships. Proper estimation and interpretation are key to model success, impacting the predictions generated by the regression analysis.

Assumptions Behind OLS

Ordinary Least Squares (OLS) regression relies on several key assumptions to produce reliable estimates. Key assumptions include linearity, independence, homoscedasticity, and normality. Violating these assumptions can lead to biased results or inefficient estimates.

Linearity and Independence

The assumption of linearity means that the relationship between the independent variables and the dependent variable should be linear. This implies that changes in the independent variable are associated with proportional changes in the dependent variable.

It’s essential to check for linearity since non-linear relationships can lead to incorrect model predictions.

Independence is another critical assumption. Observations should be independent of each other—meaning that the outcome of one observation does not affect another.

Independence helps ensure that the sample provides a true picture of the population. Dependence between observations can result in unreliable estimates and increase the chance of Type I or Type II errors.

Homoscedasticity and Normality

Homoscedasticity refers to the constant variance of residuals, or errors, across all levels of the independent variable.

In OLS, it’s crucial that the spread of these errors remains consistent as different independent variable values are encountered. If the model shows signs of heteroscedasticity, or non-constant variance, it may affect the accuracy of coefficient estimates and predictions.

Normality assumes that the residuals of the model are normally distributed. This condition is important for hypothesis testing and estimating confidence intervals.

If residuals do not follow a normal distribution, it might suggest the need for data transformation or the use of alternative estimation methods. This assumption is particularly vital when conducting t-tests or deriving statistical inference from the model.

Building the Regression Model

Creating a regression model involves specifying the model and determining the best-fit line that suits the data. The process includes choosing the right variables and methods to find the best parameters that satisfy the linearity assumption.

Model Specification and Selection

Selecting the right model is crucial in building a regression model. This step involves deciding which variables to include as predictors and ensuring that they effectively capture the relationship with the dependent variable.

It’s essential to check the linearity assumption to ensure that a straight line can approximate the data accurately. Researchers often assess various models, comparing them using criteria like R-squared, AIC, and BIC to determine the best fit.

The chosen model should minimize the error between observed and predicted values. This trade-off between simplicity and accuracy is key to model selection.

Calculating the Best-Fit Line

Once the model specification is complete, the next step is calculating the best-fit line.

This involves using techniques like Ordinary Least Squares (OLS) regression to estimate the model parameters.

OLS minimizes the sum of squared differences between observed and predicted values, ensuring the line is as close as possible to the data points.

By finding the optimal slope and intercept, the regression model aligns well with the data trends. Calculating these parameters accurately is important, as they indicate the strength and direction of the relationship. A precise best-fitting line helps make reliable predictions and draw meaningful insights from the data.

Regression Analysis and Interpretation

Regression analysis is a powerful tool in statistics, used to understand the relationship between variables. Key components include the sum of squared residuals and R-squared values, which help in interpreting how well a model fits the data.

Investigating the Sum of Squared Residuals

The sum of squared residuals (SSR) is a measure of how well a regression line fits a set of data points. It calculates the total squared differences between the observed values and the values predicted by the model.

A lower SSR indicates a better fit, as it suggests that the data points are closer to the regression line.

In regression analysis, minimizing the SSR is crucial because it helps find the best-fitting line through the data. The Ordinary Least Squares (OLS) method specifically focuses on this by aiming to make the SSR as low as possible.

Analysts can assess model accuracy by examining the SSR, with lower values indicating more reliable predictions.

Residuals are vital in checking if assumptions of linear regression are met. If they show non-random patterns, it may indicate issues such as non-linearity or heteroscedasticity.

Understanding R-Squared and Adjusted R-Squared

R-squared is a statistical measure that indicates how much of the variance in the dependent variable can be explained by the independent variables in the model.

It ranges from 0 to 1, where a higher value signifies a better fit of the model to the data.

While R-squared gives an idea of fit, it may be misleading when adding more variables to the model. This is where adjusted R-squared becomes useful.

It adjusts the R-squared value for the number of predictors, providing a more accurate measure when multiple independent variables are involved.

Adjusted R-squared is essential when comparing models with different numbers of predictors. It can help prevent overfitting by showing whether additional variables improve the model’s performance significantly or not.

OLS Estimation Techniques

Ordinary Least Squares (OLS) estimation is a method used to find the best-fitting line in linear regression analysis. The aim is to minimize the differences between observed values and estimated values. Two primary techniques for implementing OLS include using the Statsmodels library in Python and understanding the role of gradient descent.

Utilizing Statsmodels and Python

Statsmodels is a powerful Python library that simplifies statistical modeling.

It offers a user-friendly interface for conducting OLS estimations. By incorporating Statsmodels, users can easily estimate OLS coefficients with functions like OLS() and fit().

Statsmodels also provides summary tables that display these estimators and additional statistics. These tables include R-squared values, coefficients, and standard errors, making them an essential tool for analysts.

Here’s a brief example of how OLS estimation works in Statsmodels:

import statsmodels.api as sm

X = sm.add_constant(X)  # Adds a constant term to the predictors
model = sm.OLS(y, X).fit()
print(model.summary())

In this way, Statsmodels streamlines the process of performing OLS regression, enhancing clarity and accuracy. Python as a programming language supports versatile analytical processes, making it crucial for data scientists and statisticians.

The Role of Gradient Descent

Gradient descent is an optimization algorithm that iteratively adjusts model parameters to find the minimum value of a cost function.

In the context of OLS, this method can help refine model estimators when datasets are large or complex.

While traditional OLS directly calculates coefficients, gradient descent offers an alternative approach useful for machine learning models. It updates coefficients by taking small steps proportional to the gradient of the cost function.

Here is how the gradient descent algorithm typically functions:

  1. Initialize coefficients randomly.
  2. Compute the gradient of the cost function.
  3. Adjust the coefficients in the opposite direction of the gradient.
  4. Iteratively repeat until convergence.

This approach is especially valuable when dealing with large datasets or when computational efficiency is a priority. Gradient descent ensures precision and scalability while complementing the robust framework of linear regression analysis.

Challenges in OLS

Ordinary Least Squares (OLS) is a common method for estimating linear relationships. Challenges such as multicollinearity and outliers can impact model accuracy. These challenges require careful identification and handling to ensure reliable results.

Detecting Multicollinearity

Multicollinearity occurs when independent variables in a regression model are highly correlated. This can lead to unreliable coefficient estimates and inflate the variance.

One common way to detect multicollinearity is by calculating the Variance Inflation Factor (VIF). If the VIF value exceeds 10, it typically indicates a problem with multicollinearity.

Another method is examining the correlation matrix of the predictors. High correlation between two variables can hint at multicollinearity.

When multicollinearity is present, it becomes hard to determine the effect of each predictor on the dependent variable. One solution is to remove or combine correlated variables to improve model stability.

Addressing Outliers and Leverage Points

Outliers are data points that do not fit the trend observed in the rest of the data. Leverage points have an extreme value in an independent variable that can unduly influence the model’s estimates. Identifying influential points is crucial as they can distort the regression results.

One method to address outliers is to use graphical tools such as scatter plots to visualize data patterns.

Additionally, statistical tests can confirm the presence of outliers.

Robust regression techniques like L1 regression can help minimize the impact of outliers.

For leverage points, examining diagnostic plots such as Cook’s distance can be effective.

Removing or adjusting these points ensures more accurate and reliable regression results.

Properly managing outliers and leverage points helps maintain the integrity of OLS-based models.

Advanced OLS Concepts

Ordinary Least Squares (OLS) can be expanded into more advanced techniques. These include using weighted least squares to handle heteroscedasticity and employing regularization methods like lasso regression to improve model performance and interpretability.

Exploring Weighted Least Squares

Weighted Least Squares (WLS) is useful when the assumption of constant variance in errors, known as homoscedasticity, is violated. In such cases, variance in the data increases with some predictors.

WLS assigns different weights to data points during regression, accounting for varying reliability. This technique adjusts the loss function to minimize the mean squared error of the weighted errors.

By doing so, WLS can provide more efficient and unbiased estimates compared to traditional OLS.

Implementing WLS involves selecting appropriate weights for each data point, often inversely related to the variance of each observation.

This method ensures that OLS gives more emphasis to points with lower variance, thus stabilizing the variance and improving model accuracy.

Therefore, WLS is especially beneficial for data exhibiting heteroscedasticity.

Regularization with Lasso Regression

Lasso Regression introduces a penalty to the OLS model to prevent overfitting and enhance interpretability. The technique adds a regularization term to the loss function, encouraging the model to reduce complexity by driving some coefficients to zero. This exclusion of less important features simplifies the model while maintaining prediction accuracy.

Lasso modifies the traditional mean squared error criterion by including an absolute value penalty of the coefficients.

Mathematically, the objective is to minimize this penalized loss function, allowing the model to handle multicollinearity.

While similar to other regularization methods, lasso excels in situations where many predictor variables hardly contribute to the desired outcome.

Selecting important features becomes straightforward, making models easier to interpret and improving generalization to new data.

Practical Applications of OLS

Ordinary Least Squares (OLS) is widely used in several fields to analyze relationships between variables. It helps in understanding complex data patterns and predicting future trends, which is crucial in both finance and public services like healthcare and education.

In Finance and Econometrics

In the world of finance, OLS is an essential tool for evaluating asset pricing models and understanding market behavior. Analysts use OLS to estimate the returns and risks of various financial assets. Using historical data, it enables predicting stock prices, bond yields, and foreign exchange rates.

In econometrics, OLS is used to study economic relationships and forecast economic variables. It helps in determining the impact of factors like interest rates and inflation on economic growth.

Economists rely on OLS to model and test hypotheses about economic theories and to improve policy making.

Applications in Healthcare and Education

In healthcare, OLS models can identify patterns in patient data to improve treatment outcomes. Researchers use it to examine the effects of different variables like age, lifestyle, and medical history on health conditions.

This helps in making data-driven decisions about patient care and medical interventions.

In education, educators use OLS to analyze student performance data. It helps in identifying factors that influence academic success such as class size, teaching methods, and socio-economic status.

By assessing these variables, schools can design more effective education strategies and policies to improve learning outcomes.

Evaluating Model Performance

A person studying a graph with a linear regression line, surrounded by equations and statistical data

Evaluating the performance of a linear regression model involves analyzing residuals and enhancing predictive abilities. Residual analysis and diagnostics help identify issues in model assumptions, while improving predictive power focuses on refining the model for better accuracy.

Residual Analysis and Diagnostics

Residuals are the differences between observed and predicted values in a dataset. Examining these residuals is crucial to check if a model’s assumptions hold true.

Residual analysis involves plotting residuals to see if they are randomly scattered, which indicates that the model assumptions are appropriate.

If patterns or structures appear in the residuals, this might suggest problems with model specification, such as missing variables or incorrect functional forms.

Diagnostics often include checking for normality of residuals, heteroscedasticity (non-constant variability), and autocorrelation (dependency between residuals).

Residual plots, such as scatter plots of residuals versus fitted values, are helpful tools. Histogram and Q-Q plots can further diagnose normality.

Addressing these diagnostic outcomes ensures that the model provides a reliable foundation for decision-making.

Improving Predictive Power

To improve a model’s predictive power, one should focus on refining model features and selecting appropriate variables.

Ensuring correct model specification involves including relevant predictor variables and interaction terms. Feature scaling and transforming non-linear relationships can also enhance predictive accuracy.

Another method to boost predictive power is through training-validation splitting. By separating data into training and validation sets, one can ensure the model generalizes well to new data.

Cross-validation is another technique that helps in assessing model consistency.

Regularization methods like Ridge or Lasso regression can prevent overfitting by penalizing complex models.

This balance helps in maintaining both simplicity and effectiveness in predictions.

Adjusting these aspects can notably increase the model’s precision and reliability over varying datasets.

Extending Beyond OLS

Ordinary Least Squares (OLS) serves as a foundation in linear regression. Exploring techniques like multiple linear regression and dimensionality reduction with Principal Component Analysis (PCA) allows for advanced analysis. These methods handle complex data sets and improve model accuracy.

Introduction to Multiple Linear Regression

Multiple Linear Regression (MLR) is an extension of OLS that considers multiple independent variables instead of just one. This technique is used when the relationship between dependent and independent variables is more complex.

By analyzing how each predictor variable influences the dependent variable, MLR can reveal intricate data patterns.

This method is vital in fields requiring multifactor analysis, such as finance and healthcare. MLR models can manage large amounts of data to provide deeper insights. Also, multicollinearity, where independent variables are correlated, can skew results. Regularization methods like Ridge and Lasso help mitigate this.

Dimensionality Reduction with PCA

Principal Component Analysis (PCA) is a key technique for dimensionality reduction. It simplifies data by transforming it into a set of uncorrelated variables called principal components.

PCA retains significant data variance, allowing for accurate modeling even with reduced dimensions.

This method is useful when dealing with high-dimensional data, such as genomics or image processing. PCA enhances computational efficiency and reduces overfitting by ignoring irrelevant features.

In statistical models, PCA aids in visualizing and interpreting complex datasets, making it easier to identify patterns and trends.

Technological Integration and Future Directions

A futuristic classroom with interactive screens displaying linear regression equations, while students engage in hands-on activities with data sets and graphs

As technology advances, Ordinary Least Squares (OLS) plays a crucial role in analyzing big data and machine learning models. These fields continuously evolve, utilizing OLS for its effectiveness in handling large datasets and capturing data patterns.

OLS in the Era of Big Data

In the age of big data, OLS remains a vital tool for uncovering relationships within large datasets. It helps identify significant variables by minimizing errors between observed and predicted values.

This optimization technique efficiently processes extensive data, offering insights into complex models.

Besides its basic applications, OLS can be integrated with other statistical tools. Combining OLS with techniques like dimensionality reduction improves efficiency and helps deal with the complexities arising from big data.

It enables more precise data analysis, essential for informed decision-making in data science.

Key Benefits:

  • Minimizes prediction errors
  • Works well with large datasets
  • Enhances model accuracy with integrated techniques

Machine Learning and OLS

In machine learning, OLS serves as a fundamental stepping stone for algorithm development. It’s particularly useful for linear models, providing a foundation for more advanced methods.

By minimizing squared errors, it ensures the predictive models align closely with actual data points.

OLS also supports deep learning models, aiding in training processes for neural networks. While not directly used in final models, it assists in understanding basic linear relationships before diving into more complex patterns.

Machine learning often integrates OLS with other techniques like regularization, which helps prevent overfitting by introducing penalties for larger coefficients.

This blend strengthens model performance, making OLS indispensable in developing machine learning strategies.

Frequently Asked Questions

A person at a desk studying a graph with a linear regression line, surrounded by books and notes

Ordinary Least Squares (OLS) is a central method in regression analysis, helping to derive the relationship between variables. It offers insights into estimation techniques and assumptions critical to its application. Various fields utilize OLS, demonstrating its broad relevance and versatility.

How is Ordinary Least Squares (OLS) utilized in regression analysis?

Ordinary Least Squares (OLS) is primarily used to estimate the parameters of a linear regression model. It works by minimizing the sum of squared residuals, which are the differences between observed and predicted values. This method yields a line that best fits the data.

Can you explain the difference between OLS and general linear regression?

OLS is a specific type of linear regression focused on minimizing squared differences. General linear regression can include additional variables and methods, such as those addressing distributions of errors or incorporating non-linear relationships.

While OLS is a basic approach, linear regression includes more complex variations.

What are the fundamental assumptions underlying the OLS method?

The OLS method relies on several assumptions: linearity, independence, homoscedasticity, and normality of the residuals. These assumptions ensure that the estimates are unbiased and consistent.

Violations of these assumptions might lead to inaccurate results.

How do you derive the OLS estimator formula?

The OLS estimator formula is derived through calculus and matrix algebra. It represents a mathematical approach to finding the parameter estimates that minimize the sum of squared differences between observed and predicted values.

The derivation process involves differentiating and solving for the coefficients.

What is the principle behind the OLS method in econometrics?

In econometrics, OLS helps quantify relationships among variables. It is used to infer causal relationships and predict outcomes by analyzing data from observations.

Economists often employ OLS to model and understand economic phenomena.

What are some practical examples where OLS regression is applied?

OLS regression is applied in various fields like economics, finance, and social sciences.

Examples include predicting housing prices, analyzing economic growth factors, and studying consumer behavior.

The method is widely used for its simplicity and effectiveness in modeling real-world data.

Categories
Uncategorized

Learning Linear Algebra for Data Science – Eigendecomposition Explained for Practitioners

Foundations of Linear Algebra for Data Science

Linear algebra forms a crucial part of data science. It offers tools for representing data and operations efficiently, providing a foundation for machine learning algorithms.

Importance of Vectors and Matrices

Vectors and matrices are central in linear algebra and data science.

A vector, often represented as a list of numbers, describes quantities that have both magnitude and direction. In data science, vectors represent data points, with each element of the vector representing a feature.

Matrices are grid-like structures that organize numbers in rows and columns. They are used to transform linear equations and data sets into a form that can be manipulated easily.

For example, performing matrix multiplication can apply transformations such as rotations and scaling to data sets. Understanding these structures allows data scientists to manage and analyze data efficiently.

Understanding Linear Transformations

Linear transformations involve mapping data from one vector space to another using matrices. These transformations include translations, rotations, and scaling, critical for various algorithms in data science.

By applying transformations, data can be positioned into a more usable form, making machine learning processes like classification or regression possible.

Linear transformations help simplify complex data by maintaining the operations that define the structure of vector spaces. They play a vital role when analyzing large data sets, allowing data scientists to model real-world scenarios with greater precision. Understanding these transformations enables effective data manipulation and is essential in many applications within the field.

Key Concepts of Eigendecomposition

Eigendecomposition is a fundamental concept in linear algebra that simplifies complex matrix operations. By breaking down matrices into eigenvalues and eigenvectors, it reveals important properties and behaviors in mathematical modeling and analysis.

Defining Eigenvalues and Eigenvectors

Eigenvalues and eigenvectors are at the heart of eigendecomposition. An eigenvalue is a scalar that indicates how much the direction of an eigenvector is stretched or compressed during a linear transformation. An eigenvector is a non-zero vector that remains parallel to its original direction even after transformation.

The relationship between a matrix A, an eigenvector v, and an eigenvalue λ is expressed as: A * v = λ * v. This equation suggests that applying the matrix A to v scales the vector without changing its direction. Understanding these components is crucial for tasks such as data analysis and machine learning, where matrix transformations play a vital role.

The Characteristic Equation in Eigendecomposition

The characteristic equation is an essential tool in finding eigenvalues. Given a square matrix A, the characteristic equation is derived from det(A – λI) = 0, where I is the identity matrix.

Solving this equation yields the eigenvalues of the matrix.

The roots of the characteristic equation, known as eigenvalues, help determine how transformations affect vector spaces. These insights are crucial in applications like Principal Component Analysis, where dimensionality reduction is required. By grasping the concept of the characteristic equation, learners can better understand the dynamics of linear transformations and their applications in data science.

Practical Applications of Eigendecomposition in Data Science

Eigendecomposition is a crucial technique in data science that helps with a variety of tasks, especially in understanding and simplifying complex data. Two primary areas where eigendecomposition is extensively applied are reducing the dimensionality of data and enhancing the effectiveness of machine learning models.

Facilitating Dimensionality Reduction

Dimensionality reduction is a key step in data preprocessing that helps make data easier to visualize and analyze.

Eigendecomposition plays a significant role by breaking down data matrices to reveal key patterns. This process involves identifying eigenvectors and eigenvalues, which can simplify a dataset while maintaining its core information.

Principal Component Analysis (PCA) is a common method for dimensionality reduction that relies on eigendecomposition. By transforming data into principal components, PCA captures the most important variance in the data, making it simpler to interpret.

This is especially useful in handling large datasets with many variables, making analysis more efficient.

For example, PCA helps in image processing by reducing noise and compressing data, which speeds up further processing. In this way, eigendecomposition allows data scientists to focus on the most relevant features without getting bogged down by unnecessary details.

Improving Machine Learning Algorithms

Machine learning algorithms benefit greatly from the use of eigendecomposition, especially in enhancing model accuracy and computational efficiency.

Eigendecomposition helps improve techniques like support vector machines (SVM) and clustering by transforming data into a more manageable format.

In clustering, for instance, eigendecomposition aids in understanding the structure of data clusters, helping algorithms to perform better. The features extracted through eigendecomposition can lead to better classification and prediction results.

Moreover, in neural networks, eigendecomposition is used to optimize weight matrices, leading to faster convergence during training. As a result, models become more robust and accurate. These enhancements make machine learning solutions more effective, highlighting the importance of eigendecomposition in data science.

Diving Into Principal Component Analysis (PCA)

Principal Component Analysis (PCA) is a technique used in data science to simplify datasets by transforming them into principal components. It helps in reducing dimensionality while retaining most of the data’s variance, making it valuable for both data compression and exploratory analysis.

PCA and Data Compression

In data science, PCA is crucial for data compression. It reduces the number of variables in a dataset without losing important information.

By identifying the directions known as principal components, PCA captures the maximum variance in the data. This transformation leads to a smaller set of variables, often with minimal loss of information.

Compression through PCA is highly beneficial in fields such as image and signal processing, where large data volumes can be problematic.

Through this technique, PCA transforms the original data into a few uncorrelated variables that store most of the essential information. The first few components usually explain a large portion of the variance, which makes it easier to handle and analyze.

PCA is particularly useful for reducing storage needs and speeding up data processing tasks.

Exploratory Data Analysis with PCA

PCA is also a powerful tool for exploratory data analysis. It helps data scientists visualize complex data by projecting it into a lower-dimensional space.

This can reveal patterns, trends, and outliers that are not apparent in higher dimensions. For instance, when dealing with datasets involving numerous features, PCA simplifies the data to just two or three dimensions for easy visualization.

Furthermore, PCA helps identify relationships between variables by reducing noise and focusing on the most significant data aspects. This can make it easier to interpret data and design machine learning models.

The reduction in dimensions does not only simplify datasets but also enhances model performance by minimizing overfitting and improving generalization to new data.

Understanding Matrix Operations and Decompositions

Matrix operations and decompositions are key concepts in linear algebra, playing a vital role in simplifying complex mathematical problems. Key methods include eigendecomposition and singular value decomposition, both of which break down matrices into simpler, more manageable parts.

Operations Integral to Eigendecomposition

Eigendecomposition involves breaking a matrix into its eigenvectors and eigenvalues. This decomposition allows for simpler analysis and manipulation of matrices in various applications.

Eigenvectors are vectors that do not change direction during a transformation, and eigenvalues scale them.

To perform eigendecomposition, calculate the eigenvalues as roots of the characteristic polynomial. Once eigenvalues are identified, corresponding eigenvectors are determined.

These eigenvectors form a matrix, often denoted as P, while eigenvalues create a diagonal matrix, D. The relationship can be expressed as A = PDP⁻¹, where A is the original matrix.

Comparison of Eigendecomposition and Singular Value Decomposition

Although similar, eigendecomposition and singular value decomposition (SVD) have distinct purposes.

SVD applies to any matrix, regardless of being square or not, making it versatile. It decomposes a matrix into three other matrices: U, Σ, and Vᵀ, where U and V are orthogonal, and Σ is diagonal with singular values.

Eigendecomposition, on the other hand, is specific to square matrices. It provides insight into matrix properties and transformations.

In comparing SVD and eigendecomposition, SVD excels in handling non-square matrices and is often used in data reduction and noise reduction. Eigendecomposition is favored for matrices where eigenvalues and eigenvectors directly provide useful information.

The Role of Linear Algebra in Machine Learning

Linear algebra is the backbone of many machine learning techniques. It helps by simplifying complex calculations and enhancing data interpretations, making it an essential tool for data scientists and engineers.

Using Algebraic Methods for Feature Extraction

Linear algebra techniques like singular value decomposition (SVD) and principal component analysis (PCA) are pivotal in feature extraction.

PCA, for instance, is a technique that reduces the dimensions of data by transforming it into a set of linearly uncorrelated variables called principal components. This helps in highlighting the most important features of the data while discarding noise.

SVD also finds widespread use in these processes. It’s particularly valuable for making sense of large matrices by breaking them into smaller, manageable ones.

This decomposition aids in compressing and simplifying datasets, which is crucial for enhancing computational efficiency. By distilling data into its fundamental components, linear algebra not only makes machine learning tasks faster but also more accurate.

Algebraic Intuition in Machine Learning Algorithms

Linear algebra gives deep insights into understanding and developing machine learning algorithms.

Neural networks, for example, rely heavily on operations involving matrices and vectors. The weight matrices and input data vectors undergo multiple algebraic transformations, which is foundational to the network’s learning process.

Support vector machines (SVMs) also use linear algebra concepts like dot products and matrices to separate classes with a hyperplane in high-dimensional spaces. Such operations allow algorithms to predict outcomes effectively.

By using algebraic principles, machine learning models optimize learning, enabling precise and efficient predictions. Insights gained from linear algebra thus empower developers, helping to enhance their models and tackle diverse data challenges.

Leveraging Python for Linear Algebra Computations

Python is a powerful tool for handling linear algebra tasks, thanks to its robust libraries. Numpy stands out for efficient operations on arrays and matrices, while eigenvalue algorithms simplify tasks like eigendecomposition.

Utilizing Numpy for Efficient Computations

Numpy is widely recognized for its efficiency in linear algebra computations. It provides tools to work with vectors and matrices, essential for data science tasks.

Using functions like numpy.dot() or numpy.matmul(), users can perform matrix multiplication easily. The library also supports operations such as solving linear equations and finding determinants with numpy.linalg.solve() and numpy.linalg.det(), respectively.

With its focus on speed and efficiency, Numpy makes it feasible to handle large-scale data. It abstracts complex mathematical operations, allowing users to focus on problem-solving rather than computational details.

The library’s seamless integration with other Python libraries enhances its utility in various data science and machine learning projects.

Implementing Algorithms for Eigendecomposition

Eigendecomposition involves breaking down matrices into their eigenvalues and eigenvectors, a critical operation in many scientific fields.

Within Python, Numpy’s numpy.linalg.eig() function facilitates the decomposition of square matrices. This function returns a tuple containing arrays of eigenvalues and their corresponding eigenvectors.

These eigenvalues and vectors are essential in tasks such as dimensionality reduction. They are often used in machine learning and principal component analysis (PCA).

Efficient algorithms within libraries like Numpy enable users to compute these values rapidly, handling both real and complex matrices.

Python’s user-friendly syntax and powerful library support make it an excellent choice for implementing such algorithms. It simplifies advanced mathematical computations for users.

Geometric Interpretation of Eigendecomposition

Eigendecomposition is a method in linear algebra providing insight into the structure of linear transformations. It helps to explain how movements and changes in vector spaces can be understood visually and mathematically.

Visualizing Vector Spaces and Transformations

Eigendecomposition involves breaking down matrices into their eigenvectors and eigenvalues, which represent directions and scaling factors in the space.

In a geometric sense, eigenvectors indicate directions that remain unchanged during transformation, while eigenvalues indicate how much those directions stretch or shrink.

When you apply eigendecomposition, it’s like discovering a matrix’s secret basis that reveals how it twists and turns space.

In linear transformations, certain vectors might rotate or scale, but eigenvectors maintain their direction, providing a clear picture of these transformations.

Understanding the Geometric Implications of PCA

Principal Component Analysis (PCA) uses eigendecomposition to reduce the dimensionality of data. This technique helps in identifying the principal components, which are the directions of maximum variance in the data.

By focusing on these key directions, PCA simplifies complex datasets, making it easier to visualize and interpret high-dimensional data.

In PCA, the covariance matrix is decomposed into its eigenvectors and eigenvalues. Here, eigenvectors represent the axes of the new feature space, and eigenvalues reflect the importance of each axis.

This geometric understanding aids data scientists in recognizing key patterns and structures in data, enhancing both analysis and decision-making processes.

Mathematical and Statistical Principles in Data Science

Understanding the mathematical and statistical principles within data science involves exploring concepts such as covariance matrices and dimensionality reduction. These ideas play a key role in transforming complex data into understandable insights.

Relating Covariance Matrices to Eigenproblems

A covariance matrix is a fundamental tool in data analysis, capturing how variables in a dataset vary in relation to each other. It’s essential for understanding data spread and correlation.

When dealing with multidimensional data, it’s often helpful to find directions in which the data has the most variance.

This is where eigenproblems come in. By solving them, particularly through eigendecomposition, the principal components of a dataset can be identified.

These components are directions that capture the largest variance, and are found using eigenvectors and eigenvalues from the covariance matrix.

Applications such as linear transformations and data projections heavily rely on these principles. They help in simplifying datasets while maintaining their essential characteristics. Identifying these directions aids in understanding the intrinsic geometry of the data.

Statistical Foundations for Dimensionality Reduction

Dimensionality reduction aims to reduce the number of variables under consideration and can improve data processing efficiency. It is crucial in dealing with high-dimensional data, which is often computationally demanding.

Statistics offer several methods for this, including Principal Component Analysis (PCA), which uses the principles of covariance matrices.

PCA is a technique that transforms the data into a new coordinate system. The greatest variance by any projection of the data lies on the first coordinate (called the principal component), the second greatest variance on the second coordinate, and so on.

This method enables effective data simplification and visualization.

Dimensionality reduction allows for efficient storage and analysis while minimizing the risk of overfitting. Techniques like these are foundational in data science, providing tools to handle and interpret massive datasets effectively. They are indispensable in scenarios ranging from image processing to predictive modeling.

Advanced Topics in Linear Algebra for Data Science

Understanding advanced topics in linear algebra is crucial for applying these concepts in data science. This section explores diagonal matrices, orthogonality, and the role of basis vectors, fundamental elements enhancing data analysis techniques.

Exploring Diagonal Matrix and Orthogonality

Diagonal matrices are a special type of square matrix where non-diagonal elements are zero. This simplicity makes them easy to compute, particularly in operations like matrix multiplication or finding the inverse.

They are often used in eigendecomposition, simplifying complex calculations in machine learning algorithms.

Orthogonality refers to the fact that two vectors are orthogonal if their dot product is zero.

In data science, this concept is vital because orthogonal vectors form the basis for defining independent features, reducing redundancy in data.

Orthogonal matrices, having orthonormal rows and columns, preserve vector lengths and angles, aiding in transformations and data rotation.

The Significance of Basis Vectors

Basis vectors are a set of vectors in a vector space that are linearly independent and span the space. They are essential because any vector in the space can be expressed as a linear combination of the basis vectors.

In data science, understanding basis vectors helps in techniques like principal component analysis (PCA), which reduces data dimensions while preserving variance.

A clear choice of basis vectors can simplify complex data sets, making analysis more efficient. They provide a framework for understanding how different features influence data and model outcomes. This understanding is critical in making informed decisions about data transformations and model interpretations.

Frequently Asked Questions

This section addresses the role of eigendecomposition in data science, its applications in machine learning algorithms, and the importance of certain linear algebra concepts for data scientists’ tasks. Discover how these mathematical tools are used to enhance data models and everyday operations.

What are the practical applications of eigenvectors and eigenvalues in data science?

Eigenvectors and eigenvalues are essential for data simplification. They help in reducing data dimensions, making complex datasets easier to analyze.

They are widely used in techniques like Principal Component Analysis (PCA) to identify patterns and trends in large datasets.

What are the best resources for understanding linear algebra in the context of data science?

Online platforms such as DataCamp offer tutorials on eigenvectors and eigenvalues, providing key insights relevant to data science.

Books and in-depth courses that focus on the application of linear algebra in machine learning can also be helpful.

How is eigendecomposition applied in machine learning algorithms?

Eigendecomposition plays a crucial role in algorithms that require data transformation or compression. It helps in breaking down matrices into simpler forms, which enhances the algorithm’s efficiency in processing data, such as in the Singular Value Decomposition (SVD).

Why is understanding the eigendecomposition crucial for improving data models?

Eigendecomposition provides insights into the properties of matrices, which are central in modeling relationships between variables.

By understanding these properties, data scientists can refine models to better capture underlying data patterns and improve predictive accuracy.

Which concepts in linear algebra are most essential for proficiency in data science?

Key concepts include matrices, vectors, eigenvalues, eigenvectors, and matrix decompositions like eigendecomposition.

Mastery of these allows for effective manipulation and interpretation of data, crucial for designing algorithms used in machine learning and data analysis.

How can learning linear algebra benefit a data scientist in their everyday tasks?

Proficiency in linear algebra aids in performing complex data transformations. It also enhances data visualization and optimization tasks. Data scientists use these skills daily to build and refine predictive models. This ensures their outcomes are precise and reliable.

Categories
Uncategorized

Learning about SQL Flattening Data with PIVOT: A Comprehensive Guide

Understanding SQL and Its Role in Data Analysis

SQL, or Structured Query Language, is a fundamental tool for those working in data analysis. It allows data analysts to manage and query data stored in relational databases with precision and efficiency.

SQL is essential for retrieving data. Data analysts and data scientists frequently use SQL to extract the necessary information from large datasets.

The ability to filter and sort data sets SQL apart as a powerful tool.

Data analysis involves various tasks like grouping and aggregating data. SQL makes these tasks easier by providing functions like GROUP BY and AGGREGATE, which help analysts find trends and patterns.

These functions simplify managing large volumes of data.

One of the common uses of SQL in analysis is data manipulation. Through SQL commands, data analysts can insert, update, and delete data. This flexibility is vital for maintaining accurate and updated databases.

SQL is also adept at dealing with multiple tables. Analysts can join tables together, merging data from different sources, which is crucial for comprehensive analysis. This capability is a key reason why SQL remains a staple in the data analysis field.

Learning SQL empowers data professionals with skills that are applicable in various contexts. As data volumes grow and diversify, having a solid SQL foundation remains incredibly valuable. Its role in structured data manipulation cannot be overstated. The adaptability and efficiency offered by SQL make it indispensable for effective data analysis.

Introduction to the Pivot Operation

In database management, a pivot operation is a technique used for transforming data to create a new structure. This method helps in reorganizing and summarizing data efficiently, making complex datasets more accessible and easier to analyze.

The pivot operator is commonly utilized in SQL databases to convert table rows into columns. This transformation allows users to view data from different angles, making it particularly useful in reporting and data analysis. For example, sales data for multiple products can be presented in a more readable way by displaying months as column headers.

Pivot functions in SQL are versatile tools that support operations across various platforms. They enable analysts to perform aggregations on datasets, grouping data by categories to highlight trends and patterns. This capability makes pivots a powerful feature for anyone dealing with large and complex datasets.

Using the pivot operator, users can perform important data transformations, such as creating cross-tabulations. This transformation enhances the readability of data, letting users view information in structured formats. Analysts frequently employ pivots in scenarios requiring quick insights and adaptable data presentations.

A data transformation with pivots involves selecting key columns to rotate, which changes the display format of the dataset. This process can optimize data visualization and helps users derive insights rapidly. Platforms like SQL Server and Oracle offer built-in support for pivot functions, making it easier for analysts to manipulate and explore data without extensive programming.

Essential Syntax of Pivot

The SQL PIVOT feature is used to transform data from rows into columns. This capability is particularly useful when summarizing information for reporting and data analysis.

A basic PIVOT operation requires a few key components:

  • Source Table: The table containing the original data.
  • Pivot Column: The column whose unique values will become the new columns.
  • Value Column: The column whose data will be used in the new columns.
  • Aggregate Function: A function like SUM(), COUNT(), or AVG() to perform calculations on the value column.

Here’s a simple example of the PIVOT syntax:

SELECT [column_list]
FROM [source_table]
PIVOT (
  [aggregate_function]([value_column])
  FOR [pivot_column] IN ([new_column_1], [new_column_2], ...)
) AS [alias_name];

This statement helps to create pivot tables, which offer a more structured view of the data. The result is a new table format that can be more intuitive to read and analyze.

When using the SQL Server PIVOT operator, it is crucial to correctly identify the necessary components in your dataset. Properly structuring the syntax is essential to generate meaningful insights from the data.

Aggregation Functions in SQL

Aggregation functions in SQL are essential tools for transforming and summarizing data sets. They help in counting entries, calculating totals, finding averages, and more. These functions are critical when working with databases to derive meaningful insights from large amounts of data.

Summing Data with SUM

The SUM function is used to add up all the values in a column. It’s perfect when calculating totals, like sales, expenses, or any numerical data. This function can handle both simple and complex queries, making it versatile in summing large data sets.

For example, in a sales database, you might use SUM to calculate total sales for a specific period. This aggregation function helps identify trends by comparing totals across different time frames or categories. It’s crucial for businesses tracking performance and budgeting effectively.

Finding Minimum Values with MIN

The MIN function returns the smallest value from a set of values. It’s useful in various scenarios, such as finding the least expense in budget reports or identifying the smallest measurement in a data set. When querying large databases, MIN provides a straightforward way to locate minimum values without manually scanning all entries.

Using MIN, a business can determine the lowest price of a product over time. This is essential for competitive analysis and pricing strategy development. By discovering the smallest values, companies can make informed decisions on pricing adjustments.

Using AVG for Average Calculation

AVG calculates the average of a set of values. It’s useful for analyzing trends and making sense of large data sets. When monitoring performance metrics like average sales, response times, or scores, AVG provides a clear picture of trends without the noise of peaks and troughs.

For instance, educators might use AVG to evaluate students’ average scores over a term. Businesses can leverage this function to gain insights into average sales or customer reviews, allowing them to enhance their strategies based on comprehensive data analysis.

Counting Unique Values with COUNT

COUNT is used to determine the number of entries in a database, including rows that match specific conditions. It helps in assessing the volume of data entries, such as the number of customers, sales transactions, or unique products.

When paired with unique constraints, COUNT can isolate distinct values. For example, finding how many distinct customers have made purchases over a period. Businesses can use this information to understand customer reach and engagement, which aids in developing targeted marketing strategies. Using the SQL COUNT function effectively allows businesses to manage data efficiently, supporting informed decision-making.

Flattening Data Using PIVOT

The PIVOT function in SQL is a powerful tool for transforming rows into columns. This technique is useful when there’s a need to restructure data for better readability or specific reporting purposes. By converting row-based data into a columnar format, users can simplify complex datasets.

To use PIVOT, it’s crucial to know the columns that need transformation. The process involves specifying which values will move from rows to columns. You can learn more about the basics of using SQL PIVOT in this step-by-step tutorial.

When dealing with different datasets, PIVOT helps in data manipulation by organizing data into a clearer format. It allows for easier aggregation and data analysis. For instance, if a table lists sales by date, PIVOT can transform this to show total sales by month, enhancing quick insights.

Using PIVOT often involves a static approach where the columns must be known beforehand. This is common when the dataset has a defined structure. If not, some might use dynamic SQL to cater to variable column names. An example of such usage can be seen with specific cases involving schemaId.

Examples of PIVOT include rearranging vehicle data to show Year, Make, and Model for each entry. This ensures that datasets with up to two vehicles get aligned correctly, with missing data marked as NULL for easier interpretation. Further examples and SQL code snippets are available here.

Advanced PIVOT Techniques

Multiple data tables merging into one, columns transforming into rows, and SQL queries running in the background

Understanding how to effectively use advanced PIVOT techniques can transform complex queries into streamlined solutions. These strategies can manage dynamic data and handle large datasets efficiently, enhancing the utility of SQL in data analysis.

Exploring Dynamic SQL with PIVOT

Dynamic SQL is crucial when dealing with unpredictable datasets. It allows the creation of flexible queries that can adapt to varying data structures. The PIVOT function, when combined with dynamic SQL, enables users to handle columns that change frequently.

By incorporating placeholders and loops, dynamic SQL can construct queries that adjust to the available data. This approach is particularly useful in creating reports where column headers need to adapt based on the data. For example, a sales report might require adjustments based on fluctuating product lines. The integration of dynamic SQL with PIVOT ensures that queries remain efficient and relevant as datasets evolve.

Handling Large Datasets in Pivot Tables

Managing large datasets in pivot tables can be challenging, but with the right techniques, it becomes manageable. Optimizing performance starts with indexing key columns to speed up data retrieval. Proper indexing reduces the time taken to execute the pivot operation, which is essential when dealing with voluminous data.

Another important aspect is filtering data before applying the PIVOT operation. Pre-filtering reduces the number of rows processed, which can significantly improve performance. Consider using SQL functions like WHERE and GROUP BY to limit data scope before the transformation process. Distinctive grouping can also help in summarizing data effectively, making large datasets more manageable within a pivot table.

Handling Data Aggregation Levels

Multiple data sets merging into one with SQL PIVOT, creating a flattened, aggregated view

Understanding how to handle data aggregation levels is important when using SQL’s PIVOT function. Aggregation helps in summarizing data, making it easier to spot patterns and trends.

In SQL, aggregation functions like SUM, AVG, COUNT, and others can be applied to combine data at different levels. This makes the data more useful for analysis. By applying these functions, one can convert detailed data into summary tables that provide a clearer view of the data patterns.

Using PIVOT, users can transform rows into columns to highlight the aggregated data at desired levels. For example, one can pivot sales data to show the total sales for each product category over different months. This approach helps in comparing performance across various periods or categories.

With hierarchical data, it is crucial to maintain consistent levels of aggregation. For instance, in a normalized hierarchy table, each level might represent a different department or team. Each level must be carefully aggregated to provide an accurate summary without losing important details.

By managing these aggregation levels, analysts can perform more effective data analysis. This allows them to understand complex datasets better and make informed decisions based on clear evidence. Applying these techniques can also improve the readability and usability of reports, making them more impactful in organizational settings.

Reporting and Analysis with Pivot Tables

A person analyzing data on a computer using pivot tables and learning about SQL

Pivot tables are a powerful tool for data analysis and reporting. They allow users to transform rows into columns, which helps in presenting complex data clearly.

By using pivot tables, businesses can gain a structured view of data, such as sales figures or customer demographics.

In the realm of reporting, pivot tables are invaluable. They enable users to highlight key metrics like revenue and identify trends without manually sorting through endless rows of data. This makes it easier to create detailed and precise reports that stakeholders can rely on.

Users can employ pivot tables for various types of analysis. For instance, by summarizing sales data, a company can quickly identify the most profitable product categories. This insight is crucial for making informed business decisions.

The flexibility to update and change the fields in pivot tables ensures that data remains relevant.

Pivot tables also enhance the visualization of data. Users can produce clear and concise charts and graphs, aiding in a better understanding of complicated datasets.

Tools like Microsoft Excel and Google Sheets offer straightforward methods to create these tables, making them accessible to many users.

Advanced users can employ SQL to create dynamic pivot tables for more complex datasets. In SQL Server, the PIVOT operator transforms data, offering a structured format ideal for in-depth analysis. This allows users to efficiently handle large volumes of data without losing context or meaning.

Generating Complex Queries with UNION SELECT

A computer screen displaying SQL code with multiple queries and data manipulation functions

Creating complex SQL queries can help merge data from multiple sources. The UNION SELECT command is a powerful tool to combine results from two or more queries. It brings together data with similar structures, making it easier for users to analyze comprehensive datasets.

One key aspect of using UNION SELECT is ensuring that each query has the same number of columns, and each column should have compatible data types. This alignment is essential for the command to work correctly, enabling seamless data integration.

Here’s a simple example:

SELECT id, name FROM employees
UNION
SELECT id, name FROM managers;

Exploring UNION SELECT helps in generating helpful complex queries by combining data like sales figures from different regions or department summaries. For instance, combining quarterly sales data can offer a better view of annual performance.

In addition to regular usage, UNION SELECT can be combined with other SQL functions like PIVOT for data transformation. This allows users to reshape and display their SQL queries results in a more meaningful format.

Careful planning while constructing queries with UNION SELECT can enhance efficiency and data clarity, providing significant insights for decision-making.

SQL Server-Specific Pivot Features

A table with rows and columns of data being transformed and flattened using SQL pivot features

SQL Server provides a useful feature called PIVOT to transform data. This feature is essential when needing to convert rows into columns, which can make data easier to analyze and compare.

A typical SQL PIVOT query involves selecting the right columns and using aggregation functions. This helps in summarizing data neatly.

SQL PIVOT in SQL Server is particularly useful in generating reports. By reorganizing tables, it allows users to create more accessible views of data, aiding in decision-making processes.

An example of a PIVOT function in SQL Server can be found in resources like Microsoft Learn. Here, users can find practical examples and detailed explanations on how to apply the PIVOT operation effectively.

This tool enables customization of output, allowing developers and data analysts to present information in a format that suits their specific needs. Using PIVOT efficiently can help in handling large datasets, thus saving time and enhancing productivity.

For a more in-depth exploration of best practices, examining resources such as RisingWave can offer valuable insights. These resources provide tips and demonstrations to ensure users can leverage the full potential of the PIVOT function within SQL Server.

Optimizing Queries for Better Performance

A computer screen displaying a complex SQL query with data being transformed using the PIVOT function for better performance

Optimizing SQL queries is crucial, especially when working with large datasets. Poorly written queries can slow down performance and affect data processing.

Using efficient data types, such as integers instead of strings, can significantly reduce data size and speed up processing times.

Indexes are another key aspect. By indexing frequently queried columns, like IDs or foreign keys, search times can decrease, improving query performance.

Another approach is to simplify complex queries. Breaking down a large query into sub-queries or using temporary tables can sometimes increase efficiency. This makes it easier for SQL to process and return results quicker.

Using the PIVOT function effectively requires some strategies for optimization. For instance, when large datasets are involved, it can be useful to optimize pivot tables by using efficient data types and indexing.

Consider the execution plan in SQL Server. By analyzing it, developers can see where queries might be getting stuck or taking longer than expected. It helps identify bottlenecks and provides a chance to refine queries.

Moreover, caching frequently accessed data can reduce the load on the database. This is particularly beneficial when the same datasets are queried regularly. It minimizes data retrieval times and maximizes efficiency.

Best Practices for Data Transformation

A computer screen displaying SQL code for data transformation using PIVOT

When transforming data, it’s crucial to adhere to a set of best practices to ensure clarity and efficiency. Using the SQL PIVOT function can help convert rows into columns, making complex data easier to interpret.

1. Understand Your Data Needs
Before beginning any transformation process, identify what you aim to achieve. This might involve improving how data is presented, making it more accessible and organized.

2. Choose the Right Tools
SQL offers powerful tools like the PIVOT function for rearranging data. Understanding when to use it can significantly enhance data presentation.

3. Optimize for Performance
Efficiency is key in handling large datasets. Ensure that queries are optimized to handle the scale of data, which minimizes computation time and resource use.

4. Maintain Data Integrity
Always verify the integrity of transformed data. Check for accuracy and consistency to avoid any potential errors or misinterpretations.

5. Use Clear Naming Conventions
When applying PIVOTs, use clear and consistent naming conventions for columns to avoid confusion. This makes the data model easier to read and maintain.

By adhering to these practices, data transformation using SQL becomes more effective and manageable. Understanding the best way to utilize tools like PIVOT can lead to improved data insights and decision-making capabilities.

Frequently Asked Questions

A computer screen displaying a webpage with the title "Frequently Asked Questions Learning about SQL Flattening data with PIVOT"

Understanding how to use the PIVOT function in SQL can make data easier to analyze. This involves techniques such as transforming rows into columns, using dynamic SQL queries, and pivoting by date columns.

How can you transform rows into columns using the PIVOT function in SQL?

Transforming rows into columns can be done with the PIVOT function. By selecting an aggregate function and grouping fields appropriately, data can be reshaped into a more readable format. This technique is especially useful for creating reports.

What are the syntax and examples for creating pivot tables in SQL Server?

Creating pivot tables involves specifying a unique column for column headers, choosing values to aggregate, and a base table. Syntax typically includes the PIVOT clause in a SELECT statement, which rearranges the data for easier analysis. For detailed syntax, check the SQL Server PIVOT guide.

How do you use the PIVOT clause with dynamic SQL queries?

Dynamic SQL queries allow flexibility by generating SQL statements dynamically at runtime. Inserting the PIVOT clause in a dynamic SQL query involves building the SQL string using system tables to fetch column names. This is particularly useful when the number of pivot columns is not known in advance.

In what scenarios is it advantageous to flatten data using the PIVOT operator in SQL?

Flattening data with PIVOT is advantageous in reporting scenarios, where data needs to be presented in a tabular format for easier understanding. It is also useful in transforming normalized data structures into a summarized form for quick insights.

What steps are involved in pivoting a table by date column in SQL Server?

To pivot a table by date, select a date column as a pivot key, decide on aggregates, and apply the PIVOT function. Each unique date becomes a column header. This technique is useful for monthly reports or time-based data summaries. Read more about it here.

Can you provide common exercises or challenges to practice SQL PIVOT operations?

Practicing SQL PIVOT operations can be done through exercises that involve converting sales data by region or transforming survey results.

Challenges might include writing dynamic SQL to pivot unknown columns or creating detailed performance reports.

Solving these will enhance understanding of PIVOT functions in practical scenarios.

Categories
Uncategorized

Learning T-SQL – Table Creation Simplified Guide

Understanding T-SQL and SQL Server Basics

Learning T-SQL and SQL Server basics lays the foundation for strong database management skills. Key elements include understanding the differences between SQL and T-SQL and how to use SQL Server Management Studio (SSMS) effectively.

Defining SQL and T-SQL

Structured Query Language (SQL) is the standard language for interacting with databases. It allows users to create, modify, and manage data easily. SQL is crucial for tasks like querying databases, inserting data, and updating records.

Transact-SQL (T-SQL) is an extension of SQL used by SQL Server. It includes additional features such as procedural programming, local variables, and support for functions like IF statements and loops. These enhancements make T-SQL powerful for complex database operations and efficient data management within SQL Server environments.

Understanding both languages is vital. SQL forms the backbone of database manipulation, while T-SQL provides advanced tools for more sophisticated tasks. Learning their differences ensures effective use of SQL Server capabilities.

Exploring SQL Server Management Studio (SSMS)

SQL Server Management Studio (SSMS) is an essential tool for managing SQL Server databases. It offers a user-friendly interface to interact with databases, run queries, and configure database settings.

In SSMS, users can create and modify database objects, execute T-SQL scripts, and perform administrative tasks like backups. Features such as the query editor and graphical tools enhance database management and provide a comprehensive view of SQL Server infrastructure.

SSMS supports T-SQL development and simplifies troubleshooting with debugging capabilities. Its visual designers help users navigate SQL Server environments, making it easier to handle the complexities of database operations. Being familiar with SSMS allows users to harness the full potential of SQL Server, improving productivity and efficiency in daily tasks.

Setting up Your SQL Server Environment

Setting up an SQL Server environment involves creating a new database and deciding on a default schema. These steps are crucial for organizing data and ensuring smooth operations in SQL Server.

Creating a New Database

When creating a new database, the SQL command CREATE DATABASE is used. This command requires a unique database_name as the primary argument. For instance, to create a database named “SalesData,” you would execute CREATE DATABASE SalesData. This command informs SQL Server to allocate space for the new database and establishes default settings.

Once the database is created, it’s important to configure settings such as file locations and sizes. This can be done by specifying options like FILENAME or MAXSIZE. These settings help in managing storage and performance. By organizing files properly, users can optimize database access and maintenance.

Understanding Default Schema

In SQL Server, the default schema is significant when users create new database objects like tables or views. By default, many objects are created within the dbo (database owner) schema if not specified otherwise. This is manageable for many applications, but selecting appropriate schemas is encouraged for complex environments.

Having a defined schema helps categorize objects based on their roles or applications. For example, organizing schema by department (sales, hr, finance) ensures clear data segregation. This approach minimizes conflicts and aids in maintaining a clean database structure, facilitating easier management and security configuration.

Using commands like ALTER USER or CREATE SCHEMA, users can specify or change the default schema, ensuring that new objects integrate appropriately into the existing structure.

Designing Robust Database Tables

Designing robust database tables requires careful planning to ensure data integrity and organizational efficiency. Key aspects of this process include determining the table structure and establishing effective naming conventions, as well as using schemas to efficiently organize data.

Planning Table Structure and Naming Conventions

The table structure is critical to how data is stored and accessed. When creating a database table, defining clear and logical columns is essential. Column names should accurately describe the data they hold, making it easier for others to understand their purpose. Choosing appropriate data types for each column helps maintain data integrity and optimize storage.

Naming conventions play a crucial role in database management. Consistency in naming conventions makes database tables more readable and maintainable. For example, using a standard prefix or suffix for all table names can quickly inform users about the content or nature of each table. Naming conventions should be agreed upon by the team and documented for future reference.

Leveraging Schemas for Organizational Efficiency

Schemas are powerful tools in database design for segmenting and organizing data logically. By using schemas, developers can group related tables together, improving both structure and retrieval times. This organization allows for more efficient data management and can help prevent naming conflicts.

Schemas also provide a means to enforce security and permissions by controlling who can access specific groups of tables. In many systems, schemas are used to separate different modules or features of an application, which simplifies development and maintenance. Designing a thoughtful schema structure from the beginning contributes to a scalable and manageable database architecture.

Fundamentals of Data Types and Columns in T-SQL

In T-SQL, choosing the right data types and defining columns properly ensures efficient database management. It affects how data is stored, accessed, and processed.

Choosing the Right Data Types

Selecting the correct data type is crucial for optimizing storage and performance. Common data types include integers (int), characters (char, varchar), datetime, decimal, and money.

For numeric data, use int for whole numbers or decimal for precise values. Text data can be stored as char for fixed length or varchar for variable length. Datetime is used for date and time values, while money handles financial data.

Consider storage size and application needs. A smaller data type reduces storage space, but ensure it meets data requirements.

Defining Columns and Nullability

Defining columns involves choosing their names and data types. It’s important to set whether a column can hold a null value or not.

A column with null allows missing or unknown data, providing flexibility. When a column is defined as not null, every entry must have a value, ensuring data completeness.

When designing a table, use not null for columns requiring mandatory data. For optional data, null can be used. Understanding column nullability affects data integrity and application logic.

Mastering the CREATE TABLE Statement

Creating tables in SQL involves understanding the syntax and applying constraints to ensure data integrity. It’s important to craft a functional table structure and incorporate necessary elements like constraints and indexes. This ensures the table’s seamless performance and reliability.

Crafting the Basic Create Table Syntax

To start with the SQL CREATE TABLE statement, one must know the essential components involved. A basic CREATE TABLE involves defining the table name, followed by specifying columns and their data types. For example:

CREATE TABLE Employees (
    EmployeeID INT,
    Name VARCHAR(50),
    HireDate DATE
);

This syntax sets up a table named “Employees” with three columns. Each column has a specific data type – INT for EmployeeID, VARCHAR for Name, and DATE for HireDate. By structuring columns correctly, users ensure that data is accurately stored and accessible.

Incorporating Table Constraints and Indexes

In an SQL CREATE TABLE statement, constraints such as PRIMARY KEY, FOREIGN KEY, UNIQUE, and NOT NULL maintain data accuracy and relationships. For example:

CREATE TABLE Employees (
    EmployeeID INT PRIMARY KEY,
    Name VARCHAR(50) NOT NULL,
    DepartmentID INT,
    FOREIGN KEY (DepartmentID) REFERENCES Departments(DepartmentID)
);

This example uses a PRIMARY KEY to uniquely identify each record. A FOREIGN KEY ensures that every DepartmentID matches a valid department entry. Constraints like NOT NULL prevent empty fields, adding data reliability.

Indexes enhance query performance. While they aren’t specified within the CREATE TABLE syntax, planning their inclusion is key. Indexing frequently queried columns decreases data retrieval time, optimizing table functionality.

Implementing Constraints and Keys

In T-SQL, implementing constraints and keys is essential for maintaining data accuracy and consistency within a database. This involves using primary keys to uniquely identify records, and foreign keys to uphold relationships between tables.

Working with Primary Keys

A primary key serves as a unique identifier for each record in a table, ensuring no duplicate rows exist. This key is crucial for database normalization and efficient data retrieval. A primary key constraint combines the NOT NULL and UNIQUE constraints, meaning every value must be unique and not missing.

Tables in T-SQL often utilize an integer datatype for primary keys due to its efficiency. Implementing primary keys not only helps with data integrity but also aids in referential integrity, which connects related tables. Without a unique primary key, maintaining a reliable database structure becomes challenging. Understanding primary keys is fundamental in learning T-SQL.

Ensuring Data Integrity with Foreign Keys and Checks

Foreign keys ensure referential integrity by linking tables and maintaining consistency across related data. When a table uses a foreign key, it references a primary key from another table, establishing a parent-child relationship. This means updates or deletions to the parent data will reflect in the child, maintaining consistent relationships.

The CHECK constraint is another tool used to define rules for the data in a column, such as ensuring a column only accepts positive numbers. Combining these constraints helps preserve data integrity and prevents invalid data from entering the system. They are crucial for anyone learning how to implement constraints and keys effectively in T-SQL.

Inserting and Managing Data

Inserting and managing data in T-SQL involves executing specific commands to handle entries in a database. Understanding how to use the INSERT INTO and UPDATE statements is crucial for effective data management.

Performing INSERT INTO Operations

The INSERT INTO command is essential for adding new records to a table. This statement ensures that data is input directly into specified columns. A typical INSERT INTO operation requires naming the table and listing columns where the data will exist.

Example:

INSERT INTO Employees (Name, Position, Salary) 
VALUES ('John Doe', 'Developer', 70000);

For multiple entries, the query can include several sets of values. Using the SELECT statement is an efficient way to insert data from one table into another. This method copies rows between tables, maintaining structure and relationships.

Example:

INSERT INTO NewEmployees (Name, Position, Salary) 
SELECT Name, Position, Salary FROM OldEmployees;
```### Updating Data with the UPDATE Statement

Updating existing entries in a table uses the `UPDATE` statement. This function changes data within the specified columns. 

It's important to use the `WHERE` clause to target specific records. Without it, all rows get updated, which might lead to errors. 

*Example:*

```sql
UPDATE Employees 
SET Salary = 75000
WHERE Name = 'John Doe';

This statement adjusts the salary only for John Doe’s entry.

To confirm updates, implementing a SELECT statement post-update helps verify that the right adjustments have occurred.

Efficient querying ensures that data integrity remains intact during these operations.

Utilizing SQL Functions and Expressions

T-SQL provides powerful tools for managing data. Key elements such as functions and expressions enhance data handling.

They allow for efficient data manipulation, column definition, and data entry, helping ensure attributes like data types and unique values are correctly implemented.

Leveraging Functions for Data Manipulation

SQL functions play a vital role in manipulating data efficiently. Functions like SYSDATETIME() and CURRENT_TIMESTAMP automatically generate date and time values when rows are inserted. This is helpful in maintaining accurate records without manual input.

Another important function is IDENTITY which generates unique numbers for each row in a table. This is especially useful for primary keys, ensuring that each row can be uniquely identified.

Data types and conversions are essential when working with functions.

Ensuring data is stored with the appropriate data type, SQL conversion functions like CAST or CONVERT can format data as needed. They ensure compatibility and accuracy across databases.

Using Expressions in Data Entry

Expressions in SQL allow for calculated data entry and default values.

For example, a DEFAULT expression can auto-fill a column with a specific value if none is provided. This ensures consistency and complete data sets.

Expressions can also enforce unique values by using unique constraints and conditional logic during data entry. This prevents duplicate data entries, maintaining data integrity across the database.

Column definitions also use expressions to specify data attributes, like NOT NULL to ensure necessary fields are never empty. This improves data completeness and reliability, essential for any robust database system.

Managing Database and Table Permissions

Managing permissions in a database involves determining who can access or modify data. This is important for maintaining security and data integrity.

Assigning roles and understanding who owns the database help in setting clear access controls.

Assigning Roles and Permissions

Assigning roles is crucial for defining access levels within a database. Each role can have specific permissions, such as the ability to read, write, or modify data tables.

Permissions are generally granted using T-SQL commands like GRANT and REVOKE.

Roles: Common roles include admin, user, and viewer. An admin can manage other roles and permissions, while a user might only add or modify existing data. A viewer could only read data without making changes.

Permissions: These must be tailored to each user’s needs. Access can be specified at multiple levels, such as at the database level or in relation to specific tables or schemas.

For example, giving a user permissions to SELECT from a table without allowing INSERT or DELETE.

Understanding Database Ownership

Database ownership determines who has ultimate control over all aspects of a database. The database owner typically has full permissions and usually manages user access and roles.

Ownership is often assigned at the database creation stage and involves responsibilities like maintaining database integrity and security.

Database Owner: An individual or role designated as the owner has unique rights. They can transfer ownership, alter database settings, and override permissions.

Schema Names and Permissions: Schemas group database objects such as tables, views, and functions under a distinct namespace.

By controlling schema permissions, one can organize who accesses specific parts of the database. Using schema names allows for easier management of tables with similar functions across databases, providing clear organization within the database_name and schema_name.

Advanced Table Options in T-SQL

T-SQL allows for advanced table management options that can significantly enhance database operations. In the following sections, you will learn about using temporary tables, transaction processing, and the importance of indexing.

Working with Temporary Tables

Temporary tables play a key role in T-SQL for managing large datasets or intermediate results without altering the original data. They are created in the system database tempdb, making them ideal for short-term operations.

Temporary tables can be defined with the CREATE TABLE statement. The table names typically start with a # to distinguish them.

When using temporary tables, data integrity and isolation must be maintained. They are automatically dropped when the user session ends, reducing the need for manual cleanup. This makes them efficient for testing and debugging.

Temporary tables provide flexibility, allowing changes and experiments without affecting the existing tables. Consider these when managing complex queries or when storing data temporarily is beneficial for the task.

Diving into Transaction Processing and Indexing

Transaction processing is essential in T-SQL for maintaining data consistency and integrity, especially during multiple data operations.

Transactions are initiated using BEGIN TRANSACTION. This ensures that a group of operations is completed successfully or not at all, thanks to COMMIT or ROLLBACK commands.

Indexing in T-SQL allows faster retrieval of rows in a table by creating a data structure that the database can search efficiently.

Choosing the right columns to index can dramatically improve query performance.

Indexes can be created using the CREATE INDEX command on existing tables. However, over-indexing may slow down write operations due to the additional maintenance required.

Balancing between transaction processing and indexing is crucial in optimizing database performance and reliability. Proper indexing strategies not only improve speed but also aid in maintaining a robust data management system.

Exploring Scalability and Performance

A computer screen displaying T-SQL code for creating tables, with a focus on scalability and performance

Understanding how to improve scalability and performance is essential when working with T-SQL. This involves optimizing query execution and maintaining consistent database performance, crucial for handling large data sets and complex operations efficiently.

Optimizing SQL Queries

Optimizing SQL queries is vital for efficient database management. Reducing query execution time can significantly enhance the user experience and resource utilization.

Techniques such as indexing and query refactoring play a crucial role in performance improvement.

Indexing helps in quickly locating data within tables, especially on large datasets. Refactoring involves rewriting queries for better execution plans.

Using execution plans to identify bottlenecks in queries allows for targeted optimizations.

In environments like the Azure SQL Database, monitoring query performance is straightforward due to built-in tools.

Query optimization can leverage SQL Server’s in-memory capabilities, reducing latency and improving throughput.

Maintaining Database Performance

Maintaining database performance involves regular monitoring and adjustments to settings and configurations.

It’s essential to manage resources effectively, especially when dealing with Azure SQL Managed Instance, which offers features for scalability.

Routine checks on disk usage, memory allocation, and CPU usage can prevent performance degradation.

Keeping an eye on workload patterns and adjusting resources accordingly help maintain optimal performance.

Utilizing features of the Analytics Platform System can enhance data processing capabilities, supporting scalability for large-scale operations.

Consistently updating and maintaining indexes, adjusting database settings, and performing database tuning tasks are key practices for maintaining a high-performance database environment.

Frequently Asked Questions

A person typing on a computer, creating a table in a database using T-SQL

This section addresses common questions about creating tables using T-SQL, including how to set up primary and foreign keys, the syntax for table creation, and best practices for naming. The examples provided will help in understanding and applying these concepts practically.

How do I create a table in T-SQL with a primary key?

To create a table with a primary key, use the CREATE TABLE statement and define the primary key with the PRIMARY KEY keyword. This ensures that the column specified uniquely identifies each record in the table.

What is the syntax for creating a new table using T-SQL?

The basic syntax for creating a table in T-SQL is:

CREATE TABLE table_name (
    column_name1 data_type1 constraints,
    column_name2 data_type2 constraints,
    ...
    PRIMARY KEY (column_name)
);

This statement outlines the table’s structure, including column names, data types, and any constraints.

Can you show an example of using CREATE TABLE AS SELECT in SQL Server?

In SQL Server, you can’t directly use CREATE TABLE AS SELECT like other SQL variants. Instead, you’d use SELECT INTO to create a new table from an existing table’s data:

SELECT *
INTO new_table_name
FROM existing_table_name
WHERE condition;

How to define foreign keys when creating a table in T-SQL?

To define a foreign key, include the FOREIGN KEY constraint in the CREATE TABLE statement:

FOREIGN KEY (column_name) REFERENCES parent_table(parent_column)

This links the table to another, enforcing referential integrity.

What are the best practices for naming columns and tables in T-SQL?

Names should be descriptive and follow a consistent format. Avoid using reserved SQL keywords.

Use underscores to separate words in names for readability, like user_id or order_number.

How do you add constraints during table creation in T-SQL?

Constraints like NOT NULL, UNIQUE, CHECK, PRIMARY KEY, and FOREIGN KEY are added directly in the CREATE TABLE statement.

For example:

CREATE TABLE example (
    id INT PRIMARY KEY,
    name VARCHAR(50) NOT NULL,
    age INT CHECK (age >= 0)
);

Constraints ensure data integrity and control what data can be entered into the table.

Categories
Uncategorized

Learning about Binary Heaps and Priority Queues in Python: A Comprehensive Guide

Understanding Binary Heaps

Binary heaps are a crucial data structure for efficiently implementing priority queues. They ensure that the highest or lowest priority element can be accessed quickly.

The heap property and structure play an integral role in this function, creating an organized and predictable data environment.

Heap Property and Structure

A binary heap is a complete binary tree where each node meets the heap property. The nodes are arranged so that each parent node’s value is less than or equal to its children’s values in a min heap, or greater than or equal in a max heap.

This arrangement ensures efficient operations.

Binary heaps are typically implemented using arrays. The indices represent tree levels, making parent-child relationships easy to calculate.

A parent node’s children are found at specific indices, transforming the heap structure into a linear format. This characteristic of binary heaps maximizes both space efficiency and access speed.

A binary heap’s structure is crucial to its function, having a direct impact on the performance of algorithms like heapsort.

Min Heap vs Max Heap

In a min heap, the root node contains the smallest value. Each parent node’s value is less than or equal to that of its children, maintaining the heap’s priorities. This structure is useful when the smallest element needs frequent access.

Conversely, a max heap prioritizes the largest value at the root. Each parent node’s value is greater than or equal to its children’s. This setup is ideal for scenarios where the largest element should be accessed often.

Both types of heaps serve specific purposes and are driven by their distinct ordering rules.

Using these properties, heaps can efficiently support priority queues in various applications.

Exploring the Python Heapq Module

The Python heapq module provides an efficient way to handle heaps and priority queues. It offers several functions to manage data by priority using binary heaps.

This section discusses the basics of the module and its main functions.

Introduction to the Heapq Module

The heapq module in Python is part of the standard library, designed for efficient heap queue algorithms. Heaps are tree-like data structures with properties that make them suitable for managing collections of data where the most important item is needed quickly.

In Python, the heapq module supports min-heaps by default. This means the smallest element is always at the root, making it easy to access and manage. Max-heaps can be simulated using min-heaps by pushing the negative values.

Heapq Functions and Their Uses

heappush: This function adds an element to the heap, maintaining the heap property. The operation is efficient, running in logarithmic time. It ensures the smallest element remains at the root.

heappop: This function removes and returns the smallest element from the heap. This operation also happens in logarithmic time.

Combining heappush and heappop helps manage dynamic priority queues effectively.

heapify: This function transforms a list into a heap in-place. By efficiently shifting the elements, it ensures that the list follows the heap property.

This is useful when a list needs to be reorganized quickly into a heap structure.

For more details on these functions, you can check the Python 3.13.0 documentation on heapq.

Priority Queue Fundamentals

Priority queues are a specialized data structure that allows elements to have priorities. Unlike regular queues, where elements are processed in the order they were added, priority queues focus on the priority of each element, enabling more efficient task management.

Priority Queue Concept

A priority queue is an abstract data type that manages a collection of elements with associated priorities. Each element in the queue has a priority level, and the element with the highest priority is served before others.

This contrasts with regular queues, where the first element to enter is the first to be processed, also known as First-In-First-Out (FIFO).

Priority queues are typically implemented using data structures like heaps. A common choice is the binary heap, which allows for efficient insertion and deletion operations. The binary heap ensures that the element with the highest priority is easily accessible at the root, enabling quick retrieval.

Priority queues are widely used in scenarios such as task scheduling and simulations, where tasks need to be prioritized according to urgency or importance.

Comparison with Regular Queues

While both priority queues and regular queues store and manage elements, their operation differs significantly.

In a regular queue, the process is simple and linear: elements are added to the back and removed from the front. This structure makes them suitable for scenarios where order, not priority, is paramount, such as handling print jobs in sequence.

On the other hand, a priority queue organizes elements based on their priority levels. This makes them useful in cases where some tasks must preempt others, like in CPU scheduling.

Implementations such as binary heaps allow priority queues to efficiently manage dynamic task lists where the highest priority item handles first, different from the overall FIFO behavior in regular queues.

Implementing Priority Queues Using Heaps

Priority queues can be efficiently implemented using binary heaps in Python. This technique is helpful for tasks requiring prioritized processing, such as scheduling jobs or managing tasks based on importance.

Using Heapq to Create Priority Queues

Python offers the heapq module as part of its standard library, which is ideal for creating priority queues. A priority queue stores elements so that retrieval happens in order of priority.

With a min-heap, the smallest element is accessed first. To create a priority queue, one can initialize a list and apply heapq.heapify() to transform it into a heap structure.

Once the heap is set up, elements can be added using heapq.heappush(), which maintains the heap property.

Removing the highest priority item is done using heapq.heappop(), which efficiently retrieves and removes the smallest element.

These operations ensure that priority queue functions are executed in logarithmic time, making them suitable for large datasets.

Priority Queue Operations

There are several key operations involved in manipulating priority queues with heaps.

Adding an item is done with heapq.heappush(), which appends the new element and re-orders the heap.

Conversely, heapq.heappop() is used to remove and return the smallest element from the heap, adjusting the heap to maintain its properties.

In some cases, only the smallest element is needed without removal. Here, direct access to the first element of the heap list (heap[0]) is allowed. This operation is efficient, as it requires constant time.

For inserting and removing elements, the heap algorithm effectively manages the order while preserving the rules of the binary heap structure.

Insertion and Removal in Heaps

In binary heaps, efficient insertion and removal are crucial for maintaining the heap structure. Python’s heapq module provides simple functions for these operations.

Inserting Elements With Heappush

The heappush function is used to add elements to the heap while maintaining its properties.

When heappush is called, the new element is placed at the end of the heap (a list in Python) and then adjusted to ensure the heap rules are still followed. This adjustment involves shifting the element up until it’s in the correct position.

For example, when adding an element to a min-heap, heappush ensures that the smallest element is always at the root.

This is done by comparing the new element with its parent node and swapping them if necessary.

This operation is efficient, performing in O(log n) time, which makes it suitable for real-time applications where quick insertion is necessary.

Removing Elements With Heappop and Heapreplace

Removing elements from a heap can be done using heappop and heapreplace.

With heappop, the smallest element is removed from the heap. This process involves taking the root element, replacing it with the last element, and then adjusting the heap to maintain its structure.

This is accomplished through shifting the replacement down until it fits properly within the heap.

On the other hand, heapreplace allows for both removal and insertion in a single function call. It pops the smallest element and pushes a new one onto the heap in a seamless operation.

This is particularly useful when both actions are necessary, reducing the overhead of separate operations in a priority queue setup.

Both heappop and heapreplace also operate in O(log n) time.

Heap Sorting Techniques

Heap sorting is an efficient method that uses the heap data structure to organize and manipulate large sets of data. By leveraging the properties of heaps, this technique effectively finds and arranges elements in a predictable order.

Sorting With Heaps

Heap sort operates by first transforming an array into a binary heap structure. This process involves constructing either a min-heap or max-heap, depending on whether the aim is to sort in ascending or descending order.

The key step is repeatedly removing the largest element from a max-heap or the smallest from a min-heap and placing it at the end of the array.

This method ensures that after each removal, the heap maintains its structured properties.

Heap sort is advantageous due to its O(n log n) time complexity and ability to perform well with fewer comparisons and swaps than simple sorting techniques.

For programming in Python, the heapq module offers functions like heappush and heappop to implement this approach seamlessly.

Finding Largest and Smallest Elements

When working with heaps, especially using Python’s heapq module, finding the largest and smallest elements can become straightforward.

The nlargest and nsmallest functions are specifically designed for this task.

These functions efficiently extract a specified number of largest or smallest elements from a heap or list without fully sorting the data.

For example, in a min-heap, the smallest element is always at the root and can be accessed directly. Similarly, the largest elements in a max-heap are efficiently accessible.

This feature is crucial for operations requiring quick access to extreme values like top-performing data entries or outliers. Using these robust heap properties makes handling large datasets more manageable and effective.

Advanced Heap Operations

Advanced heap operations in Python allow for efficient data manipulation and retrieval. Understanding these operations can enhance performance, especially when managing large datasets.

Implementing Heappushpop and Heapreplace

The heappushpop and heapreplace functions are crucial for handling heaps efficiently.

heappushpop combines two actions: it adds a new element to the heap and then removes the smallest one. This operation is efficient as it does both actions in a single step, maintaining the heap structure throughout.

heapreplace, on the other hand, pops the smallest element and pushes a new one in its place.

These methods are particularly useful in scenarios where the heap size must remain constant. Both methods have a time complexity of O(log n), making them suitable for real-time applications where speed is important.

Efficient Element Retrieval With Nlargest and Nsmallest

The heapq.nlargest and nsmallest functions simplify the task of finding a specific number of largest or smallest elements in a heap.

These functions are useful for quickly retrieving top priority elements without manually sorting the entire dataset.

By using these methods, you can extract elements in a single action, leveraging the efficiency of heaps.

This approach is advantageous when dealing with large datasets, as it minimizes computation time.

Both functions are versatile and can be applied to various problem-solving scenarios, proving to be invaluable for tasks that demand quick access to key elements.

Working With Binary Trees in Heaps

Binary heaps are a type of binary tree used in implementing priority queues.

They maintain the property that in a max-heap, each parent node’s value is greater than or equal to its children, and in a min-heap, it is less than or equal to its children.

This structure allows efficient operations to be performed.

Binary Tree Representation of Heaps

A binary heap is a complete binary tree, meaning that it is entirely filled at every level except possibly the last. This property ensures efficient use of space.

Each binary heap is usually represented as an array. The root element is at index 0, and for any element at index i, its left child is at index 2i + 1, and the right child is at index 2i + 2.

This array representation helps with easy access and manipulation. It directly supports operations like insertions, deletions, and finding the maximum or minimum (depending on the heap type).

Being able to navigate between parent and child using simple arithmetic makes the binary heap a time-efficient data structure for priority queue operations.

Traversal and Operations on Binary Trees

Traversal in a binary heap is straightforward due to its complete binary tree structure.

Common operations include inserting an element, removing the root, and adjusting the heap to maintain its properties.

Insertion involves adding a new element to the end of the array and then “bubbling up” to maintain the heap condition.

The removal process entails deleting the root node and replacing it with the last element in the array. The structure is then re-adjusted using a “bubbling down” process to preserve heap properties.

These operations maintain the efficiency of heaps, making tasks like sorting and priority queue management effective.

Common Use Cases for Heaps

Heaps are efficient data structures often used in scheduling and optimizing algorithms. They help in finding the smallest or largest element quickly, which is crucial in these applications.

Scheduling Applications

In scheduling tasks like emails, heaps are particularly effective. They manage tasks based on priority, ensuring important tasks are handled first.

The priority queue, implemented with a heap, allows for efficient retrieval of the highest-priority task without needing to sort the entire list.

When scheduling emails, tasks can be organized by urgency or scheduled time.

Using a heap, the next email to be sent can be quickly identified by popping the top element from the priority queue.

This approach reduces the complexity of scheduling tasks, allowing systems to operate smoothly and effectively.

The Python heapq module in its standard library provides functions like heappush and heappop, making heap operations straightforward and efficient. These functions help maintain the heap property, crucial for keeping tasks in order.

Graph Algorithm Optimization

Heaps play a vital role in optimizing graph algorithms, making them faster and more efficient. In particular, they are used in algorithms like Dijkstra’s shortest path and Prim’s minimum spanning tree.

These algorithms rely on the ability to quickly access the smallest edge or vertex.

In Dijkstra’s algorithm, a heap can maintain a list of tentative distances to each vertex, allowing for rapid selection of the next vertex to process.

Heaps reduce the overall computational complexity, making it feasible to handle large graphs efficiently.

For tasks involving graph algorithms, heaps are ideal as they help in managing priority queues with minimal reordering or processing.

Using a heap ensures that computational resources are used efficiently, optimizing the overall operation of the algorithm.

Managing Heap Size and Performance

When dealing with binary heaps and priority queues in Python, it is crucial to effectively manage both the size of the heap and the performance of operations like insertions and deletions.

This section discusses maintaining the right number of entries and fine-tuning heap operations for optimal outcomes.

Balancing Entry Count

The entry count in a heap influences its performance. A large number of entries can slow down operations, while too few may underutilize resources.

The key is to maintain a balance that allows efficient processing.

Keeping track of the entry count helps in deciding when to restructure or reallocate resources.

Heaps in Python, like those managed by the heapq module, provide efficient methods for adding (pushing) and removing (popping) elements.

By focusing on these operations, performance can be maximized without unnecessarily increasing the heap size.

Regularly check and adjust the heap size to keep it suitable for the current workload.

Optimizing Heap Operations

Optimizing heap operations is essential for maintaining performance.

The Python heapq module is designed for efficiency, offering functions like heappush() and heappop() to manage these tasks.

These methods ensure that heaps are always balanced and maintain the correct properties.

Efficient use of these operations involves keeping the heap as compact as possible.

For example, when the heap becomes too large, some elements might need to be pruned or reorganized to improve access speed.

By focusing on optimizing these operations, systems gain in both speed and reliability while handling tasks efficiently.

Queue Operations and Management

A computer screen displaying a python code editor with a binary heap and priority queue operations being implemented

In managing queues, it’s essential to understand how different operations such as enqueue, dequeue, and checking if a queue is empty work. These operations ensure that data is managed efficiently in programming.

Enqueue and Dequeue Operations

Enqueue and dequeue are two primary operations in a queue.

Enqueue inserts an element at the rear of the queue. This operation helps in managing the flow of tasks or data, allowing new items to be entered into the queue efficiently.

Dequeue removes an element from the front of the queue, which is crucial for processing tasks in the order they were added.

This operation ensures timely execution of processes by removing the oldest element, similar to how a line works in real life.

Using these operations, queues maintain a first-in, first-out (FIFO) order, making them vital for many programming scenarios like task scheduling or print jobs.

Implementing Is_Empty Method

The is_empty method is vital for checking if a queue has no elements.

This operation returns a Boolean value: True if the queue is empty and False otherwise.

This check is important to avoid errors like attempting to dequeue from an empty queue, which can cause program crashes.

To implement this method, the queue is often checked by examining if its length is zero or if its head and tail pointers point to the same position.

This method prevents unnecessary processing and errors in the program’s flow.

Frequently Asked Questions

This section addresses common queries about binary heaps and priority queues in Python with clear and concise explanations. It covers implementation using the heapq module, differentiates data structures, and includes examples.

How do I implement a max heap in Python using the heapq module?

Python’s heapq module by default supports a min heap. To simulate a max heap, you can insert the negative of each element. When retrieving elements, simply negate them again to get the original values.

Can you explain how to use the heappop function in Python’s heapq library?

The heappop function removes and returns the smallest element from the heap. It maintains the heap property by automatically adjusting the remaining elements.

This function is efficient for getting the minimum value in constant time.

What are the steps for implementing a priority queue with Python’s heapq?

A priority queue can be implemented using heapq by organizing tasks with priorities. Insert tuples where the first element is the priority number.

Use heappush to add and heappop to remove tasks, ensuring that tasks with the highest priority are processed first.

How does a binary heap differ from a priority queue in terms of structure and usage?

A binary heap is a specific kind of complete binary tree used to implement priority queues.

Structurally, it maintains either a min or max order. While the heap is the underlying structure, priority queues allow easy retrieval of elements based on priority levels.

In which scenarios is it more beneficial to use a binary heap over a priority queue in Python?

Binary heaps are ideal for problems requiring quick access to the smallest or largest element, like heap sort or implementing a priority queue.

They offer efficient insertion and removal operations, making them well-suited for applications like scheduling tasks.

Could you provide an example of how to construct a priority queue class in Python using a binary heap?

To construct a priority queue class, encapsulate the heap operations in class methods. Use heapq functions to manage elements and maintain structure.

A typical class would include methods for adding elements to the queue and retrieving the highest-priority task, using the heap’s properties for efficiency.

Categories
Uncategorized

Learning Power BI – Data Prep Essentials: Cleaning, Transforming, Loading

Getting Started with Power BI Data Preparation

Beginning with Power BI for data preparation involves understanding and applying key processes like extracting, transforming, and loading data. Users must familiarize themselves with Power BI’s environment to streamline data handling efficiently. These subtopics break down essential aspects.

Understanding the ETL Process

The ETL (Extract, Transform, Load) process is crucial for preparing data in Power BI.

Extracting involves retrieving data from multiple sources. Users can pull data from Excel files, SQL databases, or cloud services like Azure.

Transforming is where data cleaning and shaping occur. This can mean removing duplicates, fixing errors, or altering structures to suit analysis needs.

Power BI tools allow users to perform operations like filtering and merging datasets for better accuracy.

Loading is the final step, where prepared data is moved into Power BI. This enables users to create dashboards and reports. Ensuring data integrity and optimization at this stage is essential for accurate insights.

Overview of Power BI Ecosystem

The Power BI ecosystem offers a variety of tools for efficient data preparation. The core components—Power BI Desktop, Power BI Service, and Power BI Mobile—provide flexibility across devices.

Power BI Desktop is the main platform for creating and modifying data models. Users can design reports with comprehensive visualizations.

Power BI Service supports collaboration through the cloud. It allows data sharing and report publishing, enabling team engagement.

Power BI Mobile ensures access on-the-go, allowing users to view real-time insights from anywhere. Together, these components enhance the data preparation process, making insights accessible and actionable. Users can take advantage of features like data transformation to improve data readiness for analysis.

Connecting to Data Sources

Connecting to various data sources is a critical part of effectively using Power BI. Understanding how to import and integrate data from platforms like Microsoft Excel can enhance your data analysis and visualization capabilities.

Importing Data from Various Sources

Power BI allows users to connect to a wide range of data sources. These can include databases, cloud services, and simple files.

Users can import data from databases such as SQL Server and Oracle. Cloud services like Azure, Google Analytics, and Salesforce are also compatible with Power BI.

Additionally, data files in formats like CSV, XML, and JSON can be loaded directly into Power BI. This flexibility ensures that users can gather and analyze data from multiple environments without complex configurations, providing a seamless data exploration experience.

Integrating Power BI with Microsoft Excel

Power BI has strong integration capabilities with Microsoft Excel, making it easy for users to analyze spreadsheets.

Users can either import entire Excel files or connect to specific tables and ranges in their sheets. Once connected, data changes in Excel can be updated in Power BI automatically, ensuring accuracy.

Additionally, Power BI’s “Analyze in Excel” feature allows users to utilize Excel’s advanced functionalities while retaining the dynamic visualization capabilities of Power BI. This integration empowers users to leverage the strengths of both tools for comprehensive data analysis.

Profiling Data in Power BI

Profiling data in Power BI involves examining datasets to understand their structure and quality. This process helps uncover data patterns and identify potential issues before any cleaning or transformation begins. Power Query offers several tools and features to effectively profile data, making it easier for users to manage their data preparation tasks.

Exploring Data Profiling Features in Power Query

Power Query provides robust data profiling features designed to give users insights into their datasets. When a dataset is loaded, Power Query displays a preview of the data.

Users can view column distribution, detect empty or unique values, and identify errors or inconsistencies. These features help users quickly assess the dataset’s quality and make informed decisions about cleaning and transformation.

Key Features:

  • Column Quality: Shows the percentage of valid, error, and empty values.
  • Column Distribution: Displays the frequency of unique values in each column.
  • Column Profiling: Analyzes types and statistics, such as minimum, maximum, and average values.

Power Query’s interface is intuitive, allowing users to interact with these features easily. By leveraging data profiling, users can streamline the data preparation process and improve the accuracy of their analyses.

Techniques for Profile Columns

Profiling columns in Power BI helps optimize data models and ensure accurate analysis. Users can apply specific techniques to enhance data quality and reliability.

One effective approach is using the Query Editor to perform transformations based on profiling data results. Users can easily filter out null values, correct data types, or split columns based on certain patterns.

Additionally, applying business rules and conditional formatting can highlight anomalies that need attention.

Popular Techniques:

  • Data Type Correction: Ensures consistency across data models.
  • Outlier Detection: Identifies data points that deviate significantly from the norm.
  • Value Replacement: Replaces incorrect or missing data with appropriate values.

These profiling methods allow users to maintain clean and reliable datasets, facilitating better decision-making and analysis in Power BI projects.

Cleaning and Transforming Data

In Power BI, the process of cleaning and transforming data is crucial for preparing it for analysis. This involves identifying and correcting data issues and utilizing tools like the Power Query Advanced Editor for refined transformations.

Correcting Data Anomalies

Data anomalies can disrupt analysis if not detected early. Power BI provides tools for identifying and correcting these issues, which might include duplicates, missing values, or inconsistent data entries. Users can apply simple transformations through the Power Query interface.

For instance, removing duplicates is accessible through the right-click menu. Missing values can be addressed by replacing them with a default value or previous entry, ensuring a smoother analysis.

Correcting these anomalies helps maintain data integrity and enhances the reliability of the insights drawn from your dataset.

Utilizing the Advanced Editor for Custom Transformations

The Advanced Editor in Power BI offers a powerful way to perform custom transformations. Users with experience in M code can access this feature to write specific scripts that cater to unique transformation needs. This is particularly useful when default transformations are insufficient.

Through the Advanced Editor, users can implement transformations like conditional columns and pivoting data tables. This level of customization allows for a flexible transformation process, adapting the dataset to specific project requirements. By harnessing this feature, users ensure that their data meets precise analysis objectives.

Transform Data with Power Query

Power Query is a robust tool within Microsoft’s BI solutions that streamlines data transformation. Users can efficiently manipulate and clean data, changing data types and adjusting storage modes as needed.

Manipulating Queries and Changing Data Types

Power Query allows users to manipulate queries by applying a series of transformation steps to the data. This includes filtering rows, removing duplicates, and splitting columns, which can be done through its intuitive interface. By offering a range of built-in functions, Power Query empowers users to perform complex transformations without advanced coding skills.

Changing data types is essential for ensuring data consistency and accuracy. Power Query enables users to specify data types such as text, number, or date for each column. This can prevent errors in data analysis and computations downstream. Correct data type assignment helps in maintaining efficient data models, particularly in large datasets.

Renaming Objects and Adjusting Storage Modes

Renaming objects in Power Query, such as columns and tables, helps in maintaining clarity and organization. Clear naming conventions allow users to understand and navigate their data models easily. This is particularly important when working with complex datasets with numerous variables.

Adjusting storage modes is vital for optimizing performance. Power Query offers options to switch between DirectQuery and Import modes, depending on the user’s needs.

Import mode is typically faster for complex queries as it loads data into memory. In contrast, DirectQuery mode fetches data directly from the source, which can be beneficial when dealing with large datasets or when fresh data is crucial.

Selecting the appropriate storage mode can enhance query performance and reporting efficiency.

Pivoting and Aggregating Data

Pivoting and aggregating data are essential steps in data analysis, especially with tools like Power BI. They help transform raw data into meaningful insights. Understanding how to pivot and summarize data can lead to clearer reports and better decision-making.

Pivot and Unpivot Techniques

Pivoting in Power BI refers to turning unique values in one column into multiple columns, often for categorical data. It’s useful for rearranging data to make it more readable or to perform detailed analysis.

In contrast, the unpivot technique does the opposite. It turns columns into rows, which is handy for consolidating data when you need to include multiple columns of similar data into one.

For example, imagine a table with monthly sales figures across several columns. By unpivoting, you can turn each month into a row, making it easier to analyze trends over time. These techniques are crucial for reshaping data to suit analytic needs, allowing users to perform more flexible and robust data operations in Power BI.

Summarizing Data for Deeper Analytics

To gain deeper insights, summarizing data efficiently is essential. Power BI enables users to create summaries using functions like SUM, COUNT, and AVERAGE. These summaries help in identifying trends, patterns, or outliers quickly.

Aggregated data provides a condensed view, making it easier to digest and analyze larger datasets.

Power BI’s capability to aggregate data using tools like Power Query enables businesses to see how data aggregates in various dimensions. These capabilities are instrumental in producing powerful, data-driven stories and facilitating informed business decisions. By condensing details into a digestible format, analysts can communicate more effectively with stakeholders and uncover actionable insights.

Optimizing Data Models

Efficient data modeling is key in Power BI to ensure quick and reliable data analysis. By focusing on improving performance through data optimization and setting up clear relationships and hierarchies, one can significantly enhance the usability and efficiency of their Power BI reports.

Improving Performance with Data Optimization

Performance is crucial when working with large datasets in Power BI.

Optimizing your data models can be achieved by carefully selecting the data that needs to be loaded. Removing unnecessary columns and tables reduces complexity and speeds up data processing.

Utilizing data cleaning and transformation tools ensures that data is accurate and ready for analysis. These tools help streamline data preparation, enabling users to transform raw data into a more efficient format.

Additionally, it’s important to use Power BI’s built-in features, like aggregations and calculated columns, to optimize performance.

Data compression techniques help minimize storage and improve performance, allowing faster query responses. Implementing these strategies makes the data models more responsive and efficient.

Establishing Relationships and Hierarchies

Creating effective relationships within Power BI data models is essential to ensure data is interconnected correctly. This involves setting up proper links between tables, using primary and foreign keys. It ensures accurate data analysis by allowing seamless navigation through related data points.

Hierarchies simplify data models by organizing data into levels of detail. For example, date hierarchies allow users to analyze data by year, quarter, month, or day. This arrangement simplifies complex datasets, making them easier to understand.

Formulating these relationships and hierarchies takes full advantage of Power BI’s features, leading to insightful data analysis. Proper setup ensures that the data model is logical and intuitive for users to interact with.

Advancing with Calculations and Measures

Power BI is a powerful tool for data analysis. It allows users to create custom calculations and measures to enhance their reports.

Understanding how to work with calculated columns and leveraging DAX for advanced calculations can significantly improve data insights and reporting efficiency.

Creating Calculated Columns and Measures

In Power BI, calculated columns are created using DAX expressions that run row by row on your data. This is useful when a user needs to add new data based on existing data in the dataset.

Calculated columns are stored in the data model and can be used to filter, sort, and categorize data for a more detailed analysis.

Measures, on the other hand, are calculations performed on data aggregated based on the context of the report. They are not stored in the data model but calculated on the fly, providing dynamic insights.

Measures are particularly useful for creating dashboards that require frequently updated data. Both features enable users to tailor their data models to the specific needs of their analysis tasks.

Using DAX for Advanced Calculations

DAX (Data Analysis Expressions) is integral to Power BI, offering a range of functions for complex calculations. It allows for powerful analytical operations, such as conditional logic, time intelligence, and aggregations, enhancing the depth of analysis.

DAX expressions are used to define calculations for both calculated columns and measures.

Users benefit from DAX by performing operations like calculating year-to-date sales or determining a running total. It supports a range of functions, including mathematical, statistical, and logical functions, which are essential for creating interactive reports.

DAX is crucial for unlocking the full potential of data analysis within Power BI, enabling deeper insights and more robust data-driven decisions.

Preparing for PL-300 Certification

Earning the PL-300 certification as a Power BI Data Analyst Associate is a valuable step for those aiming to excel in data analytics. This involves understanding how to clean, transform, and load data using Microsoft Power BI effectively.

Tips for Power BI Data Analyst Associate Exam

Mastering practical skills is crucial for the PL-300 exam. Candidates should spend ample time on Microsoft Power BI tools like Power Query Editor.

It’s important to practice tasks such as data cleaning, transformation, and modeling.

Familiarity with various data sources and how Power BI integrates them helps. Hands-on experience in real-world scenarios is beneficial.

Creating a study schedule helps manage time and ensure thorough coverage of all topics. Using practice tests to simulate the exam day experience can identify areas needing improvement.

Becoming comfortable with the Power BI platform through extensive use prepares candidates for success.

Examining the PL-300 Exam Structure and Content

The PL-300 exam assesses several competencies. Key areas include data preparation, data modeling, and data visualization.

Data preparation involves cleaning and transforming data, with 40% of time spent ensuring data quality and accuracy. Understanding these processes can make a significant difference in performance.

Data modeling requires connecting data sources and creating a structured model for analysis. Being proficient in building reports and dashboards in Power BI is equally critical.

Knowledge of Microsoft PL-300 specific topics can improve exam readiness. Comprehensive preparation can lead to obtaining the Power BI Data Analyst Associate certification.

Building a Professional Presence

Establishing a professional presence is crucial for success in the data analytics field. This involves creating a compelling LinkedIn profile and connecting with industry experts to unlock new opportunities.

Crafting a LinkedIn Profile as a Data Analyst

An effective LinkedIn profile serves as a digital resume. Key sections include a professional headline, a detailed summary, and a list of skills.

A headline like “Data Analyst Specializing in Business Intelligence” can attract attention.

The summary should highlight expertise in relevant tools, such as Power BI and cloud solutions. Use specific projects and achievements to demonstrate skills.

Uploading a professional photo and ensuring grammar and spelling are correct also enhance credibility.

Networking with Industry Experts

Networking is vital for career growth. Engaging with industry experts on platforms like LinkedIn provides insights and opportunities.

Start by joining relevant groups focused on data analytics and business intelligence.

Participating in discussions and sharing insightful content can lead to valuable connections. Attending webinars and industry events where experts, such as cloud solutions architects, speak can also be beneficial.

Building genuine relationships often opens doors to collaborations and mentorship opportunities.

Frequently Asked Questions

Data preparation in Power BI involves cleaning, transforming, and loading data to create accurate and insightful visualizations. By following effective practices, users can efficiently handle complex data tasks and generate compelling visuals.

What are the best practices for data cleaning in Power BI?

Data cleaning in Power BI involves removing duplicates, correcting errors, and handling missing values. It’s important to use Power Query, which offers tools to filter, sort, and format data efficiently.

How can you create a visual after cleaning and transforming data in Power BI?

Once the data is cleaned and transformed, users can create visuals in the Power BI interface. By selecting fields and choosing the desired chart type, users can generate visuals that are connected to the prepared dataset.

What are the steps involved in advanced data transformation using Power BI?

Advanced data transformation in Power BI may include merging queries, adding calculated columns, and using DAX functions. These steps enable users to combine datasets, create complex calculations, and tailor the data to meet specific analysis needs.

Can you explain the distinction between loading data and transforming data in Power BI?

Loading data refers to importing data into Power BI from various sources. Transforming data involves modifying this imported data to make it suitable for analysis, which can include changes like filtering and shaping.

What is the process for cleaning and preparing data within Power BI?

What resources are available for learning Power BI step by step?

Users can access Microsoft’s official documentation and online courses. Many tutorials and community forums provide guides and tips for both beginners and advanced users.

Categories
Uncategorized

Learning about Natural Language Processing: Essential Concepts and Applications

Fundamentals of Natural Language Processing

A stack of books on natural language processing, surrounded by computer screens and technical diagrams

Natural Language Processing (NLP) combines linguistics, computer science, and artificial intelligence to enable machines to understand human language. This section explores what defines NLP and its evolution and significance in AI.

Defining Natural Language Processing

Natural Language Processing is a branch of artificial intelligence focused on the interaction between computers and humans using natural language. It involves several techniques to make computers understand, interpret, and generate human language.

Techniques include sentiment analysis, which detects emotions in text, and named entity recognition, which identifies names of people, places, and organizations.

NLP is essential for applications like voice assistants, chatbots, and translation systems. It transforms unstructured data into insights, benefiting industries by automating and enhancing linguistic tasks.

Evolution of NLP and Its Importance in AI

NLP has evolved significantly since its inception. Initially, early systems relied on rule-based methods to process language. With the advent of machine learning, NLP techniques became more sophisticated, using algorithms to analyze large datasets.

These advancements facilitated more accurate language models that support complex applications, such as real-time language translation.

The importance of NLP in AI lies in its ability to process vast amounts of data efficiently, making information retrieval and communication more accessible. NLP is crucial for AI systems to tackle diverse, text-heavy challenges in fields like customer service, healthcare, and finance. The synergy between NLP and AI continues to drive innovation in how machines understand and interact with human language.

Core Concepts in NLP

Natural Language Processing (NLP) is essential for enabling computers to interact with human language. Core concepts in NLP include distinguishing syntax from semantics, breaking down text into tokens, parsing through language structures, and employing text preprocessing techniques to clean and prepare data. Each aspect plays a crucial role in enhancing machine language understanding and generation.

Syntax vs Semantics

Syntax refers to the rules that govern the structure of sentences. It involves understanding how words are arranged to form grammatical sentences.

Semantics, on the other hand, is about the meaning and interpretation of words and sentences. While syntax focuses on order, semantics is concerned with understanding the context.

For example, in NLP, correcting syntax errors helps maintain structure. However, grasping semantics ensures the computer can interpret the actual meaning. Both are important for accurate machine translation and text analysis. Machines must process syntax to recognize sentence forms, and they also need semantic analysis to comprehend deeper message meanings.

Understanding Tokenization

Tokenization is a fundamental step in NLP, involving breaking down text into smaller units called tokens. These tokens can be words, phrases, or even characters, depending on the application.

Tokenization helps machines process text data by providing discrete elements to analyze.

For instance, in text analysis, tokenization allows for easier identification of key elements like keywords and phrases. It aids in building frequency distributions that offer insights into the text’s content. Without tokenization, analyzing large datasets becomes challenging, as every language relies on its specific tokens for clarity and comprehension.

The Role of Parsing

Parsing involves the analysis of the grammatical structure of sentences. It identifies parts of speech like nouns, verbs, and adjectives and their relationships in a sentence.

In NLP, parsing is crucial for transforming text into a format that machines can process.

The process helps in detecting syntax errors and improving text understanding. Parsing frameworks often use techniques like context-free grammars to unravel sentence structure. This is useful in applications such as voice recognition and automated chatbots, where correct sentence interpretation is necessary for appropriate responses.

Text Preprocessing Techniques

Text preprocessing is essential for preparing raw data for NLP tasks. It involves several steps such as stemming, lemmatization, and stop word removal. These techniques help refine the data by reducing noise and emphasizing relevant information.

  • Stemming reduces words to their base forms.
  • Lemmatization achieves the same but with more context, considering the root form based on its intended meaning.
  • Stop word removal eliminates common words that add little value to analysis, such as “and,” “the,” and “is.”
  • Lowercasing makes text uniform, while punctuation removal cleans unnecessary symbols.

These steps are crucial for improving the performance of NLP models by ensuring that the data is precise and clean.

Techniques and Models for Language Analysis

Understanding natural language processing requires familiarity with several important techniques and models. These range from identifying grammatical structures and recognizing entities to creating meaningful word representations.

Part-of-Speech Tagging and Dependency Parsing

Part-of-speech tagging involves assigning labels to words based on their grammatical roles. This task is crucial for processing language as it helps algorithms understand sentence structure.

Dependency parsing goes a step further by examining relationships between words. It reveals how words connect and depend on each other, providing insight into sentence meaning.

Techniques like statistical methods and algorithms such as Hidden Markov Models and Conditional Random Fields are often used for these tasks. The parsed data aids in machine translation, information retrieval, and sentiment analysis.

Named Entity Recognition and Its Applications

Named Entity Recognition (NER) identifies and classifies key information in text, such as names, dates, and locations. This technique allows computers to pinpoint important data within a text automatically.

It is widely used in numerous applications like information extraction, news aggregation, and customer feedback analysis.

NER algorithms can handle large datasets efficiently, ensuring precise analysis. Early methods relied on manual coding, but modern systems often employ deep learning to improve accuracy and adaptiveness.

The Development and Use of Word Embeddings

Word embeddings are dense vector representations that capture semantic meanings of words. They make it possible for computers to understand relationships between different words by mapping them in a continuous vector space.

Popular approaches include Word2Vec and GloVe, both of which utilize contexts to embed words meaningfully. Deep learning models like BERT and GPT have further advanced this field by creating richer and context-aware embeddings. These innovations have significantly improved language processing capabilities, facilitating advancements in numerous NLP applications.

Machine Learning in NLP

Machine learning plays a vital role in Natural Language Processing (NLP). It enables computers to process and analyze large volumes of natural language data. The application of machine learning in NLP includes differentiating between supervised and unsupervised learning models, as well as utilizing various techniques to extract meaningful features from text data.

Supervised vs Unsupervised Learning

Supervised and unsupervised learning are essential approaches in NLP.

In supervised learning, models are trained on labeled data. This allows them to learn specific patterns and make predictions. For instance, they are often used for text classification and sentiment analysis. Popular algorithms include decision trees and support vector machines.

Unsupervised learning, on the other hand, deals with unlabeled data. Here, the model identifies inherent patterns without predefined categories.

Clustering and topic modeling are common applications. Techniques like K-means clustering help in organizing text data based on underlying similarities, making it useful in tasks like speech recognition or document classification.

Feature Extraction Techniques

Feature extraction transforms raw text into a format suitable for machine learning algorithms. Some common techniques include Bag of Words (BOW) and TF-IDF (Term Frequency-Inverse Document Frequency).

BOW creates a set of words, focusing on the frequency of terms in a document. This method is simple but can lead to large feature spaces.

TF-IDF, in contrast, weighs terms based on their importance. It calculates how often a word appears across multiple documents, highlighting unique words that stand out. This technique reduces noise by emphasizing significant terms, enhancing model accuracy. These feature extraction methods are integral to developing effective NLP models, enabling tasks such as information retrieval, spam detection, and language translation.

Advanced NLP with Deep Learning

Understanding advanced NLP techniques often involves a strong grasp of deep learning concepts. Key areas include neural networks, RNNs and transformers, and attention mechanisms, which are crucial for building powerful language models like BERT and GPT.

Neural Networks and NLP

Neural networks form the backbone of deep learning models in NLP. These networks process and learn from vast amounts of text data, discovering patterns and structures.

Using frameworks like TensorFlow and PyTorch, developers can build and train models that understand language intricacies.

Key components include nodes organized in layers. Each node processes inputs, applies weights, and passes on the output. This layered structure enables the model to capture complex language features, ultimately enhancing its proficiency in performing various NLP tasks.

Recurrent Neural Networks and Transformer Models

Recurrent Neural Networks (RNNs) are designed for sequence data, such as text. They maintain a ‘memory’ of previous inputs, which helps in understanding context in sequences.

Variants like GRUs and LSTMs address the problem of long-term dependencies by effectively managing the information flow through the network.

Transformer models have revolutionized NLP by using self-attention mechanisms instead of recurrence. This architecture allows models to handle global dependencies and parallelize computations.

Concepts from the Transformer architecture have paved the way for impressive language models like BERT and GPT, which are widely adopted in the industry.

Attention Mechanisms and Language Models

Attention mechanisms enable models to weigh the importance of different words in a sentence, focusing on critical parts of the input when making predictions. This approach enhances the model’s understanding by emphasizing the impact of each word based on the context.

Language models leveraging attention provide improved translation, summarization, and sentiment analysis capabilities.

Models such as those from Huggingface are excellent examples, making it easier for developers to access and implement state-of-the-art NLP technologies. These advancements are crucial for tasks where understanding nuanced meaning is essential.

Practical Applications of NLP

Natural Language Processing (NLP) is transforming how we interact with technology. From classifying emotions in text to creating smart conversation systems, these tools are reshaping communication and information management.

Text Classification and Sentiment Analysis

Text classification is a crucial task in NLP that involves sorting text into predefined categories. This process helps in organizing vast amounts of information, which is essential for various applications like spam detection in emails or categorizing news articles.

Sentiment analysis goes a step further, analyzing emotions and opinions expressed in the text.

Companies often use sentiment analysis to understand customer feedback or social media trends, helping to refine their products and services. By breaking down text into understandable components, businesses can gain valuable insights.

Chatbots and Virtual Assistants

Chatbots and virtual assistants like Alexa and Siri are examples of NLP in action. These systems use advanced algorithms to understand and respond to human language.

By leveraging NLP, they can interpret user requests and provide suitable answers or assistance. This application is widely used in customer service to handle inquiries efficiently, freeing human agents for more complex tasks.

Chatbots have also become popular in personal use, scheduling appointments or setting reminders, making everyday life more convenient through personalized interaction.

Machine Translation and Summarization

Machine translation involves converting text from one language to another, making information accessible worldwide. Services such as Google Translate use sophisticated models, including Transformers, to enhance accuracy and fluency in translations.

Text summarization compresses large documents into shorter, digestible summaries. It is particularly useful for news aggregation and literature reviews, where users need quick information insights.

Both applications highlight NLP’s power to bridge language barriers and distill complex information, enhancing communication across diverse cultures.

Question Answering Systems

Question answering systems are designed to provide precise answers to user queries. Unlike traditional search engines, these systems understand context and semantics to deliver direct responses.

This technology is deployed in various domains, including healthcare, where users ask specific medical questions, and educational platforms, enhancing learning by offering quick explanations.

By utilizing NLP, these systems improve user experience by providing accurate and timely information, showcasing the advancement in human-computer interaction.

Natural Language Processing Tools and Libraries

Natural Language Processing (NLP) involves using tools and libraries to analyze human language.

Some of the most essential tools include NLTK, spaCy, Gensim, and Huggingface’s Transformers, each offering unique features and benefits.

An Overview of NLTK

The Natural Language Toolkit (NLTK) is one of the oldest and most comprehensive NLP libraries available. Designed for use with Python, it provides tools for text processing and linguistics, such as tokenization and parsing.

It is particularly helpful for educational purposes and is widely used in academic settings. NLTK supports a variety of languages and offers extensive documentation and tutorials, making it accessible even to beginners.

Though it can be slower compared to newer libraries, NLTK’s versatility makes it an invaluable resource for both students and professionals who need a diverse range of tools.

Exploring Spacy and Gensim

spaCy is a modern NLP library known for its speed and efficiency, particularly in handling large volumes of text. It supports tasks like named entity recognition, part-of-speech tagging, and dependency parsing.

spaCy is designed for production use, offering a robust environment for building applications that require complex NLP tasks.

Gensim is another library focused on topic modeling and similarity queries. It is useful for tasks such as building word vectors and running Latent Semantic Analysis.

Both spaCy and Gensim provide easy-to-use interfaces that integrate well with machine learning workflows, enhancing their appeal to developers working with large datasets in the Python ecosystem.

Modern Libraries: Huggingface’s Transformers

Huggingface’s Transformers have revolutionized NLP by facilitating state-of-the-art model implementations like BERT and GPT.

These models are pre-trained on vast datasets and can be fine-tuned for specific tasks, offering unparalleled accuracy and performance. Huggingface simplifies the use of these models through a user-friendly API that supports various NLP applications, such as sentiment analysis and text generation.

This library is particularly valued for its focus on community-driven development and extensive documentation, making cutting-edge technology accessible to a wide range of users in the NLP community.

Challenges and Considerations in NLP

Natural Language Processing (NLP) involves addressing complex challenges such as unstructured data and ambiguity, as well as ethical issues like bias.

Successfully navigating these challenges is crucial in developing reliable and fair NLP systems.

Dealing with Unstructured Data and Ambiguity

NLP systems often grapple with the intricacies of unstructured data. Text data from different sources vary in format, making it difficult to interpret consistently. For example, social media posts, emails, and articles all have unique structures.

Ambiguity in language adds another layer of complexity. Words may have multiple meanings based on context. Machines need to discern these meanings accurately.

This requires advanced algorithms and models that comprehend context and semantics effectively, such as deep learning and neural networks. Developers often enhance NLP with context-specific knowledge to improve accuracy in processing such ambiguous data.

Understanding context improves the system’s ability to handle varying meanings and nuances. With these techniques, NLP models can better interpret language and adapt to the dynamic nature of human communication.

Ethical Considerations and Bias in NLP

Ethics and bias in NLP represent substantial concerns. AI models can unintentionally learn and perpetuate biases present in training data. If not addressed, these biases can influence outcomes in discriminatory ways, affecting applications like hiring algorithms or loan approvals.

NLP systems must be monitored to prevent such biases from impacting decisions. This involves careful data collection practices and regular audits of AI models.

Developers should also consider diverse datasets to minimize bias effects and ensure fair treatment across different groups.

Ethical approaches in NLP prioritize transparency and accountability, ensuring systems are both effective and just. It is essential to maintain awareness of these issues to build trustworthy and equitable AI technologies that respect human diversity.

Evaluating NLP Systems

Evaluation of Natural Language Processing (NLP) systems is vital to ensure their effectiveness and reliability. This involves assessing performance metrics and validating models, along with evaluating real-world effectiveness and promoting continuous improvement.

Performance Metrics and Model Validation

To evaluate NLP systems, one must focus on performance metrics that quantify accuracy and efficiency. Common metrics include precision, recall, F1 score, and accuracy.

These metrics help determine the balance between true positives and false positives. Precision measures how many selected items are relevant, while recall counts how many relevant items are selected.

Model validation is essential to assess the performance of machine learning models. Techniques like cross-validation and holdout methods are used.

Cross-validation divides data into parts to validate model performance, helping to reduce overfitting. Holdout methods involve splitting the data into training and testing sets, which provides a more straightforward way to validate models.

These approaches ensure the model’s robustness and its ability to generalize well to new data.

Real-World Effectiveness and Continuous Improvement

Evaluating the real-world effectiveness of NLP systems considers how they perform outside controlled environments. This involves testing models in varied settings to see how well they adapt and meet practical needs.

Challenges often arise due to differences in data when moved from a lab setting to real-world scenarios.

Continuous improvement is crucial for maintaining the relevance and efficacy of NLP systems. This includes regular updates and retraining of models with new data to handle evolving language patterns and user demands.

By integrating feedback mechanisms, developers can refine systems over time, ensuring performance keeps pace with changing linguistic contexts. This ongoing process makes sure NLP applications remain useful and responsive as they encounter fresh challenges.

Emerging Trends in NLP

Recent developments in Natural Language Processing (NLP) are transforming how machines interact with humans. Two key trends are reshaping the landscape: generative AI’s impact on natural language tasks and the rise of large language models.

Generative AI and the Future of NLP

Generative AI is significantly changing the field of NLP by enabling machines to create human-like text. This technology powers advances in natural language generation, allowing systems to produce coherent and contextually relevant responses.

Chatbots and virtual assistants benefit from these advancements as they can provide more meaningful interactions with users.

The use of AI in content creation is also gaining traction, with systems generating articles, stories, and even complex research papers. This evolution in natural language understanding enhances services like customer support, making them more efficient and personalized.

Importantly, generative AI drives broader applications such as creative writing and report generation, setting the stage for innovative uses across industries.

The Rise of Large Language Models

Large language models (LLMs) are central to current NLP innovations. Models like GPT have demonstrated significant improvements in language understanding and generation.

They leverage vast amounts of data to improve pre-trained models, resulting in more accurate and versatile language applications.

LLMs contribute to advancements in search engines, where improved keyword and context understanding refine search results. Their application in online courses enhances educational experiences by offering personalized, adaptive learning paths.

Research and business sectors also benefit, as these models streamline information processing and analysis, offering a competitive edge through better data insights. This rise positions LLMs as critical tools in the future of NLP.

Frequently Asked Questions

A stack of books with titles on natural language processing, surrounded by question marks and lightbulbs

Understanding Natural Language Processing (NLP) involves exploring various applications and techniques. It includes real-world uses, foundational methods, key learning concepts, self-study strategies, challenges, and how Artificial Intelligence elevates NLP.

What are some practical examples of Natural Language Processing in use today?

NLP is used in many areas like chatbots, virtual assistants, and language translation services. These applications allow computers to understand and respond to human language effectively. Technologies like Siri and Google Translate are popular examples that rely on NLP.

What are the foundational techniques involved in Natural Language Processing?

Key techniques in NLP include tokenization, which breaks down text into smaller parts, and part-of-speech tagging, which identifies the function of words in sentences. Text classification sorts text into categories. These techniques are essential in processing and understanding human language.

What key concepts do you need to understand when starting to learn about Natural Language Processing?

Beginners should grasp concepts like syntax and semantics, which are about the structure and meaning of language. They should also understand machine learning models that help improve NLP applications. Knowledge of these concepts is necessary for a strong foundation in NLP.

Can Natural Language Processing be self-taught, and if so, what resources are recommended?

Yes, NLP can be self-taught. Online courses, textbooks, and tutorials are great resources. Platforms like Coursera and edX offer structured learning paths. Books and articles provide in-depth knowledge and practical exercises to deepen understanding of NLP.

What are the challenges faced when learning about Natural Language Processing for the first time?

One challenge is understanding the complexity of human language, including ambiguity and context. Another challenge is learning about machine learning algorithms, which are critical for developing NLP applications. Overcoming these challenges requires dedicated study and practice.

How is Artificial Intelligence enhancing the capabilities of Natural Language Processing?

Artificial Intelligence is improving NLP by enabling more accurate language models. AI allows for better understanding and generation of human language.

It enhances tasks like sentiment analysis, which determines the emotional tone of text, and improves the overall performance of NLP systems.

Categories
Uncategorized

Learning Pandas for Data Science – Group By Operations Explained

Understanding Pandas and Data Science

Pandas is a powerful tool in data science. It helps with handling data in a straightforward and efficient way. It is crucial for processing, analyzing, and visualizing large data sets. Understanding how Pandas works allows data scientists to manipulate data more effectively.

Fundamentals of Pandas

Pandas is an open-source library in Python. It specializes in data manipulation and analysis. The main structures in Pandas are Series and DataFrame.

A Series is a one-dimensional array, while a DataFrame is a two-dimensional, table-like data structure with labeled axes: rows and columns.

Functions like read_csv() let users easily import data. The head() function provides a preview of data, which is useful for initial inspection. Another popular function is groupby(), which allows for splitting data into groups based on some criteria.

This makes it easier to perform operations like aggregations on large datasets.

Pandas also supports operations like sorting, reshaping, and handling missing data, using functions like sort_values(), pivot(), and fillna(). These features help in cleaning and organizing datasets for analysis.

Role of Pandas in Data Science

In data science, Python’s Pandas is essential due to its robust data handling capabilities. It facilitates data cleaning, allowing scientists to remove duplicates, fill missing values, and filter data efficiently. This ensures data quality before analysis.

Pandas is often used in exploratory data analysis (EDA), where quick computations, summaries, and visualization are vital. It allows for creating plots with plot() when paired with libraries like Matplotlib or Seaborn. This aids in uncovering trends in data.

Pandas also integrates well with other data science libraries like NumPy and SciPy, making it part of a comprehensive data analysis workflow.

It supports data transformation, which is key in preparing data for model training. This makes it indispensable for many tasks in data science.

Getting Started with Group By

Exploring group by operations in Pandas is crucial for data analysis. This involves dividing data into sets and applying functions to achieve insights. Mastering these methods aids in sorting data into meaningful groups for analysis.

Introduction to Group By Operations

Group by operations in pandas involve splitting data into sets according to specific criteria. This is commonly used to perform analysis on large datasets by breaking them into more manageable parts. The operation typically has three steps: splitting the data, applying computations, then combining the results.

This process allows for more efficient and organized data analysis, and is foundational in data science tasks.

One of the most helpful ways to use group by is for aggregation. This involves summarizing data into smaller, understandable sections, like calculating totals or averages.

Knowing how to execute these tasks helps users understand the data’s trends. This is particularly significant in fields requiring pattern recognition, such as sales or scientific research.

Primary Group By Methods

Within pandas, the group by method is often used interchangeably with aggregation functions such as sum(), mean(), and count().

These functions can be applied once the data is grouped, providing essential insights. The aggregate() method allows multiple functions to be applied to specific columns, offering flexibility.

In addition, group by can be enhanced with additional options like size() or describe(). These functions provide detailed statistics to gain deeper insights from the dataset.

For instance, using describe() offers a summary that includes the mean, standard deviation, and percentile scores, enhancing the analytical depth.

Data Preparation for Grouping

Data preparation is a crucial step before performing group by operations in pandas. This process includes cleaning the data and selecting columns that are essential for meaningful analysis. These steps help ensure that the data is organized and ready for effective grouping, leading to accurate results.

Importing and Cleaning Data

Before grouping data, it is vital to import it correctly and clean it thoroughly.

Importing data often involves using pandas functions like read_csv, read_excel, or read_sql to load data into a DataFrame.

Cleaning the data involves handling missing values, removing duplicates, and converting data types where necessary. Functions such as dropna and fillna are commonly used for dealing with NaN values, while drop_duplicates helps in removing repeated entries.

Accurate cleaning ensures the data is reliable and reduces the risk of errors during grouping. Converting data types, like using astype, helps in getting the data into the required format for analysis. This step ensures that operations on numerical and categorical data are performed correctly.

Selecting Key Columns to Group By

Choosing the right columns for grouping is essential as it determines how the data will be aggregated. Columns selected for grouping should align with the analytical goals, such as analyzing sales by product or location.

groupby is the function used in pandas to manage this. The selection of key columns directly impacts the insights gained from the data.

It’s beneficial to look at the data’s structure and identify columns with categorical data suitable for grouping. For example, columns with location, category names, or statuses often serve as good group by keys. Sorting and filtering the DataFrame, alongside checking for consistent labels, help make this selection process more accurate.

Exploring Group By Objects

When using Pandas for data analysis, understanding group by objects is essential. These objects let users divide data into groups and then perform operations on each group. Two main concepts are the attributes of group by objects and how to iterate over them for more detailed analysis.

Group By Object Attributes

Group by objects come with several attributes that give users insight into the structure and meta-data of the groups.

One key attribute is groups, which provides a dictionary mapping group names to row labels. This helps in quickly identifying how data is organized within each group. The attribute ngroups is another useful feature, indicating the total number of groups created during the operation. This helps users understand the level of data segmentation.

The size attribute offers a measure of how many items are in each group, valuable for summarizing and further analysis. The indices attribute maps group names to their row positions, giving detailed access to group members.

These attributes provide a comprehensive view and are essential tools for managing and manipulating data effectively.

Iterating Over Groups

Iterating over groups allows users to perform custom operations. Each iteration gives access to both the group name and the subset of data that belong to it. This makes it possible to apply different functions to each group based on its specific needs.

For instance, one can use a loop to calculate summary statistics unique to each group, such as mean or sum, and store the results separately.

Users can benefit from built-in Pandas capabilities and Python’s language features when iterating. For example, using a for loop to access individual groups not only increases flexibility but also simplifies debugging and validation processes.

Additionally, this approach is excellent for tasks like visualization, where specific plots might be generated for each group, offering clear insights into varied patterns present within the grouped data.

Aggregation and Summarization

Aggregation and summarization are key techniques in data analysis with pandas. They help transform raw data into meaningful insights using methods like grouping and summarizing.

Common Aggregation Functions

Common aggregation functions in pandas include sum(), mean(), count(), min(), and max(). These functions allow users to efficiently calculate sums, averages, counts, minimums, and maximums of data subsets.

For instance, using groupby() with sum() can quickly reveal total sales per product category.

  • Sum: Calculates the total of a group.
  • Mean: Finds the average value.
  • Count: Counts the number of entries.
  • Min/Max: Identifies the smallest or largest value in the dataset.

These functions are powerful when combined with group operations, enabling detailed data analysis.

Custom Aggregation with Apply

For tasks requiring more flexibility, the apply() function allows custom aggregation. Users can define their own functions to apply across grouped data. This is useful for operations not covered by standard functions.

Consider a scenario where a user wants to calculate a weighted average. They can define a custom function and use apply() to execute it on grouped data. This technique also supports complex calculations and the application of different operations on multiple columns simultaneously.

Custom aggregations leverage pandas’ flexibility and power, extending beyond built-in functions to meet specific analytical needs.

Advanced Group By Techniques

Advanced group by techniques in pandas allow for more efficient data analysis. By mastering these methods, users can perform operations like aggregating multiple columns or filtering after grouping, enhancing the depth of their data insights.

Aggregate Multiple Columns

Aggregating multiple columns at once can save time and reduce complexity when analyzing data. In pandas, the groupby() function combined with agg() allows users to apply multiple functions to different columns.

For example, consider a DataFrame with sales data. Using agg(), a user might calculate the total sum of sales in one column, while computing the average discount in another.

The code structure may look like this:

df.groupby('category').agg({'sales': 'sum', 'discount': 'mean'})

This approach is efficient for handling complex data, giving precise control over which functions apply to which columns. This capability is helpful when datasets contain numerous variables that need separate summarization measures.

Filtering After Grouping

Filtering after grouping helps in narrowing down results to the most relevant data. This technique involves first grouping the data, then applying conditions to filter specific groups. Pandas provides versatile functions that can be combined with conditional statements to achieve this.

One way to implement filtering is by using the filter() function after a group by operation. For example, if analyzing a sales dataset, you can filter groups where total sales exceed a threshold.

Here’s a basic example:

df.groupby('category').filter(lambda x: x['sales'].sum() > 1000)

This process allows users to focus on significant subsets of data, removing less relevant information. This is particularly useful in large datasets where only a fraction of the data meets specific criteria. By filtering effectively, users can generate insights that are both actionable and meaningful.

Combining Data Post Grouping

Combining data after grouping in Pandas involves using various operations that enable efficient data handling and analysis. Key techniques include merging, joining, and creating pivot tables, each facilitating a different method of assembling your data into a more useful form.

Merge, Join, and Concatenate

Merging, joining, and concatenating are essential operations for combining datasets in Pandas.

Merging integrates two datasets based on one or more keys, useful when needing to relate rows in different datasets. For example, you can use Pandas’ merge function to combine datasets by aligning matching records across dataframes.

Joining is similar to merging but focuses on combining data based on the index of the datasets. It is ideal when the datasets share common indexes, making data alignment straightforward.

Concatenating stacks datasets vertically or horizontally, helpful for adding new rows or columns to an existing dataset.

With the concat function, dataframes can be combined easily by specifying the axis. This operation is crucial when dealing with split datasets that need integration into a single dataframe.

Pivot Tables and Cross-Tabulation

Pivot tables transform datasets by filtering, sorting, and summarizing data. They restructure the data for easier analysis by rotating data around a pivot, creating multi-dimensional summaries from complex datasets.

In Pandas, the pivot_table function allows users to calculate statistics like mean or sum across specified columns.

Cross-tabulation organizes datasets into a frequency distribution table to identify relationships between variables. This method is particularly useful when analyzing categorical data by summarizing the data into a matrix format.

The crosstab function in Pandas can quickly generate these tables, emphasizing relationships between different categorical variables, enhancing data exploration and interpretation.

Performance Optimization

Optimizing performance in Pandas, especially during group by operations, can significantly speed up data analysis. Key techniques include using categorical data types for efficient memory use and leveraging Cython to enhance execution speed.

Using Categorical Data Types

Categorical data types can greatly improve the performance of Pandas operations. They are ideal for data that has a limited number of unique values, such as gender or country.

By converting a column to a categorical type, memory usage can be reduced and operations can be made quicker.

For instance, consider a DataFrame with a “city” column containing repeated city names. Converting this column to a categorical type allows Pandas to store each unique city name just once.

This not only saves memory but also speeds up computations like group by, since comparisons between categorical data are faster than between strings.

Leveraging Cython with Group By

Cython is a tool that allows the compilation of Python code to C, enhancing the performance of compute-heavy tasks. When dealing with large datasets, Cython can be used to accelerate group by operations in Pandas.

To use Cython, you can rewrite certain functions in a C-like syntax. This approach can be particularly effective for complex operations that involve numerous calculations.

By replacing native Python loops with Cythonized code, you can dramatically reduce execution time.

A practical example would be rewriting a custom aggregation function in Cython for faster processing. This method, while requiring more initial coding effort, often results in significant speed gains during high-volume data processing tasks.

Case Studies

Understanding how to use Pandas for group by operations can help solve real-world data challenges. This section explores how these operations are applied, especially in analyzing vast datasets and interpreting trends effectively.

Real-World Data Analysis Examples

In real-world data analysis, group by operations with Pandas are essential for summarizing and interpreting large datasets. One common use case is in processing survey data, where responses are often grouped by demographics like age or income to determine patterns.

For instance, if a tech company surveys users about software usability, they can group responses by age group. This reveals how different age demographics perceive a product, guiding targeted improvements.

Pandas efficiently handles operations like calculating averages, counting frequency, or finding maximum values, making data insights accessible. It allows businesses to adapt strategies based on meaningful patterns, enhancing decision-making and resource allocation.

E-commerce Sales Analysis

E-commerce platforms heavily rely on group by operations to analyze sales data. By categorizing transactions by product type or customer region, businesses gain valuable insights into their markets.

Consider a scenario where an online retailer uses Pandas to group sales by product category. This helps identify which products perform best during holiday sales, allowing adjustments in marketing strategies or inventory stocking.

Grouping data can reveal trends such as peak buying times or regions with high demand. Understanding these patterns helps e-commerce companies make strategic decisions. By leveraging Pandas’ powerful grouping capabilities, they can enhance customer satisfaction and optimize profits effectively.

Visualizing Grouped Data

Visualizing grouped data helps uncover patterns and relationships that might be hidden in raw data. By using graphical representations, one can effectively communicate findings.

Using Matplotlib and Seaborn

Matplotlib and Seaborn are popular Python libraries for creating visualizations. Matplotlib is a versatile tool for basic plots. Simple bar charts or line graphs can display grouped data. For instance, using a bar chart, they can show sales data per product category.

Seaborn, which builds on Matplotlib, offers advanced features. It provides aesthetic improvements and statistical visuals. Functions like catplot and barplot allow users to visualize data by categories easily.

Seaborn is also noted for handling different data structures with minimal code, and it includes built-in themes that enhance plot readability.

Advanced Visualization Techniques

Beyond basic plots, advanced techniques offer deeper insights. Heatmaps and pair plots are examples. A heatmap can display correlation strengths between groups, using color variations to convey intensity. Pair plots, on the other hand, visualize relationships between multiple variables in a dataset.

Other advanced techniques focus on interactive elements. Tools like Plotly can provide interactivity, allowing viewers to filter groups and explore data dynamically.

Such features not only make visual data analysis more engaging but also help in identifying specific trends within grouped data.

Troubleshooting Common Issues

When working with Pandas’ Group By operations, users often encounter challenges related to missing data and unexpected errors. Addressing these issues improves data analysis accuracy and efficiency. Below are helpful strategies and tips for dealing with these problems.

Handling Missing Data in Groups

Missing data can disrupt group by operations in Pandas. Users should first identify any missing or null values using the isnull() method.

The decision to fill, drop, or forward-fill (using fillna(), dropna(), or ffill()) depends on the context. For numerical data, filling with a mean or median often preserves analytical integrity.

Categorical data might require more context-specific approaches. For instance, using the most frequent category can be effective.

It’s essential to carefully choose the method that best suits the data characteristics to maintain the reliability of analysis.

Debugging Group By Errors

Errors in group by operations often stem from incorrect function use or misunderstanding of data structure. Successful debugging starts with thorough inspection.

Check for typos in method names and ensure parentheses are balanced. Incorrect column names or data types can also lead to issues.

Using Python’s try-except blocks helps catch and manage exceptions without breaking the code flow. Additionally, the print() function provides insights into the intermediate steps and any discrepancies encountered.

Adopting these debugging practices ensures smooth and accurate data processing.

Best Practices and Tips

To excel with the group by operations in Pandas, it’s important to use efficient coding techniques and keep up with the latest developments in the library. This section provides practical strategies to enhance performance and maintain up-to-date knowledge.

Efficient Coding Techniques

Writing efficient code is crucial for using Pandas effectively. Using vectorized operations instead of loops can significantly speed up processes.

This technique takes advantage of Pandas’ built-in operations, which are optimized in C for better performance.

Another tip is to use chaining methods. This technique links several Pandas functions together, resulting in more readable and shorter code. However, make sure that chaining does not impact the clarity of the code.

It’s also beneficial to use built-in Pandas functions, which are typically faster than writing custom functions with apply().

Moreover, dealing with large datasets often requires managing memory efficiently. Techniques like downcasting numerical data types can save memory.

Downcasting changes data types from larger to smaller sizes where possible, such as from float64 to float32, without losing significant precision.

Staying Updated with Pandas Developments

Keeping up-to-date with the latest features and enhancements in Pandas is essential for leveraging new efficiencies.

Following the official Pandas documentation is a good starting point, as it often lists recent updates and improvements.

Participating in the community through forums and platforms like Stack Overflow can help in understanding practical problems and solutions shared by other users.

Engaging with tutorials and webinars from libraries like Practical data science with Python can introduce new ideas and techniques.

Finally, subscribing to newsletters or blogs related to data science and Pandas can provide insights into upcoming release notes and updates, ensuring one is always prepared to make the most of new tools available within the package.

Frequently Asked Questions

A computer screen displaying a data science tutorial on pandas group by operations with charts and graphs in the background

Group By operations in Pandas are crucial for data grouping and analysis. This involves using techniques to sort data by columns and apply functions for aggregation and insight extraction.

How can I perform a ‘group by’ operation on multiple columns in Pandas?

To perform a ‘group by’ on multiple columns in Pandas, use the groupby method with a list of column names. This method groups the data based on unique combinations of values in these columns.

What types of aggregate functions can be applied to a grouped DataFrame in Pandas?

Pandas allows various aggregate functions like sum(), mean(), min(), and max() to be applied to grouped data. These functions help summarize and analyze data effectively, showing trends or patterns.

Can you explain how the Pandas ‘groupby’ method works?

The groupby method in Pandas splits the DataFrame into groups based on the specified criteria. It allows you to apply functions to these groups and combine the results, making it a powerful tool for data manipulation.

How do I use the ‘count’ function with ‘groupby’ in Pandas to analyze dataset frequencies?

Using the count function with groupby lets you determine the number of non-null entries in each group. This is useful when analyzing how frequently certain data points occur within the dataset.

What is the purpose of the ‘agg’ method in Pandas, and how is it used with ‘groupby’?

The agg method in Pandas enables applying multiple aggregate functions simultaneously on a grouped DataFrame. By specifying functions as a list or dictionary, you can tailor the aggregation for various columns.

What is the role of the Pandas Grouper and how is it utilized in grouping operations?

The Pandas Grouper is a helper function that allows more complex grouping operations. It’s often used to group data by time periods, like months or years. This provides a more dynamic approach to data analysis.