Categories
Uncategorized

Learning about Model Deployment: A Comprehensive Guide

Fundamentals of Model Deployment

Deploying machine learning models is a crucial task that transforms models into valuable tools for practical applications. This process involves systematic steps to ensure models are effectively integrated into a production environment.

Understanding Model Deployment

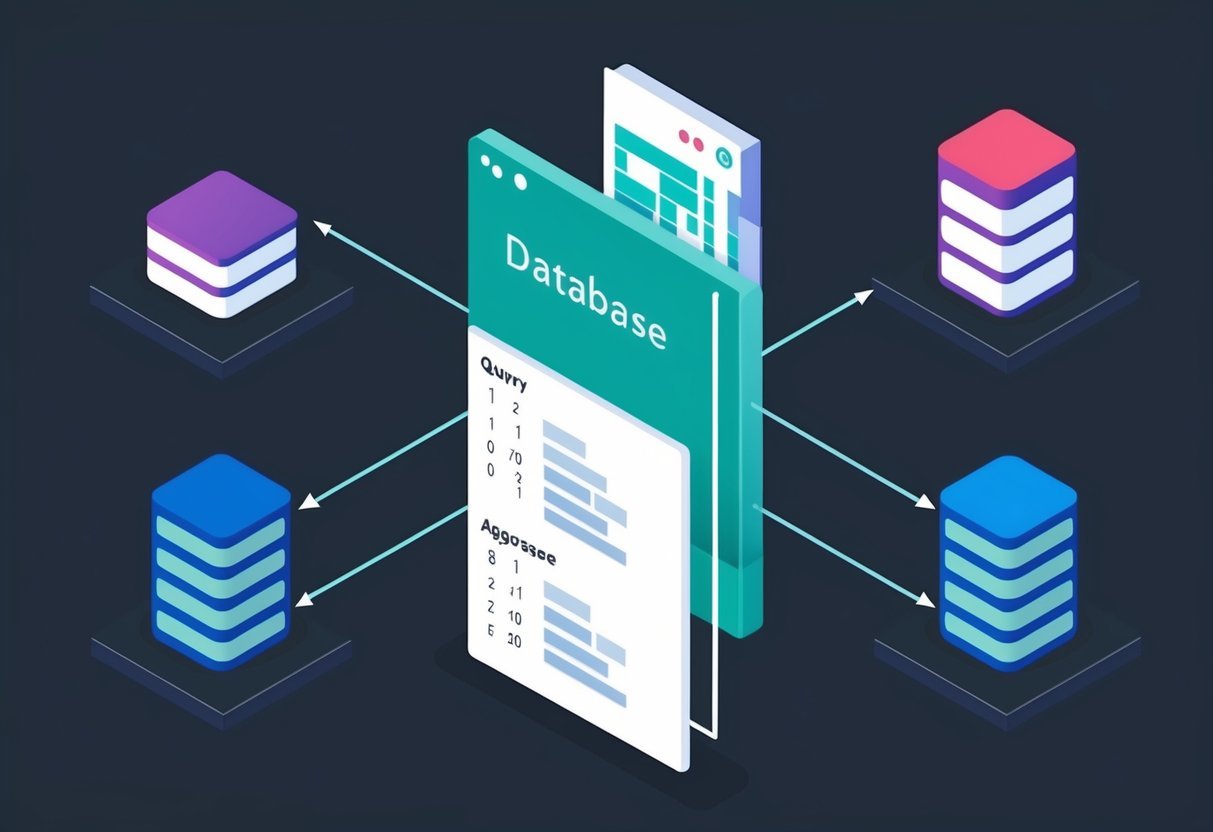
Model deployment refers to the process of integrating a machine learning model into a system where it can provide real-time predictions or decisions. It transforms a model from a theoretical framework into a usable tool in a production environment.

Considering factors such as scalability and reliability is important. The model must also handle numerous requests efficiently.

Different deployment strategies might be used, like deploying on cloud services or embedded systems. Using compatible formats like joblib or pickle for scikit-learn models can be essential for the integration process.

Importance of a Structured Deployment Process

Having a structured deployment process ensures that machine learning models are consistently reliable and useful in real-world applications. This structure supports maintaining models and integrating them smoothly.

Unstructured deployments can lead to problems like performance issues or downtime. Ensuring thorough deployment involves steps like testing model performance in actual conditions and setting up monitoring for unexpected behavior.

Following procedures such as those outlined in guides like this comprehensive guide to model deployment can help mitigate risks and enhance model performance in a production environment.

Model Training and Evaluation

A computer screen displaying a graph with a line steadily rising, surrounded by various charts and data visualizations

Effective model training and evaluation are crucial for deploying successful machine learning models. These steps involve preparing data for training, tuning model settings, and assessing how well the model performs.

Data Preprocessing for Training

Data preprocessing is the first step to ensuring the dataset is ready for model training. This process involves cleaning data to handle missing values and outliers, normalizing data to put features on the same scale, and encoding categorical variables into numerical values.

Techniques like scaling and feature selection improve the accuracy and efficiency of the training process.

Preparing the data properly helps in reducing biases and errors, setting a solid foundation for the model to learn patterns effectively.

Hyperparameter Tuning and Cross-Validation

Hyperparameter tuning is adjusting settings in the model that aren’t adjusted during learning. Choosing the right hyperparameters can significantly impact the model’s ability to generalize and avoid overfitting.

Techniques like grid search and random search are often employed to find the best combination of parameters.

Cross-validation is a method used alongside tuning to validate the model’s performance. By splitting the dataset into parts and training on each subset, it ensures reliability and robustness of results, greatly enhancing model performance.

Evaluating Model Performance

Evaluating model performance involves analyzing how well a model predicts outcomes. Common performance metrics include accuracy, precision, and recall.

While accuracy measures how many predictions are correct, precision focuses on the relevance of true positive results, and recall measures how many relevant instances are captured.

Using diagnostic tools or plots, inconsistencies and errors in the model evaluation process can be spotted.

Analyzing these metrics helps in understanding the model’s strengths and weaknesses, assisting in necessary adjustments for improvement.

Preparing ML Models for Production

When preparing machine learning models for production, it’s important to manage the models effectively to ensure smooth deployment and maintenance. Key areas include using appropriate model packaging techniques and implementing version control with a model registry.

Model Packaging Techniques

Packaging machine learning models involves preparing them for efficient deployment. Common approaches include using ONNX or Joblib formats, which facilitate platform compatibility and compression.

Using Docker containers is another popular method, allowing models to run consistently across different environments. Containers package the model along with its dependencies, simplifying the deployment process.

This approach enhances scalability and reliability.

These techniques help ensure that trained models are portable and can be easily integrated into production environments, improving model execution stability and performance.

Version Control and Model Registry

Managing versions of machine learning models is crucial for tracking changes, updates, and ensuring reproducibility. Version control systems, such as Git, allow developers to maintain a history of model modifications, while versioning provides a structured way to organize them.

Model registries are used to keep track of different versions of models in a centralized location. Registries enable teams to easily access, update, and deploy models. They also facilitate rollback to previous versions if needed, offering better control and security.

By integrating version control with model registries, teams ensure smooth coordination and collaboration, reducing the risk of errors during deployment.

Deployment Strategies

Different deployment strategies ensure a smooth transition from development to production. Each method has its unique approach to handling updates and minimizing risks.

A/B Testing and Canary Deployments

A/B testing and canary deployments help evaluate model changes with real-world data.

In A/B testing, traffic is split between the current version and the new model. This helps in assessing performance differences. It is useful for gathering data over time, though it can be slow for significant results.

Canary deployment offers a faster alternative by releasing the new model to a small user group. If it performs well, more users are gradually transitioned.

This approach minimizes the impact of possible errors, making it a safe option for testing in high-stakes environments. A canary deployment is ideal for quickly verifying new features without affecting all users at once.

Shadow Deployment and Blue-Green Techniques

Shadow deployment allows testing in a non-intrusive manner. A copy of user requests is sent to the new model while the old model continues to serve them. This helps observe how the new model behaves under real conditions without any user impact.

It’s an effective strategy for identifying potential issues before a full deployment.

The blue-green technique uses two environments: one running the current model (blue) and the other hosting the new model (green). A load balancer switches traffic from blue to green once the new model is deemed stable.

This strategy reduces downtime and ensures seamless transitions, making it suitable for critical updates.

Cloud Platforms and Services

Cloud platforms offer robust solutions for deploying machine learning models. They provide scalable infrastructure and tools to manage applications efficiently. AWS, Azure, and Google Cloud are prominent platforms that enable virtual machine deployment and support containerization through Docker and Kubernetes.

Comparing AWS, Azure, and Google Cloud

Amazon Web Services (AWS), Microsoft Azure, and Google Cloud dominate the cloud services market.

AWS provides a broad set of services with its Elastic Compute Cloud (EC2) and scalable infrastructure. Azure is known for its seamless integration with Microsoft products, offering services like Azure Machine Learning for easy deployment. Google Cloud emphasizes AI capabilities through its Google AI Platform and data analytics solutions.

All three platforms prioritize security, scalability, and performance.

AWS is often seen as a leader due to its expansive ecosystem. Azure stands out for users invested in the Microsoft stack, while Google Cloud is preferred for AI and data-driven workflows.

Deploying on Cloud Virtual Machines

Virtual machines (VMs) provide flexible environments for model deployment.

AWS EC2 instances offer the ability to run models with customizable resources and pricing options. Microsoft Azure’s virtual machines effectively integrate with existing infrastructure, allowing for efficient deployment and management. Google Cloud’s virtual machines are known for their scalability and integration with other Google Cloud services.

VMs allow teams to maintain control over the environment and resources, making them ideal for applications with specific configuration needs. They support different operating systems and can be scaled as demand grows, providing an effective way to manage workloads.

Containerization with Docker and Kubernetes

Docker and Kubernetes are key to modern cloud deployments.

Docker allows packaging applications into containers that include all dependencies, ensuring consistency across environments. Kubernetes automates deploying, scaling, and managing containerized applications, offering features like load balancing and self-healing.

AWS supports containerization through services such as Elastic Kubernetes Service (EKS), while Google Cloud offers Cloud Build for seamless integration with containers. Azure provides Azure Kubernetes Service (AKS) for efficient management.

Utilizing these technologies simplifies application deployment and increases reliability.

Building Deployment Pipelines

Building deployment pipelines involves structuring processes for deploying machine learning models with efficiency and reliability. Key elements include ensuring reproducibility and automating tasks to streamline the deployment.

Continuous Integration and Deployment (CI/CD)

Continuous Integration and Continuous Deployment (CI/CD) are critical in maintaining a fluid workflow for machine learning projects.

CI/CD aims to ensure that code changes are automatically tested and integrated into the main codebase. By doing so, it minimizes errors and maintains consistency across different stages.

A CI/CD pipeline allows for seamless transitions from development to production environments. Tools like GitLab and Travis CI can be used to automate testing and deployment.

This process ensures that model updates are integrated promptly, reducing downtime and avoiding manual errors.

Automation with Jenkins and MLOps Tools

Automation is vital for deploying models efficiently.

Jenkins is a popular tool that helps automate the steps in the deployment pipeline. It can be configured using a Jenkinsfile to outline the series of steps required to deploy a model.

MLOps tools, such as MLflow, provide additional support by managing the lifecycle of machine learning models. These tools track model versions, parameters, and metrics, facilitating robust and consistent deployments.

MLOps integrates with CI/CD processes, enhancing the deployment pipeline with capabilities of reproducibility and traceability, which are essential for managing complex systems.

Monitoring Model Performance in Production

A computer screen displaying a dashboard with various performance metrics and graphs, surrounded by multiple servers and data storage units in a dimly lit server room

Ensuring models perform well in production is crucial for maintaining their effectiveness and reliability. This involves tracking key metrics, handling changes in data patterns, and maintaining consistent logs for evaluation.

Performance Metrics and Regular Evaluation

Tracking performance metrics is vital for assessing a model’s effectiveness. Common metrics include accuracy, precision, and recall. These help determine if the model meets predefined goals.

ML engineers should set performance baselines and routinely check if metrics stay within acceptable ranges. Regular evaluation allows for quick responses to any decrease in performance, ensuring models remain reliable and relevant in dynamic production environments.

Handling Data Drift and Retraining Models

Data drift occurs when the input data that models receive changes over time. This can lead to decreased performance.

Identifying data drift early is crucial. Techniques like statistical tests and monitoring input feature distributions help detect these shifts.

When drift is identified, retraining models with updated data is necessary to ensure performance remains high. Continuous adaptation helps maintain model accuracy and relevance.

Monitoring and Logging for Reliability

Reliable logging and monitoring systems are essential in tracing any issues models might encounter.

Comprehensive logs provide insights into model decisions and can highlight discrepancies or failures. Monitoring tools can alert ML engineers to unusual behavior.

This proactive approach allows for timely interventions, minimizing downtime, and maintaining trust in model performance. Robust monitoring ensures the system continues to operate smoothly, even as conditions evolve.

Scaling and Managing Deployed Models

In today’s fast-paced digital world, scaling and managing deployed models are crucial to ensure reliability and scalability.

This involves using techniques like auto-scaling for efficiency and resource management for high availability.

Load Balancing and Auto-Scaling

Load balancing is essential to distribute incoming traffic across multiple servers, ensuring no single server becomes a bottleneck.

By doing this, it enhances the overall reliability and ensures consistent user experience.

Modern systems often employ load balancers that can dynamically adjust traffic distribution based on current demand and server health.

Auto-scaling complements load balancing by automatically adjusting the number of running instances based on traffic loads.

This is crucial in maintaining application performance during peak times without manual intervention.

With tools like Kubernetes or AWS Auto Scaling, companies can ensure that their machine learning models handle changes in demand efficiently.

This adaptability is key to providing seamless service while optimizing resource use.

Resource Management for High Availability

Effective resource management is vital for maintaining high availability and reducing downtime.

This involves strategically distributing resources to ensure all critical components have what they need to function optimally.

Technologies like Kubernetes offer features for managing containerized applications, allowing fine-tuned resource allocation and scalability.

Ensuring high availability also requires redundancy measures. This might include deploying models across multiple geographic locations or using a failover system.

Redundant systems can quickly take over if one fails, minimizing disruptions.

Regular maintenance and updates are also essential to address vulnerabilities and optimize performance.

This proactive approach supports continuous operation and reliability for deployed models.

APIs for Model Deployment

A computer screen displaying code for model deployment, surrounded by open books and a notepad with handwritten notes

APIs play a crucial role in deploying machine learning models by enabling smooth integration with applications. Developers commonly use frameworks like Flask and FastAPI to build these APIs.

It is also important to consider API versioning and latency requirements to ensure optimal performance.

Building APIs with Flask and FastAPI

Flask and FastAPI are popular choices for creating APIs to deploy machine learning models.

Flask is a lightweight framework that offers simplicity and flexibility. It allows easy setup and configuration of endpoints to handle data input and prediction output.

Flask is ideal for small and medium-sized applications due to its ease of use and extensive documentation.

FastAPI is another powerful tool, known for its speed and support of asynchronous programming. It automatically generates interactive API documentation, making collaboration easier.

FastAPI is preferred for applications requiring high performance, as it excels in scenarios with multiple concurrent requests.

By choosing the right framework, developers can effectively deploy their models through stable and scalable APIs.

API Versioning and Latency Requirements

API versioning is important for maintaining backward compatibility as models evolve.

This involves assigning version numbers to API endpoints, allowing stable interaction even if the model changes.

When releasing updates, developers keep previous versions active to avoid disrupting users relying on older versions.

Meeting latency requirements is essential for user satisfaction, especially for real-time applications.

Developers should minimize response times by optimizing code and infrastructure.

This could mean using faster frameworks like FastAPI or scaling resources to handle increased loads.

By considering both versioning and latency, API deployment can effectively support evolving models and user demands.

Security and Compliance

In deploying machine learning models, security and compliance are crucial for protecting data and meeting legal standards. Understanding regulations like GDPR and implementing security practices ensures the integrity of machine learning systems.

Implementing Compliance Measures like GDPR

Compliance with regulations like GDPR is vital.

GDPR requires organizations to protect personal data and ensure data privacy. Machine learning systems must manage data responsibly by anonymizing personal data and obtaining clear consent for its use.

Data controllers need to provide transparency about data collection and usage.

Organizations should also implement measures to allow data subjects to access, rectify, or erase their data.

Regular compliance audits and assessments are essential to ensure that all practices align with regulatory requirements.

Failure to comply with these regulations can lead to significant fines and damage to the organization’s reputation.

Auditing and Security Best Practices

Auditing is a key aspect of maintaining security in machine learning deployments.

Regular audits help identify vulnerabilities and ensure that security measures are up-to-date.

Implementing access controls, like user authentication and role-based access, reduces unauthorized access risks.

Encryption is another necessary practice. Data encryption both at rest and in transit helps prevent data breaches.

Continuous monitoring of systems allows for early detection of any irregular activities.

It’s important to establish a clear incident response plan to address security incidents effectively.

Furthermore, using curated Docker images ensures consistency and security in deployment environments.

Being proactive about security and regular auditing will safeguard data integrity and user trust.

Frequently Asked Questions

A computer screen showing a webpage with a list of frequently asked questions about model deployment, surrounded by open books and a pen

Deploying a machine learning model involves several steps such as choosing the right tools, understanding the deployment environment, and applying best practices. Free deployment options and specific platforms like Streamlit are also popular among developers for practical applications.

What are the key steps involved in deploying a machine learning model in Python?

The key steps include training the model, saving it using formats like joblib or pickle, and choosing a deployment framework such as Flask or FastAPI.

These frameworks help integrate the model into a web service, making it accessible to end users.

How can you deploy a machine learning model for free?

Free deployment options include platforms like Heroku and Streamlit Sharing.

These platforms allow users to host their applications without incurring charges, though they might have limits on resources such as server uptime or bandwidth.

What are the best practices for implementing model deployment in artificial intelligence?

Best practices include monitoring the model’s performance, ensuring data privacy, and being prepared for maintenance and updates.

It is crucial to test in different environments and have rollback plans in case of failures.

Can you provide an example of deploying a machine learning model with Streamlit?

Deploying with Streamlit involves creating an interactive web application.

The model can be integrated into a Streamlit app using Python scripts.

This makes it easy to showcase data visualizations and receive user input, which can be found in detail on platforms like GeeksforGeeks.

What is the primary objective during the model deployment phase in machine learning?

The primary objective is to ensure the model is accessible and performs well in real-world environments.

This involves setting up infrastructure to handle user requests efficiently and maintaining reliability under various conditions.

What considerations are important when deploying a machine learning model on a website?

Key considerations include security, scalability, and latency.

The model must be secure from unauthorized access, able to scale with user demand, and fast enough to provide timely responses to user inputs.

Categories
Uncategorized

Machine Learning – Classification: K-Nearest Neighbors Simplified Analysis

Fundamentals of K-Nearest Neighbors

The K-nearest neighbors (K-NN) algorithm is a popular method used in both classification and regression. This algorithm is part of supervised machine learning, which involves learning from labeled data to predict an outcome for new data points.

Understanding K-NN Algorithm

The K-NN algorithm operates by identifying the ‘k’ closest data points, or neighbors, in a dataset. These neighbors are used to determine the classification or value of a new data point. The algorithm is non-parametric, meaning it makes no assumptions about the data distribution.

It is important in pattern classification as introduced by Fix and Hodges in 1951. The value of ‘k’ affects the model’s accuracy and complexity. A smaller ‘k’ is sensitive to noise, while a larger ‘k’ provides smoother decision boundaries. Choosing the right ‘k’ is vital for optimizing the performance of K-NN.

Supervised Machine Learning Basics

Supervised machine learning relies on learning from a training dataset that includes input-output pairs. The K-NN algorithm fits within this framework because it requires a labeled set of data. It learns by example, which allows it to make decisions about unclassified data.

K-NN is an example of how algorithms in supervised learning need past data to predict future outcomes. It learns by finding similarities between the new data point and its nearest neighbors in the training data. This simplicity makes it a straightforward method to apply but also places importance on selecting representative trial data.

Classification vs. Regression

In K-NN, classification and regression differ in their purpose. Classification aims to predict categorical outcomes. For K-NN classification, the majority class among neighbors determines the class label of new data.

On the other hand, regression focuses on predicting continuous values. In K-NN regression, the average or weighted average of the nearest neighbors is used to estimate the value. Both tasks showcase the adaptability of the K-NN algorithm in handling various types of prediction problems, emphasizing its role in machine learning.

Preparing the Data Set

Preparing a data set involves several important steps to ensure accurate and efficient machine learning classifications using the K-Nearest Neighbors (k-NN) algorithm. The process includes handling missing data and choosing the right features, as well as normalizing the data for consistency.

Data Preprocessing Steps

Preprocessing is crucial for cleaning the data set before using it for training. This step involves collecting data points from various sources and organizing them into a structured format.

Steps include:

  • Removing duplicates: Ensure each data point is unique to prevent bias.
  • Cleaning data: Eliminate any irrelevant information that may affect the model.
  • Splitting data: Divide into training and testing subsets, typically in a 70-30 ratio, to evaluate performance.

These steps improve the efficiency and accuracy of the classification model by providing a consistent and relevant data set.

Feature Selection Techniques

Figuring out which features are important is key to building an effective model. Feature selection reduces the number of input variables to make the classification process faster and more accurate.

Common techniques include:

  • Filter Methods: Use statistics to rank features by importance. Techniques like correlation and chi-square test fall under this category.
  • Wrapper Methods: Involve using a subset of features to train a model and evaluate performance. Techniques like recursive feature elimination are popular here.
  • Embedded Methods: Perform feature selection as part of the model training process. Examples include decision tree algorithms, which select features based on their importance to the model’s accuracy.

Choosing the right features ensures that the model focuses on the most relevant data points.

Handling Missing Data

Missing data can lead to inaccurate predictions if not addressed properly. There are various strategies to handle this issue, each depending on the nature and extent of the missing data.

Methods include:

  • Deletion: Remove instances with missing values if they form a small portion of the data set.
  • Imputation: Replace missing values with meaningful substitutes like the mean, median, or mode of the feature.
  • Predictive Modeling: Use other data points and features to predict the missing values. Techniques like regression models or nearest neighbors can be useful here.

Properly managing missing data is essential to maintain the integrity and effectiveness of the data set.

Normalizing Data

Normalization scales the data into a consistent range, typically between 0 and 1, to ensure all features contribute equally to the distance calculations used in k-NN.

Key normalization techniques:

  • Min-Max Scaling: Rescales features to a range with a minimum of 0 and maximum of 1.
  • Z-Score Normalization: Standardizes data by scaling based on standard deviation and mean.
  • Decimal Scaling: Moves the decimal point to make values fall within a specified range.

Normalization is necessary when features in the data set have different units or scales, ensuring that calculations for k-NN are fair and reliable.

K-NN Algorithm Implementation

The K-Nearest Neighbors (K-NN) algorithm involves identifying the closest data points to make predictions. Implementing it involves using programming libraries to manage data efficiently, including setting parameters like the number of neighbors.

Developing a K-NN Model in Python

Developing a K-NN model in Python requires understanding basic coding and data structures. First, import relevant libraries like numpy for numerical operations and pandas for handling datasets.

Next, load and preprocess data, ensuring any inconsistencies are handled. Then, assign variables for features and labels. After that, split the data into training and test sets.

Use the numpy library to calculate the Euclidean distance between data points. Finally, decide the optimal number of neighbors. This step is crucial for accuracy, often involving visualizing accuracy trends via matplotlib to find the point where additional neighbors do not improve results.

Using Scikit-Learn Library

The Scikit-Learn library simplifies implementing the K-NN algorithm due to its robust set of tools.

Start by importing KNeighborsClassifier from sklearn.neighbors. Prepare your dataset, similar to other machine learning tasks, by cleaning and normalizing data.

Then, create a K-NN model instance using KNeighborsClassifier(n_neighbors=k), choosing k based on cross-validation or domain knowledge.

Fit the model to the training data with the fit method. Then, evaluate the model using the predict method on the test data to assess its performance.

Scikit-Learn also offers methods to calculate accuracy, helping to fine-tune the number of neighbors after reviewing initial results.

Distance Metrics in K-NN

In K-Nearest Neighbors (K-NN), choosing the right distance metric is crucial as it affects the accuracy of the model. Different datasets may require different metrics to ensure the most accurate classification.

Euclidean Distance and Its Alternatives

Euclidean distance is the most common measure used in K-NN. It calculates the straight-line distance between two points in a multi-dimensional space. It is suitable for datasets where the underlying data is continuous and has similar scales.

Manhattan distance, also known as L1 distance, measures the distance by the absolute differences across dimensions. It is useful for grid-like data, where movements are along axes.

Minkowski distance is a generalization of both Euclidean and Manhattan distances. It is defined by a parameter ( p ). If ( p=2 ), it becomes Euclidean; if ( p=1 ), it converts to Manhattan.

Hamming distance is used for categorical data, measuring the number of differing elements between two strings. It is effective in scenarios where data points are considered as strings or bit arrays.

Choosing the Right Distance Measure

Selecting a distance measure depends on the nature of the dataset. Euclidean distance is ideal for continuous variables that exhibit consistent scaling. However, when dealing with categorical data or variables on different scales, using alternative metrics like Manhattan or Hamming may result in better performance.

A study on distance function effects for k-NN classification highlights that the choice of metric can significantly impact the accuracy of the classification. Testing multiple metrics, such as robust distance measures, is recommended to identify the best fit.

In some cases, combining different metrics could also enhance the model’s accuracy. Utilizing cross-validation can help find the optimal distance measure, tailored to specific data characteristics, thereby improving K-NN’s effectiveness.

Optimizing the ‘K’ Value

Choosing the right ‘K’ value in K-Nearest Neighbors (KNN) impacts accuracy and performance. Different methods help fine-tune this parameter to enhance predictions.

Cross-Validation for Parameter Tuning

Cross-validation is vital for determining the optimal ‘K’ in KNN. The process involves splitting data into subsets to evaluate model performance. By testing various ‘K’ values across these subsets, one can identify an optimal value that balances bias and variance.

K-fold cross-validation is commonly used, where the data is divided into ‘K’ parts. Each part is used as a validation set while the others form the training set. This method ensures the model isn’t overfitting and provides a reliable ‘K’ for better accuracy.

Effective parameter tuning through cross-validation leads to more generalizable models and improved predictions.

The Impact of K on Model Performance

The choice of ‘K’ significantly affects KNN’s model performance. A small ‘K’ may lead to overfitting, capturing noise in the data, while a large ‘K’ may cause underfitting, overlooking important patterns.

Using majority voting, KNN bases its predictions on the most common class among the nearest neighbors. As ‘K’ changes, so does the influence of individual data points on this decision. A sweet spot ensures that minority classes are not overshadowed in majority vote calculations.

Selecting an appropriate ‘K’ can maintain a balance, ensuring the model accurately reflects underlying patterns without being too sensitive to noise. Making informed adjustments to ‘K’ ensures robust and dependable model outcomes.

Avoiding Common Pitfalls

When using the K-Nearest Neighbors (KNN) algorithm, several challenges can arise. These include dealing with outliers and noisy data, managing overfitting and underfitting, and addressing the curse of dimensionality. Handling these issues carefully improves model performance and reliability.

Handling Outliers and Noisy Data

Outliers and noisy data can skew results in KNN classification. It’s crucial to identify and manage these anomalies effectively.

Data preprocessing steps, like removing or correcting outliers and smoothing the data, are essential. For instance, using z-score normalization or interquartile ranges (IQR) can help identify outliers.

Noise in data can affect the distance calculations in KNN, leading to misclassification. Implementing techniques like data smoothing and error correction can enhance results. Consider using robust algorithms or transforming the features to reduce noise impact.

Overfitting and Underfitting

Overfitting occurs when a model performs well on training data but poorly on unseen data. This can happen when K in KNN is too low, causing the model to capture noise. To counteract this, increase the K value to allow more neighbors to influence the decision.

Underfitting means the model is too simple, failing to capture data patterns. Here, K is too high, leading to a biased model. Lowering K can make the model sensitive enough to reflect data trends better. Cross-validation is helpful in finding the optimal K value, balancing bias and variance effectively.

The Curse of Dimensionality

The curse of dimensionality refers to the challenges that arise as the number of features increases. In KNN, this can lead to a significant decrease in model performance because distance measures become less meaningful in high dimensions.

Dimensionality reduction techniques like Principal Component Analysis (PCA) can help alleviate this problem by reducing the feature space.

It’s also important to perform feature selection to include only the most relevant features. By reducing the number of irrelevant dimensions, the model’s performance can be improved. This also avoids unnecessary complexity and ensures faster computation.

Analyzing K-NN Results

K-Nearest Neighbors (K-NN) is a simple yet powerful classification tool. Understanding how it draws decision boundaries and measures accuracy can enhance its effectiveness in predictions.

Interpreting Decision Boundaries

Decision boundaries in K-NN are influenced by the chosen value of k, determining how the algorithm classifies data points. A smaller k results in more complex and flexible boundaries, potentially capturing subtle patterns but also increasing the risk of overfitting.

Conversely, a larger k tends to create smoother boundaries, better generalizing data but possibly missing finer patterns.

Visualizing these boundaries is crucial. Graphically representing them can help identify misclassified points and regions where model performance is weak.

The boundaries affect the prediction of unknown data points, determining which class they belong to based on the nearest neighbors.

Measuring Accuracy and Probability

Accuracy evaluation in K-NN involves comparing predicted class labels with actual labels. A confusion matrix can outline true positives, false positives, true negatives, and false negatives, providing a comprehensive look at performance.

The calculation of metrics like precision, recall, and F1-score further refines this assessment.

Probability estimation in K-NN involves analyzing how frequently a point is classified into a particular category by its neighbors. This probability gives an idea of the confidence in predictions.

While K-NN itself provides deterministic class labels, the relative distances of neighbors offer insight into the likelihood or probability of a data point belonging to various classes.

Practical Applications of K-NN

K-Nearest Neighbors (K-NN) is a versatile algorithm used in many real-world applications. Its ability to adapt to different data types makes it valuable in areas like recommender systems, finance, cyber security, and data mining.

Recommender Systems and Finance

In recommender systems, K-NN is crucial for predicting preferences by analyzing user behavior and item similarities. Retailers and streaming services use recommendation engines to suggest products and content. These engines compare customer profiles to identify items a user might like.

In finance, K-NN assists in risk assessment and stock price predictions. It evaluates historical data to identify similar market conditions or investor behaviors.

This allows investors to make informed decisions based on past patterns, increasing the chances of successful investments.

Intrusion Detection in Cyber Security

K-NN plays a significant role in intrusion detection to protect computer networks. By classifying network activities as normal or suspicious, it helps identify threats early.

The algorithm scans data traffic, comparing it to known intrusion patterns to spot anomalies.

This method is effective in recognizing both known and unknown threats. It adapts easily to changes in network behavior, making it a preferred choice for organizations to safeguard sensitive information and maintain system integrity as cyber threats evolve.

Pattern Recognition in Data Mining

K-NN is widely used in pattern recognition within data mining. It segments data into groups based on characteristics, facilitating tasks like image classification and handwriting recognition.

By evaluating the proximity of data points, K-NN identifies patterns that might otherwise be missed.

This approach is beneficial for uncovering trends in large datasets, helping businesses and researchers to comprehend complex data structures. It’s highly valued in fields like healthcare and marketing, where understanding patterns quickly and accurately can lead to critical insights and innovations.

The Role of K-NN in Data Science

K-nearest neighbors (K-NN) is a simple yet powerful classification model used in data science. Learn about its role among machine learning models and how it offers a practical way for hands-on learning for aspiring data scientists.

K-NN’s Place Among Machine Learning Models

K-NN stands out as one of the simplest machine learning models, relying on distance metrics to classify data. It classifies data points based on the majority label of their nearest neighbors.

Despite its simplicity, K-NN is effective for both classification and regression tasks. It is particularly useful in scenarios where the relationships between data points are not easily defined by mathematical equations.

In data science, K-NN is often applied when datasets are small and computation power is high, as it requires storing the entire training dataset in memory. Its effectiveness depends on the choice of k, the number of neighbors considered, and the distance metric used.

For further reading on K-NN’s applications, explore the review of k-NN classification.

Hands-On Learning for Aspiring Data Scientists

K-NN’s straightforward implementation makes it ideal for hands-on learning. Aspiring data scientists can easily understand its mechanism, from loading data to classifying it based on proximity.

By engaging with K-NN, learners develop a fundamental understanding of pattern recognition and decision-making processes.

Practical use of K-NN includes medical data mining, where classification of patient data helps in diagnosis. This real-world application bridges learning and practical execution, allowing students to see immediate results.

More about its application can be found in the context of medical data mining in Kenya. This approach fosters a deeper comprehension of both theoretical and application-based aspects of data science.

Advanced Topics in K-NN

K-Nearest Neighbors (K-NN) is not only used for classification but also adapted for various advanced tasks. Methods like weighted K-NN enhance prediction accuracy, and adaptations make K-NN suitable for regression.

Weighted K-NN for Enhanced Predictions

In traditional K-NN, each of the k nearest data points contributes equally to predicting a new data point’s classification. Weighted K-NN improves this by assigning different weights to neighbors based on their distance from the query point.

The closer a neighbor, the higher the weight assigned. This method increases prediction accuracy by prioritizing neighbors that are more similar to the query point.

To implement weighted K-NN, commonly used weighting functions include inverse distance weighting. This means that a closer neighbor in the dataset will have a larger impact on the outcome.

This approach allows for more nuanced classification and is particularly effective in datasets where points are unevenly distributed.

Adapting K-NN for Regression Tasks

While K-NN is typically associated with classification, it can be adapted for regression tasks. In regression, the goal is to predict a continuous target value rather than a class label.

K-NN for regression calculates a prediction value by taking an average of the target values from the k nearest neighbors.

This adaptation requires careful selection of k, as it can significantly impact the prediction accuracy. Additionally, employing a weighted approach, like in weighted K-NN, where closer neighbors have more influence, can refine predictions.

Implementing these strategies allows K-NN to handle regression tasks effectively, expanding its usability in different data science applications.

Performance and Scalability

Understanding how K-Nearest Neighbors (K-NN) performs and scales is vital for tackling big data challenges. Key factors include algorithm efficiency for large datasets and optimization methods like approximate nearest neighbors.

Efficient K-NN Algorithms for Big Data

Efficient algorithms are essential when using K-NN with large datasets. K-NN, known for its simplicity, faces challenges with scalability due to the need to compare each new data point with the entirety of the training dataset.

In big data contexts, improvements in algorithm design help tackle these issues.

Optimizations can include parallel processing and distributed computing. For instance, systems like Panda provide extreme scale parallel implementation.

Techniques such as k-d trees or ball trees also help by reducing the number of comparisons necessary, thus increasing speed.

Optimizing with Approximate Nearest Neighbors

Approximate Nearest Neighbors (ANN) is a strategy employed to enhance the performance of K-NN in large-scale applications. It focuses on increasing speed by trading off some accuracy for much faster query response times.

Techniques like locality-sensitive hashing can efficiently determine similar data samples in high-dimensional spaces.

These algorithms balance maintaining result accuracy while dramatically improving scalability and processing times.

This approach is particularly useful for machine learning tasks requiring rapid classification, exemplified by implementations like FML-kNN, which achieve scalability without drastically compromising performance accuracy, making it practical for real-world big data applications.

Frequently Asked Questions

K-nearest neighbor (KNN) is a simple yet effective machine learning method for classification. It works by examining the closest data points to a query point and deciding its class based on these neighbors.

How does the k-nearest neighbor algorithm classify new data points?

The KNN algorithm classifies new data points by looking at the closest ‘k’ neighbors in the training set. It assigns the most common class among these neighbors to the new data point.

If there are four neighboring points and two belong to class A while the other two belong to class B, the point might be assigned randomly or based on additional rules.

What steps are involved in preparing data for a KNN classifier?

Data preparation involves several steps. First, it’s important to handle missing values and outliers.

Next, features should be normalized or standardized to ensure that the algorithm accurately assesses distances between data points.

Finally, preparing the data involves dividing it into training and testing sets.

How do you choose the optimal value of ‘k’ for KNN?

Choosing the best value for ‘k’ is crucial for KNN performance. This is often done using a process like cross-validation.

A smaller ‘k’ may be more sensitive to noise, while a larger ‘k’ can smooth the classification boundaries. A good practice is to try different ‘k’ values and select the one with the best accuracy on a validation set.

What are the common distance measures used in KNN for assessing similarity?

KNN often uses distance measures to determine how similar or different data points are. Common measures include Euclidean distance, which calculates the straight-line distance between points, and Manhattan distance, which sums the absolute differences along each dimension.

Cosine similarity is sometimes used when the data is sparse or represents frequency counts.

How does feature scaling impact the performance of a KNN classifier?

Feature scaling is critical for KNN because the algorithm relies on distance calculations. Without scaling, features with larger ranges can dominate distance computations, leading to biased results.

Scaling ensures all features contribute equally to the distance measure, improving accuracy.

What are the advantages and limitations of using a KNN algorithm for classification tasks?

KNN is simple and intuitive. It requires no assumptions about data distribution and adapts well to different problems. However, it can be computationally expensive with large datasets. This is due to the need to compute distances for each prediction. Additionally, it may be sensitive to irrelevant or redundant features, making accurate feature selection important.

Categories
Uncategorized

Learn About Finding Exceptions to the Rules: Master the Skills for Unique Situations

Understanding Exceptions in English Grammar

In English grammar, exceptions challenge learners by breaking standard rules. These irregularities, such as verb tense exceptions and unexpected noun forms, can confuse learners and lead to common mistakes.

Recognizing these exceptions is crucial to mastering English effectively.

Grammar Rules vs. Inconsistencies

English grammar is filled with rules that seem straightforward, yet there are numerous inconsistencies. These can manifest in unexpected plural forms, like “children” instead of “childs,” illustrating non-standard patterns.

Many learners struggle with common mistakes due to these irregular forms. They can be found in both spelling and sentence structure. While rules exist, many words don’t follow the expected patterns, leading to frequent errors among students and even native speakers.

Practicing various examples helps in understanding these tricky forms.

Irregular Verb Tenses

Irregular verb tenses are a major area where English has many exceptions. Unlike regular verbs, which add -ed for past tense, irregular verbs like “go” change to “went.” Similarly, “run” becomes “ran,” deviating from regular tense patterns.

These verbs are challenging because there is no standard rule to apply. Learners must memorize these forms to use them correctly.

The present progressive tense might seem straightforward, but some verbs, like “lie” (as in lying down), change in unexpected ways. Lists and practice exercises focusing on these irregularities can significantly help improve accuracy and fluency in English.

Irregularities such as these are a common source of confusion, but recognizing and practicing them will help in mastering complex aspects of English grammar.

Decoding Spelling Anomalies

Spelling presents unique challenges, especially when familiar rules encounter baffling exceptions. The focus here is on some specific exceptions that can trip up spellers. These peculiarities include the tricky “I before E” rule and complications with silent letters.

Navigating I Before E

The “I before E” rule is a common guideline taught to help with spelling. It goes: “I before E except after C.” This pattern works in words like “believe” and “grief,” where the ‘I’ comes before the ‘E’.

Yet, there are many exceptions. Words such as “weird” and “seize” defy the rule outright. Moreover, when the ‘ei’ makes a long ‘a’ sound, as in “vein” or “eight,” the rule adapts.

Even with these exceptions, the guideline remains a useful tool for many English words.

To remember exceptions, some students find it helpful to create lists of common exceptions and review them regularly. Becoming familiar with these examples enhances spelling skills and helps learners become more adept at spotting patterns and deviations.

Unpacking Silent E Complications

The silent ‘e’ can alter the pronunciation of preceding vowels, typically making them long. It changes the sound of words like “hat” into “hate” by lengthening the vowel. However, spelling isn’t always straightforward due to silent ‘e’.

In some cases, the silent ‘e’ is present simply due to English spelling conventions without influencing pronunciation. For instance, words like “dance” or “fence” keep the ‘e’ without altering the sound.

This peculiarity adds depth to learning spelling rules. Recognizing when a silent ‘e’ impacts pronunciation and when it doesn’t is crucial for mastering spelling anomalies. Such awareness helps learners navigate the English language’s complexities confidently.

Pronunciation Exceptions in English

The English language often presents challenges when pronunciation does not align with the expected spelling. These exceptions can impact reading comprehension and make learning to speak English more difficult.

When Phonetics Challenge Spelling

In English, certain words feature sounds that are not immediately obvious from their spelling. For example, the “gh” in “though” is silent, deviating from its usual hard “g” sound in other words like “ghost.” Similarly, “knight” begins with a silent “k.”

The ng combination can also showcase exceptions. Commonly pronounced as a nasal sound in words like “king,” it sometimes separates into distinct “n” and “g” sounds, as found in “longer.”

These irregularities can affect reading comprehension, requiring speakers to memorize unique pronunciations rather than rely solely on phonetic rules. Understanding these exceptions is crucial for accurate pronunciation and effective communication in English.

Exception Patterns and Usage

Exceptions often highlight scenarios where rules don’t apply as expected. Understanding how certain exceptions can confirm the existence or importance of a rule adds depth to that rule’s application.

Recognizing the Exception that Proves the Rule

The phrase “the exception that proves the rule” suggests that if an exception exists, it indicates a rule is in place. For example, road signs like “No Parking on Sundays” suggest that parking is allowed other days, confirming a general rule.

In programming, understanding exceptions is critical. When a code segment bypasses typical behavior to address specific issues, it highlights important rules governing usual operations. This can involve rejecting invalid input or handling edge cases in software development.

For developers, recognizing these patterns can improve error handling and guide the refinement of underlying rules and assumptions. In essence, observing exceptions allows one to better understand and implement the core rules effectively.

Reference Resources for English Exceptions

When dealing with English grammar and spelling exceptions, learners often benefit from tapping into established resources. These tools provide valuable guidance on rules and their notable exceptions, crucial for both native speakers and language learners.

Leveraging the Oxford English Dictionary

The Oxford English Dictionary (OED) is an essential tool for anyone grappling with English grammar and spelling exceptions. This comprehensive resource not only lists words and definitions but also notes irregular usage and rare exceptions.

For example, the OED can clarify the use of gerunds, such as identifying “running” as a noun in a sentence like “I enjoy running” as highlighted by the Oxford Language Club.

In addition to definitions, the OED provides historical context. This helps readers understand how and why certain exceptions have evolved.

Such insight is invaluable for educators, students, and editors seeking to improve writing precision and readability. By consistently referring to the OED, individuals can strengthen their grasp of complex grammar rules, making it an invaluable reference for language enthusiasts.

Strategies for Improving Reading Comprehension

A person reading a book, surrounded by various objects representing different rules and exceptions

Improving reading comprehension can significantly aid students in understanding texts more clearly and effectively.

1. Setting a Purpose
Readers benefit from knowing why they are reading. Establishing a purpose can guide their focus and improve engagement.

2. Asking Questions
Encouraging students to jot down questions while reading helps them engage critically and seek answers actively. This practice encourages deeper comprehension.

3. Building Vocabulary
Expanding vocabulary is crucial for comprehension. Introducing new words through context and repeated exposure can solidify understanding.

4. Visualizing
Students can create mental images of concepts and events described in texts. Visualization enhances retention and promotes a deeper connection with the material.

5. Making Connections
Relating new information to prior knowledge can strengthen comprehension. This practice helps students see relevance and patterns in their reading.

6. Summarization
Summarizing helps distill essential ideas from the text. It requires identifying key points and expressing them in their own words.

7. Using Graphic Organizers
Graphic organizers like Venn diagrams and story maps can organize information logically, making complex ideas more comprehensible.

8. Working with ESL Tutors
For English language learners, ESL tutors can provide targeted strategies. These strategies are tailored to enhance their understanding and use of English.

Developing Effective Writing Skills

A person breaking a pencil in half and writing with both pieces to illustrate finding exceptions to the rules

Effective writing combines technical knowledge of grammar with a flair for creativity. Key areas like gerunds play a critical role.

Mastering the Use of Gerunds

Gerunds, which are verbs ending in -ing used as nouns, are vital in enhancing writing. They allow for dynamic sentence structures and engaging text. For instance, in “Swimming is fun,” swimming acts as a noun. This can make writing more fluid and expressive.

To use gerunds effectively, one must integrate them naturally within sentences. Regular practice and understanding grammar rules can help. Recognizing their role in sentence structure not only enriches writing but also aids in clarity.

Building a Robust English Vocabulary

A stack of books on English vocabulary with a magnifying glass highlighting a page of exceptions to the rules

Building a strong vocabulary is essential for mastering the English language. Whether you’re a native speaker or learning English as a second language (ESL), expanding your word knowledge enhances communication.

One effective approach is reading extensively. This method exposes learners to new words in context, making it easier to understand their usage. ESL tutors often recommend reading books, articles, or essays to encounter diverse vocabulary.

Strategies for Vocabulary Building:

  • Flashcards: A classic tool for memorization. Create physical or digital flashcards for frequent review.

  • Word Games: Activities like Hangman or crossword puzzles can make learning fun and engaging. These games reinforce spelling and meaning.

  • Word Association: Linking new words with familiar concepts aids retention. This can be done through simple exercises or mind maps.

It’s important to recognize exceptions in vocabulary rules. Words in English often defy general expectations, which can challenge learners. Understanding these exceptions is crucial for developing a nuanced grasp of the language.

ESL tutors play a significant role in guiding learners through these challenges. They can offer personalized instruction, targeting specific needs and exceptions students encounter. This tailored approach ensures that learners build confidence in their vocabulary skills.

Overcoming Common Mistakes in English

English learners often face challenges with grammar and spelling mistakes. These issues can hinder communication, but understanding common pitfalls can help.

Common Spelling Mistakes:

  • Mixing up words like “their,” “there,” and “they’re”.
  • Confusing “your” with “you’re”.
  • Incorrectly using homophones like “to,” “too,” and “two”.

Grammar Tips:

  1. Subject-Verb Agreement: It’s crucial for verbs to match their subjects. Use “is” with singular subjects and “are” with plural ones.

  2. Tenses: Always pay attention to the verb tense. It reflects when the action occurs. For example, “Yesterday, I went to the store” is preferred over “Yesterday, I am going to the store” source.

  3. Word Order: Ensure words are in the right sequence. “She quickly ran” is correct, not “She ran quickly” for some emphases.

Spelling Rules:

  • “I before E”: Except when your word is “weird”.

Staying mindful of these areas can enhance both writing and speaking skills. Plus, applying these tips can reduce mistakes significantly. Read more about how to improve grammar skills through practice.

Distinctive Features of Spoken English

A group of diverse people engage in lively conversation, gesturing and expressing themselves with varying accents and intonations

Spoken English has unique characteristics that make it different from written English. One of the primary features is pronunciation. It can vary widely due to regional accents and dialects.

People might pronounce words differently even if the spelling is the same.

The use of intonation and stress helps convey meaning and emotion. The tone of voice can change the intent behind words. For instance, raising the pitch at the end of a sentence can suggest a question.

There are also exceptions to many rules in spoken English. While some grammar rules are strict, spoken language often allows for deviations. This flexibility can lead to informal expressions and slang becoming common in conversations.

Spoken English relies heavily on contextual clues. The meaning of words can depend largely on the situation in which they are spoken. This can create challenges for non-native speakers who might not be familiar with cultural references.

List of Distinctive Features:

  • Pronunciation Variations
  • Intonation and Stress
  • Use of Informal Expressions
  • Contextual Understanding

A comprehensive understanding of these elements can enhance communication. It allows speakers to navigate conversations effectively and understand the nuances of spoken English.

For more insight into the patterns of spoken English and the knowledge base that can help learners make informed choices, explore resources that discuss these features in detail.

Designing Successful ESL Learning Plans

Creating effective ESL learning plans involves understanding the unique challenges learners face, especially with exceptions to common rules in areas like pronunciation and spelling.

ESL tutors play a crucial role in guiding students through these complexities.

The Role of ESL Tutors in Exception Learning

ESL tutors are vital in helping students navigate the intricacies of the English language. They focus on exceptions to rules, which often involve tricky pronunciation and spelling.

For example, tutors might highlight that in English, many words don’t follow standard spelling rules, like “knife” or “knight,” where the “k” is silent.

To aid learners, tutors may use visual aids, such as charts or flashcards. These tools can help students remember patterns and unusual pronunciations.

Additionally, tutors often employ interactive activities to reinforce learning. These might include games or group discussions that encourage active participation.

Providing personalized feedback is another key strategy. It allows tutors to address specific challenges each learner faces.

With targeted guidance, students can better grasp exceptions, gaining confidence in their language skills. By systematically tackling these peculiarities, tutors foster a deeper understanding of English, equipping learners to handle the language’s complexities.

Applying Exceptions to Enhance Communication

In communication, understanding specific exceptions can improve clarity and effectiveness. Words like “hungry” and “friendly” illustrate how exceptions in language can shape the way we express ideas.

Words Like ‘Hungry’ and ‘Friendly’

The English language has words with unique uses and meanings, such as “hungry” and “friendly.” These words often serve as exceptions in grammatical structures.

“Hungry” is typically an adjective describing a state of need or desire for food. Yet, in some contexts, it can creatively describe longing or eagerness, as in “hungry for knowledge.” Here, the exception enhances communication by offering deeper meaning.

Similarly, “friendly” generally describes a warm or kind disposition. However, it can also reference compatibility, as in “user-friendly” technology. This adaptation provides clarity in describing things that are easy to interact with or understand.

Recognizing these exceptions helps convey complex ideas succinctly, allowing more dynamic and nuanced communication.

Frequently Asked Questions

A stack of rule books with one open to a page titled "Finding Exceptions." A magnifying glass hovers over the text, highlighting key phrases

Exceptions to rules often challenge what is considered general truth, offering insight into specific cases where usual patterns do not apply. These exceptions can illustrate nuances within the rule or expose its limitations.

Can you explain the meaning of ‘exceptions don’t make the rule’?

The phrase “exceptions don’t make the rule” implies that outliers or rare occurrences should not define the validity of a general rule. While exceptions exist, they do not invalidate the rule’s applicability to most cases.

What is meant by the phrase ‘exception that proves the rule’?

“Exception that proves the rule” suggests that a listed exception confirms the presence of a rule. For instance, a sign that says “Parking allowed on Sundays” implies that parking is typically restricted on other days, highlighting the general rule through the noted exception.

How can one identify an exception to a commonly accepted rule?

Identifying exceptions often involves examining the context and conditions of a rule. Exceptions usually occur when specific situations fall outside the rule’s general framework, revealing areas where typical standards fail to apply.

What are some common examples of exceptions to rules?

Common examples include grammatical rules in languages where certain words defy typical structure or science theories with anomalies that do not fit standard models. These exceptions help refine understanding by highlighting unique cases.

In what contexts might ‘the exception disproves the rule’ be applicable?

This context occurs when repeated exceptions accumulate, leading to reconsideration of the rule itself. Frequent or significant exceptions might necessitate revising a rule to better fit observed patterns and realities.

How does differentiating between ‘exemption’ and ‘exception’ to a rule affect its interpretation?

An exemption is a formal release from following a rule, often based on predetermined criteria. An exception, meanwhile, naturally occurs due to circumstances that the rule does not cover.

Recognizing this difference clarifies when a rule is or isn’t applicable.

Categories
Uncategorized

Learning Aggregate Functions in SQL: A Comprehensive Guide

Understanding Aggregate Functions

Aggregate functions are essential components in SQL used for performing operations on a collection of data to produce a single output value. These functions are integral to data analysis and assist in summarizing large datasets effectively.

What Are Aggregate Functions?

Aggregate functions in SQL include operations like SUM, COUNT, AVG, MIN, and MAX. These functions perform computations across multiple rows in a database table, returning a single value.

For example, SUM adds up all values in a numeric column, while COUNT finds out how many entries are present. AVG calculates the average, providing insights into typical values within a dataset.

Each function is paired with the GROUP BY clause to organize data into specified groups, allowing functions to return unique results for each group in the dataset. For more details, refer to SQL Aggregate Functions.

Importance of Aggregate Functions in Data Analysis

Aggregate functions are valuable tools in data analysis. They enable analysts to derive insights from large amounts of data by providing summary statistics. These functions help identify trends, patterns, and anomalies within data.

For instance, calculating total sales using SUM can reveal a company’s revenue over a period. The average salary across different cities can be computed using AVG, offering insights for workforce management.

In the context of learning SQL or a SQL basics course, understanding these functions is key. They enhance the ability to analyze datasets efficiently, facilitating informed decisions based on consolidated data views. By using these functions, businesses can allocate resources strategically and forecast future needs accurately.

Fundamentals of the SQL Language

SQL is a powerful tool used to manage and manipulate databases. Understanding its basics, such as the structure of a SELECT statement and the syntax, is crucial for anyone working with databases.

Structure of the SELECT Statement

The SELECT statement is the backbone of SQL, used to query data from a database. It consists of various clauses, each serving a specific purpose.

A basic SELECT query retrieves data from specified columns within a table.

An example of a simple SELECT statement is:

SELECT column1, column2 FROM tableName;

This command selects data from column1 and column2 in the table named tableName.

Using WHERE allows filtering of rows based on conditions, enhancing the query’s efficiency. ORDER BY arranges the results based on specified columns, in either ascending or descending order. These components make the SELECT statement versatile and essential for everyday SQL operations.

Introduction to SQL Syntax

SQL syntax is relatively simple, yet powerful, allowing users to perform complex queries. Keywords are case-insensitive, though writing them in uppercase is common practice for readability. Each command begins with an SQL keyword, like SELECT, followed by the relevant parameters and clauses.

Understanding basic SQL data types is vital. Common data types include INTEGER for whole numbers, VARCHAR for strings, and DATE for dates. Recognizing the correct data type ensures precise data handling and storage.

Proper use of SQL syntax not only improves data retrieval but also enhances database security and organization.

Using the GROUP BY Clause

Tables and data rows grouped together, with aggregate functions being applied to the grouped data

The GROUP BY clause in SQL is essential for organizing data into sets with shared characteristics. It is often used in conjunction with aggregate functions to provide meaningful summaries. Understanding both its syntax and applications for single and multiple columns is key to effective data analysis.

Syntax and Usage of GROUP BY

The GROUP BY clause simplifies SQL queries by grouping rows with the same values. It’s implemented after the WHERE clause and before ORDER BY.

An example syntax looks like this:

SELECT column_name, AGG_FUNC(column_name)
FROM table_name
WHERE condition
GROUP BY column_name;

In this example, AGG_FUNC could be functions like COUNT(), SUM(), or AVG().

By placing the column name after GROUP BY, the query will organize results based on distinct entries in that column. This helps in calculating statistics, making data easier to interpret.

The GROUP BY clause is beneficial for summarizing large datasets quickly. Many developers find it useful for operations such as counting the number of items in categories, calculating average sales per region, or finding maximum values within groups.

It is crucial to ensure that any column in the SELECT statement not inside an aggregate function is included in the GROUP BY clause to avoid errors.

Grouping Data by Single and Multiple Columns

Grouping data by a single column is straightforward. It involves using one column name with the GROUP BY clause.

For instance, you can find the total sales per country by grouping the data by the country column. This approach makes it simpler to comprehend patterns in a single dimension.

For multiple columns, GROUP BY becomes more complex yet powerful. It allows grouping by more than one column, providing insights along multiple dimensions.

For example, grouping data by country and then by city within that country offers a more detailed view. This way, each combination of columns appears as a group in the final result set.

By using multiple columns, organizations can break down larger datasets into more precise segments, enabling more granular analysis. This is especially useful in reports where one might need to see all relevant statistics broken down by multiple variables.

Exploring Common Aggregate Functions

A computer screen displaying SQL code with aggregate functions and a textbook open to a chapter on common aggregate functions

Aggregate functions in SQL are powerful tools for summarizing and analyzing data. They can be used to count rows, calculate totals, compute averages, and find minimum or maximum values. Understanding these functions is crucial for anyone working with large data sets.

COUNT: Counting Rows in a Table

The COUNT function is used to determine the number of rows in a dataset. It is extremely useful for finding out how many entries meet a certain condition.

For example, to count all employees in a company database, users can apply COUNT on the employee ID.

This function can also be utilized to count rows with non-null values in a specific column. It’s straightforward and does not include duplicates unless specified with COUNT(DISTINCT column_name). This makes it an essential tool for quick insights into the size of a dataset.

It works well with other SQL clauses like GROUP BY, allowing users to see counts in different categories, such as employees per department.

SUM: Calculating Total Values

The SUM function calculates the total of all the specified values within a column. It is often used to find the total salary in a payroll system or the total sales in a month.

This function only works on numeric data types.

Using SUM, large volumes of data can be reduced to a simple total, providing clear insights into accumulated figures.

For instance, to find the total salary paid to all employees, use SUM(salary_column).

The function can be combined with GROUP BY to sum values by groups, like total salary per department, which aids in financial analysis and budgeting.

AVG: Determining Average Values

The AVG function helps in calculating the average of a set of values. It’s commonly used to determine the average salary, price, or any numeric value.

By dividing the total of the values by the count, it provides a mean value that reflects typical data points.

For instance, to find the average salary in a company, AVG(salary_column) is used.

Like other aggregate functions, AVG can be grouped using GROUP BY to get averages per category. This functionality is vital for analyzing trends and making data-driven decisions, such as comparing average sales across different regions.

MIN and MAX: Finding Minimum and Maximum Values

The MIN and MAX functions are employed to find the smallest and largest values in a dataset, respectively. These functions are versatile, working on numbers, dates, and even strings.

For example, MIN(salary_column) can identify the minimum salary in a company.

Conversely, MAX(salary_column) finds the highest salary.

They can be paired with GROUP BY to reveal the minimum and maximum values within categories, such as the highest price in each product line.

Using these functions effectively helps in pinpointing trends and outliers quickly in large datasets, making them essential for thorough data exploration and analysis.

Working with DISTINCT Keyword

A computer screen displaying SQL code with the DISTINCT keyword and aggregate functions

The DISTINCT keyword in SQL plays an essential role in filtering and retrieving unique data. It is especially useful in aggregate functions, ensuring accurate calculations on non-repeated entries.

Understanding the Role of DISTINCT

The DISTINCT keyword is crucial for acquiring distinct values from a column in a table. When a query needs to extract unique data, DISTINCT ensures that duplicate entries are eliminated.

This is particularly important when non-null values are the focus, as it refines the dataset to only those records that are genuinely different. Developers and analysts often use this keyword to simplify datasets, making it easier to interpret results.

For instance, in a list of user emails, using DISTINCT can provide a set of unique email addresses. It is useful when working with large datasets to ensure that analyses and reports reflect true uniqueness.

Eliminating duplicates simplifies data handling and improves query performance, making DISTINCT a handy tool in database management.

Applying DISTINCT with Aggregate Functions

When combined with aggregate functions, the DISTINCT keyword offers precise insights.

Using COUNT(DISTINCT column) allows for counting only unique entries in a column, giving a true count without duplicates. This approach is vital for understanding data characteristics, such as unique users in a survey or distinct items sold in a store.

For example, applying DISTINCT within a SUM or AVG function will first filter unique non-null values before the calculation. This ensures that aggregate values, like total sales or average scores, are not inflated by duplicates.

It is a powerful method for gaining accurate summary statistics and improves the reliability of data-driven decisions. Using DISTINCT with aggregates does not only enhance accuracy but also supports effective data summarization.

Dealing with NULL Values in Aggregation

A computer screen displaying SQL code with a mix of NULL values and aggregate functions, surrounded by reference books and a notepad

When working with SQL, NULL values present unique challenges in aggregate functions. Understanding their influence is vital for accurate calculations. The following sections explore how NULLs affect functions and ways to manage them.

How NULL Affects Aggregate Functions

In SQL, NULL represents the absence of a value, which can impact aggregate functions like COUNT, AVG, and SUM.

When a column contains NULLs, they are ignored by most aggregate functions. For instance, AVG() calculates the average only from non-NULL values, possibly skewing results if NULLs are expected to represent zero or missing data.

A common misconception is that COUNT(*) excludes NULL values, but it actually counts all rows regardless of NULLs, unlike COUNT(column_name) which ignores them.

This distinction is crucial for accurate data analysis. Using an appropriate function like ISNULL() or COALESCE() allows substitution of NULLs with a specific value, ensuring correctness.

Excluding NULL Values in Aggregate Calculations

To exclude NULLs effectively, SQL provides tools like COALESCE() and ISNULL(), which replace NULLs with specified values.

This is useful in aggregates where removing or replacing NULLs can prevent misinterpretations of data. For example, SUM(ISNULL(salary, 0)) ensures that salaries represented as NULL default to zero, avoiding underreported totals.

Additional strategies involve filtering out NULLs directly in queries using WHERE conditions. This method provides cleaner datasets, as in SELECT AVG(salary) FROM employees WHERE salary IS NOT NULL, excluding NULLs from calculations simplifies the process and maintains data integrity.

For those needing more detailed exploration, SQL resources like SQL Snippets offer guidance on NULLs and aggregates.

Sorting and Filtering Aggregated Data

A computer screen displaying a database query with filtered and aggregated data results

Sorting and filtering in SQL are crucial for managing aggregated data. These operations help in organizing the results and selecting specific subsets of data for analysis. Key tools for this include the ORDER BY and HAVING clauses.

The ORDER BY Clause in Aggregation

The ORDER BY clause is used to sort query results. When working with aggregate functions like SUM, COUNT, or AVG, it helps in sorting the computed summaries.

SQL syntax lets users specify ascending or descending order by adding ASC or DESC after the column name. For instance, sorting total sales in descending order involves ORDER BY total_sales DESC.

Consider a table of sales data. If users want to view total sales by salesperson, sorted by the highest total, they can achieve this with:

SELECT salesperson, SUM(sales) as total_sales
FROM sales_data
GROUP BY salesperson
ORDER BY total_sales DESC;

In this query, sales data is aggregated and then ordered by total sales. Ordering makes it simpler to identify top or bottom performers or uncover trends in the aggregated data.

Using the HAVING Clause for Filtered Aggregation

The HAVING clause is vital for filtering aggregated results, similar to how WHERE is used with non-aggregated data.

Unlike WHERE, which filters rows before aggregation, HAVING filters data after the aggregation process is complete. This is especially useful for selecting groups that meet certain criteria, such as having a total higher than a specified threshold.

For instance, to find salespeople with total sales above $1,000, the query might look like:

SELECT salesperson, SUM(sales) as total_sales
FROM sales_data
GROUP BY salesperson
HAVING SUM(sales) > 1000;

Here, the HAVING clause filters the aggregated results to show only those with more than 1,000 in sales. This allows for precise targeting of results after the aggregation is complete, making it a powerful tool for deeper data analysis.

Advanced Aggregate Functions

A computer screen displaying SQL code with aggregate functions and related data tables

Advanced aggregate functions in SQL go beyond simple calculations to offer deeper insights. This section explores how to compute standard deviation and variance, along with functions like VAR and STDEV that are vital for statistical analysis.

Calculating Standard Deviation and Variance

Standard deviation and variance are essential for understanding the spread of data.

In SQL, the STDEV function calculates standard deviation, determining how much the values deviate from the average. This is useful in assessing consistency.

Similarly, VAR computes variance, providing insight into data variability over time.

Calculating these metrics in SQL helps in fields like finance and research, where knowing data stability is crucial.

Variance breaks down into different types, such as VARP, covering population data, while STDEVP deals with population standard deviation.

These functions offer precision and depth for data analysis. Using them effectively requires knowing when to apply each method for accurate results.

Other Aggregate Functions: VAR, STDEV, and More

Beyond basic functions, advanced SQL includes additional tools like VAR and STDEV.

Using VARP, analysts can evaluate overall data variability. It calculates variance for entire populations.

In contrast, STDEV handles samples more efficiently.

In SQL, using STDEVP allows calculating the standard deviation for populations, offering an even broader data view.

These functions enhance analytical precision by providing options tailored to population or sample data. Understanding differences among VAR, STDEV, and their population versions helps refine analysis and insights.

For more on these methods and other uses, you can explore resources like advanced SQL techniques.

Aggregate Functions and Joins

A database query with tables joined and aggregate functions applied

Aggregate functions in SQL are powerful tools used to perform calculations on data sets. When combined with joins, they allow users to glean meaningful insights from interconnected tables. Understanding how inner joins work in this context, and how to effectively apply aggregate functions over joined tables, is crucial for data analysis.

Understanding INNER JOIN in Context of Aggregation

An INNER JOIN is a type of join that returns records with matching values in both tables. It is commonly used when one wants to retrieve data sets where a relationship exists between the tables.

In the context of aggregation, INNER JOINs help filter the data to include only relevant records before applying aggregate functions.

For example, using INNER JOIN, one can combine tables containing sales records and customer data. Once the tables are joined, aggregate functions like SUM or AVG can then calculate the total sales or average sale amount for each customer, respectively.

This technique is useful to uncover patterns such as the highest spending customers or most popular products.

Performing Aggregations over Joined Tables

When performing aggregations over joined tables, SQL provides various functions like MAX, MIN, COUNT, and many others.

These functions operate by performing calculations across the combined result set. The process often involves using the GROUP BY clause to organize the data into groups that can be independently aggregated.

Suppose a database includes tables for movies and distributors. By using INNER JOIN along with MAX, it’s possible to display the highest price for each movie offered by various distributors.

SQL queries that utilize aggregate functions on joined tables provide a comprehensive view of the data, enabling informed decision-making and strategic insights.

Scalable Aggregations in SQL

A database query being executed, with multiple data sets being combined and analyzed using SQL aggregate functions

Efficient data aggregation in SQL is essential for processing large datasets. Special functions like APPROX_COUNT_DISTINCT and CHECKSUM_AGG help manage data scalability. These functions offer approximate counts and data integrity checks, respectively, streamlining computation without sacrificing significant accuracy.

Using APPROX_COUNT_DISTINCT for Large Datasets

The APPROX_COUNT_DISTINCT function helps manage large datasets efficiently by providing a quick count of distinct values. When exact counts are not critical, this function gives an approximate number, saving time and resources.

Instead of using the traditional COUNT(DISTINCT column), which can be resource-intensive, relying on APPROX_COUNT_DISTINCT is beneficial when working with extremely large tables.

It executes faster and requires less memory, making it ideal for large-scale analytics. Using this function helps businesses that handle massive records to get insights without overwhelming their systems.

This function uses algorithms that allow it to estimate the cardinality quickly. While it might not be suitable for all use cases, it’s perfect when timeliness is more important than absolute precision.

Benefits of CHECKSUM_AGG and COUNT_BIG

CHECKSUM_AGG and COUNT_BIG are crucial for handling data integrity and scalability.

CHECKSUM_AGG verifies the integrity of data by returning a checksum value for a group of rows, helping identify changes or corruption over time.

This function can be used to create a summarized version of a larger set for validation purposes.

On the other hand, COUNT_BIG, an extension of the standard COUNT function, caters to tables with large numbers of rows, returning the count as a bigint.

Unlike COUNT, which returns an integer, COUNT_BIG can accommodate datasets exceeding the maximum capacity of an integer.

This becomes critical when projecting future growth of datasets without hitting limitations of standard counting methods. These functions thus ensure scalable and reliable performance in large-scale database environments.

Practical Applications of SQL Aggregations

A computer screen displaying SQL code with various aggregate functions and their practical applications

SQL aggregations are vital in transforming raw data into meaningful insights. They help in decision-making across various fields, such as analyzing employee salaries and understanding e-commerce dynamics. Through aggregation, organizations can derive summary statistics and observe trends, enabling strategic actions.

Case Study: Analyzing Employee Salaries

In many organizations, HR departments utilize SQL aggregations for salary analysis. By calculating the average salary across different cities and countries, companies can assess market competitiveness.

The total salary for departments helps in budgeting and resource allocation.

A simple query using SQL’s AVG function can find an average figure for employee salaries in a specific location. Meanwhile, using the SUM function can convey overall department expenses.

These aggregated values guide salary adjustments and policy changes, ensuring equitable compensation across the organization.

Analysis also helps identify trends like top-performing departments, which may assist in long-term planning and development.

Case Study: Aggregation in E-commerce

In the e-commerce sector, SQL aggregations reveal patterns in sales and inventory. Merchants often examine the number of items sold to establish product demand.

By using the COUNT function, businesses can determine sales volume, while SUM aids in calculating total revenue from sales.

Analyzing customer purchases through SQL reveals trends in customer preferences across different grades of products.

Firms can also aggregate data by region, identifying which cities or countries generate the most sales.

This approach improves marketing strategies and inventory management, ensuring popular items are stocked in high-demand locations.

Aggregations thus support efficient operations and enhance customer satisfaction in competitive markets.

Interactive Learning Through Exercises

A computer screen displaying an interactive SQL exercise with aggregate functions, surrounded by reference books and a notebook with handwritten notes

Interactive learning is a powerful way to grasp the concepts of aggregate functions in SQL. By engaging with real-world examples, learners can better understand how these functions work.

SQL Exercises: Many platforms offer interactive exercises where users can practice using the SQL SUM() function to total numerical data, such as sales amounts or quantities. This practice helps solidify the concept and application of aggregation.

A great approach is to work on calculating average values. The AVG() function is used to find the mean of a set of numbers, making it essential for financial and statistical analysis.

Additionally, exercises can include finding extremes with MIN() and MAX(). These functions help identify the smallest and largest values in a dataset, which is crucial for data analysis tasks.

To further enhance learning, grouping data using GROUP BY is often part of interactive SQL exercises. This technique allows users to categorize results into groups, enabling more detailed analysis.

Some platforms, like W3Resource, offer structured exercises that guide users through writing and executing SQL scripts.

Completing these exercises can improve one’s competence in SQL, making it easier to manage large datasets and derive meaningful insights.

How does the use of aggregate functions differ between SQL databases, such as Oracle and SQL Server?

While aggregate functions in Oracle and SQL Server are generally consistent, minor syntax and performance differences can arise.

Oracle might use specific extensions or optimizations, and SQL Server may have its own functions tailored for performance enhancements.

Each database system offers unique features to maximize the efficiency of data aggregation.

Categories
SQL

Working with NULL Values: Your Comprehensive Guide to Handling Absent Data

In the world of database management, dealing with NULL values is an inevitable part of your work as a database developer or administrator. You might be wondering, what exactly does NULL mean? In the context of a relational database model, NULL represents an unknown value. It’s not zero, it’s not blank – it’s simply indeterminate. Knowing how to handle such values can greatly enhance your effectiveness in managing and manipulating data.

Understanding this concept is crucial when working with any type of database, from customer databases to sample databases used for learning purposes. This could involve performing arithmetic operations on nullable columns in the customer table or using logical operators that account for potential nullity in input values. A comparison operator may behave differently when encountering a NULL value versus an actual value, due to SQL’s three valued logic.

It’s also imperative that you’re able to identify non-null values within your database column through the use of a SELECT statement or similar query plan. Whether you’re creating records, sorting values by range or building lists from the person table or another source, being cognizant of where and why NULLs occur will make you more adept at navigating your relational database engine.

Understanding NULL Values in Databases

Let’s embark on a journey into the world of databases, specifically focusing on the concept of NULL values. This will help you to better comprehend how your data behaves, and ultimately make you more proficient in managing it effectively.

In relational database management systems (RDBMS), NULL is a marker indicating an unknown or missing value. It doesn’t equate to zero or blank, but rather signifies ‘absence of data’. Think of it as a placeholder for something that could exist but currently does not.

For instance, consider a customer table with columns for first name, last name, and email address. If we’ve just created a record but haven’t yet obtained the customer’s email – that field would be marked as NULL until such time that information becomes available.

You may wonder how this affects your work as a database developer? Well, when writing SQL queries or performing arithmetic operations, dealing with NULL values can become quite tricky due to their unique properties. The SELECT statement SELECT * FROM Customer WHERE Email IS NULL would return all customers who don’t have an email stored in our database.

NULL values also introduce what’s known as three-valued logic (3VL) into comparison operators within SQL. Besides TRUE and FALSE results from comparisons like equal to (=) and less than (<), we get another outcome: UNKNOWN when one or both of the input values are NULL.

Consider this scenario: You’re tasked with sorting records by date of contact within your customer table. However, if some dates are unknown (marked as NULL), they need special handling since normal comparison operators won’t function properly here.

Here’s where functions like COALESCE come into play for managing these situations effectively. The expression COALESCE(DateOfContact,'9999-12-31') substitutes any NULL DateOfContact fields with an arbitrary future date; thereby allowing seamless sorting without excluding those records with unknown contact dates.

This is merely scratching the surface when it comes to understanding and working with null values in databases! As you delve deeper into this topic through further study and hands-on practice – remember that every null value represents an opportunity for data enrichment!

The Importance of Handling NULL Values Correctly

In the world of database management, there’s one character that often causes more headaches than any other: NULL. Unlike an actual value or even a blank space, this pesky placeholder represents an unknown or non-existent value in a relational database column. It’s neither zero nor empty string—it’s simply nothing.

When you’re working with databases, handling NULL values correctly is crucial to ensuring accurate data manipulation and retrieval. Let’s consider an example using our customer table in a sample database. If we execute a SELECT statement without accounting for NULL values, it’s like asking the database engine to compare apples and oranges—or rather known and unknown quantities—resulting in inaccurate results.

As a database developer, you must remember that comparison operators don’t play well with NULLs. For instance, if you ask SQL whether “NULL equals NULL”, it won’t return true nor false but another null! This is because under three-valued logic (3VL) implemented by SQL due to ANSI SQL-92 standard requirement, any arithmetic operation involving null yields another null as output which could potentially mess up your calculations if not treated properly.

Let’s say your customer table has nullable columns Email and LastName. Now imagine running two queries:

  1. SELECT COUNT (*) FROM Person WHERE Email IS NOT NULL;
  2. SELECT COUNT (*) FROM Person WHERE LastName IS NOT NULL;

The first query will return all records with non-null email addresses while the second fetches those with last names present i.e., non-null last names only reflected in their counts respectively.

Working effectively with nullable input requires careful use of functions like COALESCE that can replace nulls with substitute values thus avoiding abrupt breaks during record creation or processing expressions involving potential unknown values from these columns.

Sorting poses yet another challenge when dealing with nulls since sorting order might differ based on different commercial database processors adherence to ANSI standards or vendor-specific implementations thereof hence requiring additional checks in place before relying on sort outputs for downstream processes.

Remember this: When building lists such as comma-delimited customer emails list or performing aggregate functions over range of column values neglecting correct handling of Nulls could result into incorrect outputs leading to flawed decision making later based on such outputs.

For instance: A simple SUM function calculation would give different results if run ignoring versus taking into account Null values within target columns demonstrating criticality of their proper handling during arithmetic operations including aggregations too!

So next time when you’re manipulating your customer databases or following along some Database development tutorial be diligent about addressing those lurking Nulls aptly applying logical operators keeping semantics intact for accurate reliable outcomes always!

Common Challenges with NULL Values in SQL

When you’re working with a relational database, handling NULL values can be quite the hurdle. These represent unknown or missing data and can create unique problems for the database developer. Here we’ll delve into some of these challenges.

Firstly, NULLs don’t play well with comparison operators. In SQL’s three-valued logic, any operation involving a NULL is neither true nor false but rather unknown. For example, if you’re using a SELECT statement to find all records in your customer table where column value isn’t equal to ‘XYZ’, rows containing NULL in that column won’t be returned. This happens because the database engine treats NULL as an ‘unknown’ value.

Secondly, aggregate functions tend to ignore NULLs. Let’s say you’ve got a nullable column in your customer table and you want to compute the average (an arithmetic operation) of that column’s values. The function will simply bypass all nulls during calculation instead of considering them as zero or blank values—this could significantly skew your results.

Another issue arises during record creation or update operations when dealing with non-null columns without default values set up by database administrator; if no input value is provided for such columns, SQL Server throws an error.

Sorting is another area where NULLs pose a challenge: how they sort depends on what DBMS you are using it might consider them lower than any non-empty value or higher than any actual value making it tricky for developers especially when working on commercial databases processes.

Lastly, logical operators behave differently when used with Nulls. Consider this scenario: You have two expressions connected by AND operator where one expression returns TRUE and other UNKNOWN (because it has Null). As per ANSI SQL 92 standard, whole condition becomes UNKNOWN which might not be expected outcome for many developers who are new to SQL standards.

All these factors make managing nulls within your relational database model challenging yet essential part of Database Management Systems(DBMS).

Effective Methods for Working with NULL Values

In your journey as a database developer, you’ll encounter NULL values in relational databases. These present unique challenges that can throw a wrench in your operations if not handled correctly. Let’s dive deeper into effective methods to tackle these unknown values.

NULLs represent the absence of an actual value and they tend to behave differently than non-null values when used with comparison operators. For example, let’s consider a customer table in your sample database where the address column is nullable. If you’re using a SELECT statement to filter customers based on their addresses, the query will not return rows where the address is NULL unless explicitly instructed by using IS NULL or IS NOT NULL logical operators.

You may wonder how this impacts record creation or arithmetic operations? For instance, an arithmetic operation involving a NULL would yield another NULL which may not be the desired result. Similarly, aggregate functions like COUNT ignore null values while SUM and AVG treat them as zero affecting your calculations.

To avoid such pitfalls, there are several strategies:

  1. Use COALESCE function: This function returns the first non-null value from its input list of parameters.
  2. Set Default Values: While defining columns in database tables, you can set default values for nullable columns.
  3. Work with Three-Valued Logic (3VL): In SQL standard known as ANSI SQL 92 standard enforced by American National Standard Institute (ANSI), it introduces three-valued logic (TRUE, FALSE and UNKNOWN) which helps manage comparisons involving nulls.

To illustrate how to use COALESCE function effectively,

SELECT
    COALESCE(Address,'No Address') AS CustomerAddress,
    LastName
FROM 
    Person;

This query ensures that ‘No Address’ appears instead of null allowing better readability for end-users or further processing by other parts of application code.

Remember to keep experimenting! As every commercial database process comes with its own nuances; what works best often depends on specifics of data at hand and your goals as a database administrator or programmer.

Replacing NULLs: Pros and Cons

As you navigate through the complex realm of relational databases, there’s no escaping the controversial topic of handling NULL values. The concept of a null – an unknown or non-existent value – has been a part of database design since its inception, providing both advantages and challenges for database developers.

When dealing with NULLs in your customer tables or any other database columns, one common approach is to replace them with actual values. This can certainly simplify operations such as sorting values, arithmetic operations, or using comparison operators that might otherwise not work with NULLs due to SQL’s three-valued logic system.

However, be mindful that replacing NULLs also comes with potential downsides:

  • It alters the original data: Changing a NULL value means you’re substituting it for an “unknown” value with something specific. One must tread cautiously here as it could distort analysis.
  • Default or random values can mislead: If your replacement strategy involves using default or random values for nullable columns, this might lead to misleading results in aggregate functions like averages and totals.
  • It complicates record creation: Inserting new records into a table becomes more complex when you have to ensure non-null values for all columns.

On the upside:

  • Simplifies queries: By eliminating NULLS from your select statements and expressions, database engines are likely to execute queries more efficiently.
  • Eases comparisons: Non-null column values make logical operator use straightforward because they adhere strictly to Boolean logic rather than SQL’s three-valued logic (true/false/NULL).
  • Facilitates external processes: Some commercial applications refuse empty fields; hence ensuring non-empty column values would ease integration.

Database management isn’t always black and white; sometimes it dwells within shades of gray. When working with NULLs in your person tables or elsewhere in your sample databases, consider these pros and cons carefully. An effective strategy would involve understanding how different functions react to null inputs before making decisions about replacing them.

Remember that what works well on one server query may not yield similar results on another. Hence it’s crucially important that you take time testing various scenarios before reaching a decision regarding handling nulls in your assignments. After all, being an adept database programmer entails mastering the delicate balance between maintaining accurate data representation while ensuring efficiency and practicality in database operation processes.

Practical Examples: Dealing with NULL in Various Scenarios

When working with NULL values within a relational database, you might encounter scenarios that seem puzzling at first. But don’t fret; as a seasoned database developer, I’m here to guide you through some practical examples that will help illuminate the path.

Let’s start with a common scenario involving comparison operators and NULL values. Suppose we’ve got ourselves a customer table in our sample database, and we want to find all customers who haven’t provided their email addresses. Here’s how you can achieve this using the SELECT statement:

SELECT * FROM Customer WHERE Email IS NULL;

The above query tells your database engine to fetch all records where the ‘Email’ column value is unknown (NULL).

Next, let’s work on another interesting case involving aggregate functions and arithmetic operations. When performing an operation like SUM or AVG on nullable columns, SQL ignores any null input values by default. For example:

SELECT AVG(Age) FROM Customer;

This query calculates the average age of all non-null values from ‘Age’. It won’t throw any error even if some records have null ages.

Now imagine this scenario: You’re building a list of all active customers but stumble upon rows where the ‘IsActive’ column has blank (NULL) values. Here’s how COALESCE function can be your savior:

SELECT COALESCE(IsActive,'No') AS IsActive FROM Customer;

This nifty function returns the first non-null value it encounters in its arguments – effectively replacing any NULLs in ‘IsActive’ with ‘No’.

Another intriguing aspect of working with NULL comes into play when dealing with logical operators as per ANSI SQL-92 standard guidelines – often referred to as three-valued logic (3VL). Unknown (NULL) behaves differently than actual TRUE or FALSE values when used within logical expressions.

Finally, remember that while handling NULLs may seem daunting initially, understanding them deeply would make your life as a database administrator much easier! They are not just about representing missing or undefined data; they also carry significant meanings during comparisons and logical evaluations.

Advanced Techniques for Managing NULL Data

Understanding how to manage NULL data is a critical skill in the world of database management. As you delve deeper into this field, you’ll come across scenarios where the traditional techniques just won’t cut it. That’s when advanced methods come in handy. Let’s take a closer look at these sophisticated techniques.

Working with non-null values often becomes an integral part of any database developer’s workflow. In relational databases, unknown or missing information is represented as NULL. The challenge here is that NULL isn’t equivalent to zero or a blank string; it signifies an ‘unknown’ value which can complicate comparisons using standard comparison operators.

Imagine working on your customer table and needing to execute a select statement considering only the non-null values in certain columns. Here, understanding three-valued logic (true, false, and unknown) becomes crucial. For instance, when comparing a NULL value with another using equality operator (=), the result isn’t true nor false but unknown.

You may encounter situations where arithmetic operations involving NULL need to be performed – quite tricky given that any arithmetic operation with NULL results in NULL! You can overcome this by using functions like COALESCE that return the first non-NULL input value or use ISNULL function which returns either the non-null value or a specified replacement.

Managing nullable columns effectively also plays its part in efficient database management. When performing sort operations on nullable columns, items with null values typically end up at the bottom of your result set irrespective of ascending or descending order applied.

Here are few practices worth noting:

  • Setting default values while record creation helps avoid unnecessary nulls.
  • Utilizing aggregate functions like COUNT(), AVG() etc., ignore nulls giving you meaningful output even with missing data.
  • When dealing with mandatory fields during data entry, ensure no garbage values enter your system posing as valid inputs.
  • A powerful tool for managing nulls is conditional logic using CASE expressions within your SELECT statements making your query return based on column value conditions.

Remember though there’s no one-size-fits-all approach here due to differences among database vendors and types of relational database models used!

In essence, mastering these advanced techniques equips you better as a Database Administrator (DBA) or programmer to tackle challenges thrown by handling NULLs and ace those complex queries!

Conclusion: Best Practices for Handling NULL Values

After diving deep into the mechanics of working with NULL values, it’s clear that understanding and properly handling these unknown elements is crucial to your success as a database developer. Here are some key takeaways.

Firstly, remember that a NULL value isn’t an actual value but signifies an unknown value in your relational database. Whether you’re scanning through a customer table or performing a select statement on your sample database, you need to account for these potential pitfalls.

The three-valued logic of SQL may seem daunting at first glance. However, it becomes second nature when you realize how comparison operators work with NULL values. It’s not about true or false anymore; there’s now an additional state – the ‘unknown’.

Never forget the implications of having nullable columns in your database tables. When creating records, think carefully before setting any column as nullable. It could lead to unexpected results during arithmetic operations or when using aggregate functions.

Take advantage of functions provided by your database engine explicitly designed to deal with NULL values like COALESCE and ISNULL. These tools can replace unknown with known quantities making it easier to sort and compare column values.

Keep in mind the importance of default values too! They allow you to avoid nulls during record creation by automatically filling fields if no input value is provided.

On top of that, always remember:

  • Not all databases follow ANSI SQL-92 standard regarding NULL behavior.
  • Some expressions might return different results depending on whether they include NULLs.
  • Implicit cast operators won’t work if any operand is NULL.

To wrap this up, consider this: Database management isn’t just about storing data; it’s about understanding every aspect of how data interacts – including those pesky little unknowns we call nulls!

Your journey doesn’t end here though! There’s always more to learn in the ever-evolving field of database development so keep exploring new tutorials and enhancing your knowledge base!

Categories
SQL

Retrieving SQL Data: Master the Art of Database Querying

In the realm of database management, retrieving SQL data is an essential skill that can significantly streamline your workflow. You’re likely already familiar with how crucial it is to extract precise and relevant information from your database tables. Whether you’re a seasoned SQL user or just getting started, understanding how to craft an effective SQL query can be the difference between a smooth project operation and hours of frustrating troubleshooting.

Let’s take for instance when you need a particular column value from your ‘patients’ database table or perhaps, the complete file path from an offline cube file in your IBM DB2 database. This necessitates constructing a specific query string with appropriate parameters such as type varchar or segment column aliasing where necessary. Also, imagine needing to execute complex queries involving multiple departments within your PostgreSQL Oracle Teradata Access databases. Here, crafting precise native database queries becomes not only beneficial but paramount.

Don’t forget about security while handling sensitive data like customer table details or accessing JDBC/ODBC connection strings which require proper authentication methods and encryption with customer options enabled for safety reasons. Furthermore, consider situations where you have to handle large collections of items requiring dynamic arrays or implementing advanced connector options for efficient execution time management – all these underscore why mastering SQL data retrieval is invaluable.

Understanding SQL Data Retrieval

Diving into the world of SQL, you’re soon to discover a powerful tool at your fingertips: data retrieval. It’s integral to managing databases effectively and is often the first step when dealing with database management. You’ll find that understanding this process can significantly enhance your ability to manipulate and analyze data stored in various types of databases such as IBM DB2, PostgreSQL, Oracle, or Azure SQL.

Let’s think about a typical scenario. Imagine you have an array of update counts in a “patients” database table; each column value represents specific patient information. With a well-crafted SQL query, you can retrieve any piece of information from this table within no time! The key lies in constructing your query string correctly.

Consider yourself needing details about patients who were admitted after a certain date. Your native database query might begin like this: SELECT * FROM Patients WHERE AdmissionDate > 'specified-date'. Here, ‘SELECT’ is your project operator indicating what data should be retrieved – ‘*’ means all columns in the table. The ‘FROM’ clause specifies which table – ‘Patients’, and the ‘WHERE’ clause sets conditions for retrieval – only patients admitted after a specified date are needed.

You can even go further by adding more advanced options to your SQL filter string for more complex queries. For instance, if you need information on patients from not just one but multiple departments (say Cardiology and Neurology), you could make use of nested queries or join operations.

Mastering these basic steps surely requires practice but it’s worth every effort considering the power and flexibility it brings along. One crucial aspect here involves ensuring secure access through proper authentication method; often using JDBC or ODBC database connections with valid user credentials.

SQL also provides flexibility around column data types (like varchar) and allows setting default column type according to needs. This becomes especially useful when working with large datasets where different columns may hold diverse kinds of data.

In conclusion, understanding how to retrieve SQL data is a fundamental skill that can dramatically improve your efficiency while working with databases. Whether it’s obtaining specific column values from an extensive database table producttable or navigating through intricate layers of complex queries – mastering SQL retrieval will put you ahead in any game involving significant amounts of data.

Essential SQL Commands for Data Retrieval

Diving right into the heart of any database operation, you’ll find SQL commands. They’re like the magic spells that summon data from your tables and present it to you in an organized manner. Now we’ll explore some of these essential SQL commands that you need for retrieving data.

First off, the SELECT command is your go-to tool for pulling data out of a database table. Let’s say you’ve got a column named ‘product’ in your ‘productTable’. To retrieve all values from this column, your SQL query would look something like this:

SELECT product 
FROM productTable;

Easy enough, isn’t it? Now if only one particular row interests you, perhaps where the type is VARCHAR or another specific column value, then WHERE clause comes into play. Here’s how:

SELECT * 
FROM productTable
WHERE type = 'VARCHAR';

For more complex queries involving multiple conditions, AND and OR operators are at your disposal. You can even sort retrieved data using ORDER BY clause as shown below:

SELECT * 
FROM productTable
WHERE type = 'VARCHAR'
AND price > 50
ORDER BY price DESC;

In addition to these fundamental commands, there are advanced options such as JOINs and UNIONs that allow fetching data across multiple tables – truly powerful features when dealing with large databases.

It’s important to note that while crafting these queries might seem daunting at first glance – especially if you’re dealing with native databases like IBM DB2 database or Oracle database – practice makes perfect. The more familiar you become with SQL syntax through hands-on experience, the smoother your journey in mastering data retrieval will be.

Remember to always safeguard sensitive information by securing your database user credentials and employing encryption methods where necessary.

Now armed with knowledge of these vital SQL commands, it’s time for action! Just fire up that JDBC or ODBC database connection and start retrieving!

Retrieving Data Using Select Statement

Let’s dive into the heart of SQL: the SELECT statement. It’s your go-to tool when you need to retrieve data from a database table. This powerful command allows you to specify exactly what information you’re after, right down to the column value.

You might be wondering how it works. Well, imagine your SQL query as a question you’re asking your database. “Could I have all the records from the customer table?” or “What are all the products under $20 in my productTable?” These questions translate into SQL SELECT statements. The answers depend on how well you ask – and that’s where understanding complex queries comes in handy.

Here is an example of a simple SELECT statement:

SELECT columnName1, columnName2 FROM tableName;

This will fetch all rows for columnName1 and columnName2 from the table named tableName.

Now consider working with multiple columns, different data types, or multiple tables at once – things can get tricky fast! You’ll find yourself needing more advanced options like WHERE and JOIN clauses to refine your queries further.

Think about this scenario: You’ve got an IBM DB2 database, a PostgreSQL database, an Oracle Database, and even an Azure SQL Database all housing different parts of your organization’s data. It becomes essential then to use select statements efficiently across these varying environments while considering each native database’s unique syntax and quirks.

But don’t fret! With some practice and patience (and perhaps a bronze badge or two earned along the way), we assure you that navigating through various databases with precise select statements becomes second nature!

Finally, keep security in mind too! Be sure always to handle your database user credentials carefully when running any sort of native database query. Ensuring secure JDBC or ODBC connections should always be part of good database management practices.

In sum? The SQL Select statement is mighty indeed—a true workhorse for retrieving exact collections of items from vast databases quickly and securely.

Advanced Techniques: Join and Union Operations

Diving into the world of SQL, you’ll often find yourself needing to extract data from multiple tables. That’s where ‘Join’ and ‘Union’ operations come in handy. They’re designed to help you manipulate and retrieve data more efficiently.

When dealing with complex queries, ‘join’ operations are your best friend. This technique allows you to combine rows from two or more database tables based on a related column between them. Imagine, for instance, having a customer table and an orders table. With a ‘join’, you can merge these tables using a common identifier like ‘customer id’. Now, instead of running two separate queries, you’ve got all the needed info in one fell swoop.

But what if you want to merge results from different SELECT statements into one result set? That’s when the Union operation steps in. It combines rows from different SQL queries into a single result but doesn’t duplicate any rows even if they’re identical.

Let’s take an example using two database tables named Employees and Departments:

  • Table: Employees
    EmployeeID Name Department
    1 John Doe IT
  • Table: Departments
    DepartmentID Name
    1

Using JOIN operation:

SELECT Employees.Name, Departments.Name 
FROM Employees 
JOIN Departments ON Employees.Department = Departments.DepartmentId;

The above SQL query would return “John Doe, IT”

For UNION operation:

SELECT column_value FROM table1 
UNION 
SELECT column_value FROM table2;

The above query fetches unique column_values from both table1 and table2.

While these advanced techniques might seem daunting at first glance, don’t be discouraged! There’s no denying that mastering JOINs and UNIONs can significantly enhance your database management skills. Also remember that while this article mainly discusses native SQL implementations, similar concepts apply across various DBMS platforms including PostgreSQL Database, Oracle Database or even Azure SQL Database.

Filtering and Sorting Retrieved SQL Data

Diving deeper into the world of SQL, you’ve likely come across the need to filter and sort data. It’s a common task when dealing with databases, whether you’re working with an IBM DB2 database or an Azure SQL database. But how exactly do you go about it? Let’s discuss.

To filter data in your queries, you’ll use a WHERE clause. This allows you to specify conditions that must be met for rows to be included in the results. For example, if you have a patients database table and want to retrieve only those who are over 60 years old, your query string might include “WHERE age > 60”. You can also combine conditions using AND/OR operators for more complex queries.

Sorting is another crucial part of managing your data efficiently. By using the ORDER BY clause in your sql query, you can arrange rows based on one or more columns’ values from your database table. Let’s say we have a productTable with columns including ‘productName’, ‘productPrice’, and ‘productCategory’. If we wanted our output sorted by price in descending order, we’d add “ORDER BY productPrice DESC” at the end of our query.

But what happens when column values are strings and not numbers? Well, by default, sorting treats all column data types as strings unless specified otherwise. So if numbers are stored as type varchar (for instance), they’ll be sorted lexicographically – meaning ‘100’ comes before ’20’. To avoid this issue, ensure numeric data should always stored as numeric types.

SQL also offers flexibility when it comes to case sensitivity during filtering and sorting; however this depends on the default settings of your specific DBMS like PostgreSQL or Oracle Database etc.. If lowercase letters are treated differently than uppercase ones (known as collation), then “WHERE name = ‘john'” will not return rows where name is ‘John’. However most databases offer functions such as LOWER() or UPPER() which allow consistent comparisons regardless.

Finally remember that while SQL gives us amazing power over our data through its native database queries , these techniques can sometimes lead to long execution times especially for larger datasets or complex queries . One way around this could be creating views or indexes tailored towards frequent queries but that is beyond scope of our current discussion.

Implementing Subqueries for Complex Data Retrieval

In the realm of SQL, subqueries serve as an essential tool to solve complex data retrieval problems. These nested queries allow you to retrieve data in a more flexible and efficient manner from your database tables.

Imagine yourself working with a customer table in your PostgreSQL database where each row represents distinct customer information. There might be times when you need to retrieve customers who have spent more than the average expenditure of all customers. In such instances, subqueries can be your silver bullet.

A typical subquery structure would look like this:

SELECT column_value 
FROM customer_table
WHERE column_value > (SELECT AVG(column_value) FROM customer_table);

Here, the inner query calculates the average expenditure while the outer query retrieves customers who exceed that average.

Subqueries can be used not only in WHERE clause but also with other SQL constructs like SELECT and FROM. Consider another scenario where you’re dealing with an item table in your Azure SQL Database, holding data about different product items. You may want to fetch item details along with their respective highest sales price from a productTable. A suitable subquery for this task could look something like:

SELECT item_name, (SELECT MAX(price) FROM productTable WHERE productTable.item_id = item.id) AS highest_price 
FROM item;

In this example, the inner query retrieves the maximum price for each item by matching item_id from both tables and assigns it as highest_price, using column alias feature of SQL.

Remember that executing complex queries involving multiple subqueries might increase execution time due to added computational overheads. Therefore, always ensure your queries are well-optimized and consider indexing common columns utilized frequently in WHERE clauses or JOIN conditions for faster query time.

Bear in mind that implementing subqueries requires careful consideration over simpler methods depending upon factors such as complexity of requirement, size of dataset and native database capabilities among others.

Optimizing Performance in SQL Data Retrieval

You’re knee-deep in the world of SQL, looking to optimize your data retrieval performance. You’re not alone. Database management is a vital part of any business operation, and it’s crucial to know how to retrieve data quickly and efficiently.

Let’s start with the basics: your SQL query. It’s akin to a tailor-made request ticket for your database table, asking for specific column values based on the conditions you set in your query string. But remember, efficiency is key here. Including unnecessary columns or using complex queries can slow down your execution time significantly.

Perhaps you’ve noticed that some database tables are case-sensitive. A column value starting with a lowercase letter might not return results if requested with an uppercase one, especially if the column type is varchar or similar. That’s why it’s important to ensure consistency when dealing with native databases like IBM DB2 database or PostgreSQL database.

When it comes to performance optimization, don’t overlook connection options either – JDBC and ODBC connections have their own pros and cons depending on your specific situation. Maybe you need advanced connector options for an Azure SQL Database or perhaps default connection settings work perfectly fine with an Oracle Database.

Now onto more complex matters: handling large datasets from multiple sources like CSV files or PDF files could be challenging but fret not! Efficient use of array functions and select operators can help streamline data collection from various sources into one coherent dataset without sacrificing speed.

Lastly, let’s talk about authentication – nothing slows down progress like stumbling over user credentials for each database entry point. Whether it’s Windows Authentication mode or another method entirely depends on the security requirements of your organization.

In summary, optimizing SQL data retrieval isn’t just about writing efficient queries—it involves understanding every step of the process from connecting to native databases all the way through handing off secure credentials. By keeping these points in mind as you navigate through this essential task, you’ll be well-equipped to expedite data retrieval while maintaining high-quality results.

Conclusion: Mastering SQL Data Retrieval

You’ve come a long way on your journey to mastering the art of retrieving SQL data. From understanding basic SQL queries to working with complex ones, you’ve unlocked the potential of your database tables and gained control over your column values.

Your grasp on query strings has grown stronger. With each character typed, each lowercase letter used in your type varchar columns, you’ve earned another bronze badge in this realm of data management. You’re no longer merely executing native database queries, you’re crafting them, molding them to suit every demand.

Database user credentials have become more than just keys to access databases like IBM DB2 Database, PostgreSQL Database, Oracle Database, Teradata Database or an Azure SQL Database. They are now tools that empower you to manage any kind of database data type effectively.

In dealing with different types of file details – be it from a CSV file or a PDF file – you have learned how to extract complete file paths and handle content files from their default location. You can now confidently work around various column headers in an SQL table column and understand different column data types.

Your knowledge extends beyond just knowing what a connection string is; it’s about manipulating the string var1 for advanced connector options based on the authentication method required by your external data source.

Through detailed steps and basic steps alike, you’ve learned how arrays function within an SQL context whether they be cell arrays or dynamic arrays which hold an array of update counts. The execution time spent running these queries has given you insight into optimizing their performance through careful consideration of parameters’ values among other things.

From customer tables to department database tables like productTable, every aspect is within reach as long as one remains patient and meticulous during the process. Whether it’s setting up JDBC or ODBC database connections or handling offline cube files from various sources – there’s nothing standing between you and efficient data retrieval anymore.

In essence, by mastering these concepts—from managing credentials options for various authentication modes like feedRequiresWindowsAuthentication down to understanding host variables—you’ve become proficient at navigating any native database environment out there today including those that use IBM Db2 databases all the way down through Teradata databases using JDBC drivers or driver packages as needed during project operations involving select operators for example!

Such mastery doesn’t just make retrieving items from collections easier; it also paves the way towards creating accurate reports that reflect current positions within organizations accurately while ensuring any additional parameters necessary are included appropriately when generating URLs in exact format required by clients—whether they require encryption with customers’ details included specifically upon request only!

Categories
Uncategorized

Learn to Create SQL Tables and Databases with Constraints: A Step-by-Step Guide

Understanding SQL and Databases

SQL and databases form the backbone of modern data management. Understanding their basic concepts is crucial for anyone working with data-driven systems.

Basics of SQL

SQL, or Structured Query Language, is a programming language used to manage and manipulate databases. It allows users to perform tasks such as creating tables, inserting data, querying for specific information, and updating records.

By mastering SQL, individuals can efficiently handle data in a database management system.

Common SQL commands include SELECT, INSERT, UPDATE, and DELETE. These allow for retrieving, inserting, altering, and removing data in a database, respectively.

Understanding data types and constraints like PRIMARY KEY and FOREIGN KEY is critical. They ensure data integrity and define how data in different tables relate to each other.

Overview of Databases

Databases store and organize large amounts of data systematically. They are essential in a data-driven world to store, retrieve, and manage data efficiently.

Relational databases use a structured format with tables comprising rows and columns to keep data organized. Each table represents a different entity, and relationships between these tables are defined using keys.

A database management system (DBMS) provides the tools required to interact with databases, ensuring data consistency, security, and easy access.

As the digital landscape grows, databases play a key role in supporting applications across industries, from finance to healthcare. Understanding these principles is fundamental for efficient data management.

Preparing to Create a Database

Setting up a database involves installing SQL Server and using a tool like SQL Server Management Studio (SSMS) to interact with the database. This section explores these necessary steps, ensuring a smooth start to database creation.

Install SQL Server

SQL Server is a relational database management system developed by Microsoft. It is essential to install it correctly to begin creating and managing databases.

First, download the installer from the official Microsoft website. The installer will guide you through the setup process.

Users can choose different editions, including Developer and Express, suited for various needs. The Developer edition provides full feature access, making it ideal for testing and development.

During installation, select a proper authentication mode. Windows authentication is recommended for single-user environments, while mixed-mode includes both SQL and Windows authentication for more flexibility.

It’s crucial to set a strong password for the SQL Server system administrator (sa) account if using mixed-mode.

Configuring instance layouts is another choice; selecting either a default or named instance helps you manage multiple installations on one machine.

Introduction to SQL Server Management Studio

SQL Server Management Studio (SSMS) is a powerful tool used for managing SQL Server databases. It offers a graphical interface to perform database management tasks, including database creation.

After installation, launch SSMS and connect to your SQL Server instance.

Navigating SSMS efficiently requires familiarity with its components. The Object Explorer pane allows users to view and manage database objects like tables, views, and stored procedures.

To create a new database, right-click on the ‘Databases’ node and select ‘New Database.’

SSMS supports running queries through an intuitive query editor. It’s also essential for scripting tasks, enabling the automation of database management routines.

For those new to SSMS, exploring its built-in features and keyboard shortcuts enhances productivity. Regular updates from Microsoft introduce new features and improvements, so keeping SSMS updated ensures access to the latest tools.

Defining Data Types and Structures

Choosing the right data types and structures is crucial for storing and processing data efficiently in SQL. This ensures data integrity and optimizes the performance of queries and storage.

Common SQL Data Types

SQL offers a variety of data types to accommodate different kinds of information. Integers (int) are used for whole numbers. For more precise calculations, real or float types handle decimal numbers.

Textual data can be stored in varchar or text fields; varchar(n) allows variable-length strings up to a specified length, while text is used for longer strings without a maximum length limit.

For logical data, SQL provides the boolean type, which stores true/false values. Datetime is utilized for storing date and time information.

Choosing the correct type is important to ensure data integrity and optimize space usage.

Choosing Appropriate Data Types

When selecting data types, several factors should be considered to maintain efficient storage.

Integrity is a key factor; choose types that match the nature of the data. For example, store numbers in int or float depending on whether decimals are needed.

Performance can be affected by data types as well. Using varchar instead of text when appropriate can reduce storage space. The ability to index data types like datetime can also increase query efficiency.

It’s essential to balance the size and usability of data types to ensure optimal database performance.

Creating Tables in SQL

Creating tables is a fundamental part of building databases in SQL. It involves defining the structure of a table by specifying its columns and data types. This allows for the organized storage and retrieval of data.

The CREATE TABLE Statement Syntax

The CREATE TABLE statement is used to create a new table in a database. This statement requires specifying the name of the table and defining each column’s attributes.

The basic syntax includes the table name followed by a list of columns inside parentheses. Each column definition consists of a column name and a data type. For example:

CREATE TABLE employees (
    employee_id INT,
    first_name VARCHAR(50),
    last_name VARCHAR(50),
    hire_date DATE
);

Some additional options include setting primary keys, default values, and constraints like NOT NULL.

Constraints help maintain data integrity within the table. Creating tables with specific syntax ensures that data input stays consistent and adheres to the intended database design.

Defining Columns and Data Types

Defining columns and choosing appropriate data types are crucial when creating a table. SQL offers a variety of data types, such as INT, VARCHAR, and DATE, each serving a different purpose.

The column name should be descriptive to reflect the information it holds.

Each column can have specific attributes like a primary key, which uniquely identifies each row.

Specifying the right data type helps improve the table’s performance and the integrity of stored data. For example, numerical values should use numeric data types like INT or DECIMAL rather than VARCHAR.

Using the right data types and defining columns precisely ensures a robust and efficient database table structure.

Implementing Primary and Foreign Keys

Implementing primary and foreign keys is essential for creating a structured and reliable database. These keys support unique identification of rows and help maintain integrity between related tables.

Understanding Key Constraints

Primary keys play a crucial role in databases by ensuring that each row in a table is unique. This key is often a specific column, such as an ID number, that does not allow duplicate values.

It helps speed up operations like searching and sorting because each entry can be quickly identified by its unique primary key.

Foreign keys establish links between tables. A foreign key in one table refers to the primary key in another table.

This relationship is vital for maintaining consistency, known as referential integrity. For example, when a foreign key constraint is applied, changes in the primary key table, such as deletions, are checked to ensure they do not break connections to the foreign key table.

Creating Relationships Between Tables

Relationships between tables in a database are built using foreign keys. When a table includes a foreign key, it becomes the child table, while the table with the primary key is the parent table.

By defining these keys, the database design reflects real-world associations, such as a student table linking to a course table through student IDs.

The foreign key constraint requires that the foreign key value matches a primary key value in the parent table. This setup prevents data entry errors and enhances data accuracy.

Additionally, foreign keys can also reference columns within the same table, creating self-referential relationships.

Enforcing Data Integrity with Constraints

Data integrity is vital in database management. Constraints in SQL help ensure that the data remains accurate, reliable, and consistent. This section explains how NOT NULL, UNIQUE, CHECK, and DEFAULT constraints work in maintaining data integrity.

NOT NULL and UNIQUE Constraints

NOT NULL constraints ensure that a column cannot have a missing or null value, which helps maintain completeness in the database records. This means that every row must have an entry in a column marked as NOT NULL, ensuring important data doesn’t end up missing.

UNIQUE constraints are used to maintain uniqueness across entries within a table. This prevents duplicate values from being entered in columns where unique entries are required. For instance, an email field in a user database usually has a UNIQUE constraint to avoid duplicate registrations with the same email address.

Combining NOT NULL and UNIQUE enhances data control, ensuring entries are both present and distinct where necessary.

CHECK and DEFAULT Constraints

CHECK constraints add custom rules to determine what values can be entered into a column. For instance, a CHECK constraint can ensure that a numerical field like age must be greater than zero, thus maintaining the validity of data entries.

They use Boolean logic to evaluate whether data meets predefined conditions before it is accepted.

DEFAULT constraints automatically assign a specified default value if no other value is provided during the data entry. This is helpful in maintaining data consistency. For example, if a column for a “status” in a user profile is often set to “active,” the DEFAULT constraint can fill in “active” unless another value is specified.

Each constraint serves a unique purpose, contributing to a structured and reliable database system.

Using Indexes to Improve Performance

Indexes are vital to speeding up SQL queries. They reduce the workload on databases by allowing faster data retrieval. Implementing effective indexes can greatly enhance database performance.

The Purpose of Indexes

Indexes serve as an efficient way to access data within a database. They function much like an index in a book, allowing users to quickly locate the information they need without scanning each page.

By organizing data into a B-tree structure, indexes streamline access, which can significantly reduce query times.

Businesses heavily utilize indexes to improve their database performance. A non-clustered index is commonly used, which creates a separate structure for the index, leaving the table’s data in its original state. This setup helps manage large databases, as it speeds up searches without altering data organization.

Creating and Managing Indexes

To begin using indexes, one starts with the CREATE INDEX statement in SQL. This statement sets up the index on specified columns of a table. For instance, creating an index on a customer’s name can be done by using CREATE INDEX idx_customers_name ON customers (name).

Managing indexes involves monitoring their performance and updating them as data changes. Regular updates prevent databases from slowing down due to outdated indexing structures.

Poorly chosen indexes can actually hinder performance, so it’s essential to tailor them to the specific needs of the database design and query patterns.

Advanced Table Customization

In SQL, advanced table customization focuses on altering existing tables to better fit data needs and using views to streamline data management.

This involves making precise changes to improve data handling and retrieval.

Altering Existing Tables

Altering existing tables helps adapt a database to changing data requirements. The ALTER TABLE command is vital for modifying table structures.

Users can add, modify, or drop columns, allowing them to update table schemas without data loss. Adding constraints like PRIMARY KEY or UNIQUE ensures data integrity.

For instance, adding an IDENTITY column can simplify sequential data entry.

Detailed use of these commands requires hands-on experience. Practical application helps users understand how to adjust tables smoothly while maintaining data accuracy.

It’s important to keep database service downtime to a minimum during such operations.

Working with Views

Views are virtual tables that help in data management by presenting data in a specific way without altering the actual tables. They act as a layer overbase tables, simplifying complex queries and protecting sensitive data.

Views can combine information from multiple tables, offering a streamlined perspective on the data.

Using views allows users to update data through them, under certain conditions, providing flexibility. They also aid in restricting access to certain rows or columns, ensuring that users interact with only necessary data.

Creating and managing views requires a solid grasp of SQL syntax and understanding of database structure, offering a powerful tool for effective database management.

Applying Best Practices for SQL Table Creation

A computer screen showing a database schema with tables, columns, and constraints

When creating SQL tables, it’s essential to focus on effective design strategies to ensure data reliability and performance.

Key aspects include balancing normalization with denormalization and designing tables that are both secure and scalable. These practices improve data management and system efficiency.

Normalization vs. Denormalization

Understanding the balance between normalization and denormalization is crucial in database design.

Normalization involves organizing data to reduce redundancy and improve data integrity. Techniques like splitting a large table into smaller tables help in achieving this. However, it can sometimes lead to complex queries and slower performance due to excessive joins.

On the other hand, denormalization can improve query performance by storing related data in fewer tables, simplifying access patterns. This approach, while faster for read operations, can increase redundancy and potential anomalies during data updates.

A balanced approach is vital, considering the specific needs of the system. Using a hybrid model often offers the best trade-off between performance and data integrity, accommodating both complex queries and data consistency.

Secure and Scalable Table Design

Security and scalability are essential in table design, impacting both data protection and system growth.

Implementing SQL constraints is a core practice to ensure data validity. Constraints like NOT NULL and UNIQUE prevent invalid entries, maintaining accurate records as noted in resources like W3Schools.

For security, granting appropriate table-level permissions is crucial. Limiting access to only those who need it helps prevent unauthorized data changes.

Scalability requires considering data growth from the beginning. This involves choosing suitable data types and indexing strategies that support efficient data retrieval and management as highlighted in the tutorial from EssentialSQL.

This preemptive planning ensures that the database can handle increased load and data volume over time.

Managing Data Operations

A person creating SQL tables and databases with data entry constraints

Managing data operations in SQL involves inserting, updating, and deleting data while maintaining database integrity. These processes ensure that tables, data entries, and overall data consistency are effectively handled.

Inserting and Updating Data

Inserting new data into tables can be achieved using the INSERT INTO command. This command allows users to add data into specific columns of a table.

When adding data, users should consider data types and constraints to maintain the integrity of the database. SQL commands like CREATE TABLE and INSERT INTO play a key role in this process.

Updating existing data is done using the UPDATE statement. It modifies data in one or more columns of a table based on specified conditions.

For example, changing a customer’s address requires specifying which customer record to update.

Triggers can also automate updates when certain conditions are met. They are set up to run specific SQL commands automatically, ensuring that data remains consistent without manual intervention.

Deleting Data and Dropping Tables

Deleting data from tables is managed through the DELETE command. This command removes specific rows based on given conditions.

Care must be taken, as deleting data is irreversible. It’s crucial to verify conditions before executing this command to prevent loss of important data.

If an entire table is no longer needed, it can be removed with the DROP TABLE command. Dropping a table deletes all associated data and cannot be undone.

Thus, dropping should be performed cautiously and usually involves a backup strategy.

In SQL, deleting and dropping operations require careful planning due to their potentially destructive nature. Safeguards like permissions and triggers help manage these operations effectively, aligning with the goals of data management.

Exploring Database Engines

A computer screen displaying a database schema with tables, columns, and constraints

When creating SQL tables, choosing the right database engine is crucial. Different engines offer unique features and performance aspects. This section explores key comparisons and guides on selecting the best fit for specific needs.

Comparison of SQL Server, MySQL, and PostgreSQL

Microsoft SQL Server is favored for large enterprises due to its robust security features and seamless integration with Microsoft products. It offers comprehensive support, making it suitable for critical applications.

MySQL is well-known for its speed and efficiency in read-heavy operations. It is widely used for web applications and is part of the LAMP stack (Linux, Apache, MySQL, PHP/Perl/Python). MySQL supports a wide range of storage engines, which adds to its flexibility.

PostgreSQL is recognized for its advanced features and compliance with SQL standards. It supports a variety of data types and advanced indexing, which is beneficial for complex queries. PostgreSQL is often chosen for applications requiring complex data operations.

Choosing the Right Database Engine

Selecting the right engine depends on project requirements. Consider the scale of the application and the expected load.

For large-scale operations with deep integration needs, Microsoft SQL Server might be the best option.

MySQL fits well for applications with high transaction volumes and fast read requirements, especially in web development. It is often selected for its performance and ease of use.

For applications needing advanced data capabilities and robust data integrity, PostgreSQL is preferable. It offers powerful data types and supports stored procedures, making it versatile for various application needs.

Understanding these differences helps in making informed decisions that align with organizational goals. Each engine has strengths tailored to different scenarios, ensuring appropriate resource usage and performance.

Frequently Asked Questions

An instructor demonstrating how to create SQL tables with data constraints

Creating SQL tables with constraints ensures data accuracy and integrity. These questions cover essential aspects of how to use various integrity constraints, create databases, and implement constraints in database management.

What are the different types of integrity constraints available in SQL and how do they function?

SQL offers several integrity constraints including PRIMARY KEY, FOREIGN KEY, UNIQUE, NOT NULL, and CHECK.

PRIMARY KEY ensures each row is unique, FOREIGN KEY establishes links between tables, UNIQUE ensures no duplicate values, NOT NULL prevents missing entries, and CHECK limits the values that can be entered.

How can one create a new SQL database with tables that include defined constraints?

To create a database with tables and constraints, the CREATE DATABASE command is first used to set up the database. This is followed by the CREATE TABLE command where constraints like PRIMARY KEY and FOREIGN KEY are included in the table definitions.

For detailed guides, resources like LearnSQL.com are helpful.

Can constraints be added to an existing SQL table, and if so, what is the process?

Yes, constraints can be added to existing tables using the ALTER TABLE command. This command allows users to add constraints such as ADD CONSTRAINT for primary keys or foreign keys.

This modification ensures existing data follows new rules without needing to recreate the table.

What are the steps for writing an SQL script that creates a database including tables with constraints?

Writing an SQL script involves several steps. First, use CREATE DATABASE to establish the database.

Then, within a script, CREATE TABLE statements define each table with appropriate constraints, ensuring data integrity from the start. The script ends with INSERT statements for populating data.

Online tutorials, like those on Coursera, can provide step-by-step guidance.

What is the CHECK constraint and how is it implemented in SQL table creation?

The CHECK constraint ensures that all values in a column meet a specific condition. It is added during table creation with CREATE TABLE or to an existing table with ALTER TABLE.

For example, a salary column can have a CHECK constraint to ensure values are above a certain number. This helps maintain data accuracy.

How does one ensure data integrity in an SQL database through the use of constraints?

Ensuring data integrity involves using constraints effectively.

Utilize PRIMARY KEY to prevent duplicate rows, and FOREIGN KEY to maintain relationships between tables.

NOT NULL ensures essential data is not missing, while UNIQUE prevents duplicate values.

CHECK enforces data value rules. These collectively maintain consistency and accuracy in a database.

Categories
Uncategorized

Learning How To Program Database Objects: Streamlining Code for Team Efficiency

Understanding Database Objects in SQL Server

Database objects in SQL Server are essential components used to store, manage, and organize data. They help users efficiently handle large sets of information.

Tables are the backbone of any database. They store data in rows and columns, each with defined data types. This structure makes it easy to retrieve and manipulate specific data.

Views act like virtual tables. They don’t store data themselves but present it from other tables. This way, users can see a customized version of the data without altering the original tables.

Stored Procedures are precompiled batches of SQL statements. They perform tasks like data validation or manipulation, reducing the need for repeated code. These procedures enhance performance by minimizing the repetition of SQL code execution.

Functions offer predefined, reusable actions. Unlike stored procedures, they must return a value. They can take inputs and produce outputs, helping perform calculations and data transformations within queries.

Triggers are special types of stored procedures that automatically run when certain database events occur, like updates or deletions. They ensure data integrity by enforcing rules without manual intervention.

These database objects are integral to SQL Server, helping both individuals and teams manage data efficiently. Learning how to use them can greatly enhance productivity and accuracy in data management tasks. Each object serves specific purposes, making them valuable tools in any well-maintained database system.

Essentials of SQL Queries

A computer screen displaying SQL code for user defined functions and stored procedures

SQL queries are essential for interacting with databases. They allow users to efficiently retrieve, insert, update, and delete data. Understanding these commands can greatly enhance database performance and management.

Each command, such as SELECT, INSERT, UPDATE, and DELETE, plays a specific role in handling data.

Retrieving Data with the Select Statement

The SELECT statement is a fundamental query in SQL, used to retrieve data from one or more tables. It allows users to specify columns and conditions to filter the data.

Typically, the syntax begins with SELECT, followed by the column names and FROM to specify the table.

In SQL, a basic SELECT query might look like this:

SELECT first_name, last_name FROM employees WHERE department = 'Sales';

Here, the query fetches the first and last names of employees working in the sales department. Users can combine the SELECT statement with various clauses like WHERE, ORDER BY, and GROUP BY to refine the query results effectively.

Inserting Data with the Insert Command

The INSERT command adds new rows to a table. Users must specify which table to insert data into and provide the values for required columns.

The syntax generally starts with INSERT INTO, followed by the table name, the list of columns, and the VALUES clause with the corresponding data values.

For example:

INSERT INTO employees (first_name, last_name, department) VALUES ('John', 'Doe', 'Marketing');

This command inserts a new employee, John Doe, into the Marketing department. Handling potential errors is crucial, such as ensuring the correct data types for each column and considering constraints like NOT NULL.

Updating Records with the Update Statement

The UPDATE statement modifies existing data within a table. Users can change one or more records by specifying conditions that identify which rows to update.

The syntax begins with UPDATE, followed by the table name, the SET clause for new values, and WHERE to specify the condition:

UPDATE employees SET department = 'HR' WHERE first_name = 'John' AND last_name = 'Doe';

This command moves John Doe to the HR department. Always use the WHERE clause carefully to avoid updating unintended records. Including backup steps is also advisable to prevent accidental data loss.

Deleting Data with the Delete Command

The DELETE command removes rows from a table. It requires careful handling to ensure the correct records are deleted without affecting others.

The command structure starts with DELETE FROM, followed by the table name, with an optional WHERE clause to specify the rows to delete:

DELETE FROM employees WHERE last_name = 'Smith';

This command deletes all employees with the last name Smith. Without a WHERE clause, all records will be removed, so caution is necessary. Implementing checks or backups can prevent unwanted deletions and data loss.

User-Defined Functions (UDFs)

User-Defined Functions (UDFs) allow developers to extend database systems by writing custom functions. This can enhance the functionality beyond built-in options, enabling specific data operations and calculations customized to the user’s needs.

Types and Uses of UDFs

UDFs can be categorized based on various parameters such as the type of inputs they handle and the data they return.

Common types include scalar UDFs, which return a single value, and table UDFs, which return a table.

Scalar UDFs are often used to perform calculations or transformations on one row at a time.

Table UDFs, on the other hand, process multiple rows and can return multiple columns. They are particularly useful in scenarios where a result set needs to be manipulated or filtered based on complex logic.

These functions can handle different data types like integers or strings, which makes them versatile in various applications.

Creating and Managing UDFs

To create a UDF, developers define the function using a language supported by the database, such as SQL, Python, or JavaScript. Each UDF includes parameters that specify the inputs the function will handle.

For example, developers can use the Snowpark API to create UDFs in Python.

Managing UDFs involves ensuring they execute securely and efficiently. Best practices include granting the right privileges and performing regular audits to prevent unauthorized access.

As part of management, one might ensure functions convert data accurately, such as using functions to convert data formats or extract a date with GETDATE(). Proper management enhances performance and maintains data security.

Stored Procedure Advantages

Stored procedures offer several benefits that can significantly improve database management. These include ensuring code reuse, enhancing performance, and providing robust security. Understanding these advantages can help in effectively leveraging stored procedures in any database environment.

Encapsulation and Reusability

Stored procedures encapsulate complex SQL logic within the database. This means that the same logic can be reused without having to rewrite SQL queries repeatedly. It simplifies database operations for developers and database administrators. When changes are needed, they only have to be done in one place.

Additionally, by encapsulating logic, stored procedures promote a modular approach. They allow different parts of an application to call and use the procedure, ensuring consistent and error-free execution. This modularity supports easier maintenance and improves code organization.

Performance Benefits

By reducing the amount of data sent between the server and the client, stored procedures enhance performance. They are precompiled, which means the database server can run them faster than ad-hoc SQL statements. This is vital for applications with high data processing demands.

Also, stored procedures help in efficient query processing. Over time, the database server optimizes execution plans for stored procedures, further improving speed.

These performance gains can be especially noticeable in applications requiring frequent or complex database interactions.

Security Enhancements

Stored procedures add a layer of security by controlling data access and operations. They can implement business rules within the database, thus reducing the risk of unauthorized data manipulation.

Users can be granted permissions to execute specific procedures without direct access to the underlying tables.

Moreover, stored procedures minimize the risk of SQL injection attacks. By parameterizing queries, they create a safe execution environment, protecting sensitive data.

These advantages demonstrate why stored procedures are a valuable tool in database management, providing encapsulation, performance benefits, and security enhancements. They make database operations more efficient, secure, and maintainable. For more details on the benefits, you can refer to articles like those on SQL Shack and GeeksforGeeks.

Writing and Managing Stored Procedures

Writing stored procedures involves understanding their syntax and structure, utilizing control-of-flow with T-SQL, and handling errors and transactions effectively. These core concepts ensure robust database operations and efficient management of frequently used SQL statements.

Syntax and Structure of Stored Procedures

Creating a stored procedure involves defining it using a specific syntax. To start, use the CREATE PROCEDURE statement, followed by procedure name and parameter list. Inside the procedure, SQL statements are written to perform desired operations.

For instance, a basic syntax would look like this:

CREATE PROCEDURE procedure_name
    @parameter_name data_type = default_value
AS
BEGIN
    SQL_statement
END

Parameters make procedures flexible, allowing users to input values when executing the stored procedure. It’s essential to follow the correct order: parameter declaration, followed by the main SQL logic within BEGIN and END. Making it dynamic allows for changing values without altering the code body itself.

Control-of-Flow with T-SQL in SPs

Control-of-flow in stored procedures employs T-SQL constructs to manage the sequence of statements executed. Commonly used statements include IF...ELSE, WHILE, and CASE.

For example, IF...ELSE can help run different blocks of code based on certain conditions.

Here’s an example:

IF @condition = 'value'
BEGIN
    SQL_statement
END
ELSE
BEGIN
    SQL_statement
END

These constructs provide flexibility and control, enabling stored procedures to handle various scenarios. They ensure that the procedure adapts to inputs and system states, promoting efficiency.

Additionally, T-SQL offers commands like ALTER PROC to modify existing procedures without rewriting them entirely.

Error Handling and Transactions

Error handling in stored procedures is crucial to maintain data integrity. Using TRY...CATCH blocks, developers can catch errors and respond appropriately.

Here’s a basic structure:

BEGIN TRY
    SQL_statement
END TRY
BEGIN CATCH
    Error_handling_statement
END CATCH

Transactions further ensure consistency by grouping multiple operations as a single unit. Use BEGIN TRANSACTION, COMMIT, and ROLLBACK to manage these.

This ensures either all operations succeed, or none is applied, preventing partial updates.

Parameterization in Stored Procedures

Stored procedures often use parameters to make queries flexible and dynamic. These parameters serve as placeholders, allowing developers to insert different values when executing a procedure. This avoids hardcoding values and enhances reusability.

In a user-defined stored procedure, input parameters let the caller pass specific data. Suppose a procedure fetches customer orders based on inputs like customer ID or order date. The procedure runs with any combination of these parameters, making it versatile.

Input parameters also improve security. They help limit SQL injection risks by safely handling user data. Instead of directly inserting user data into SQL statements, parameters ensure that execution handles data appropriately.

Here’s a simple example:

CREATE PROCEDURE GetOrderDetails
    @CustomerID INT,
    @OrderDate DATE
AS
BEGIN
    SELECT *
    FROM Orders
    WHERE CustomerID = @CustomerID AND OrderDate = @OrderDate
END

This procedure takes two parameters: @CustomerID and @OrderDate. Users input these to receive specific order details. Parameters like these make stored procedures more efficient, safer, and easier to maintain.

Parameterized stored procedures can also boost performance. The database engine caches execution plans for these procedures, reducing the need for recompilation. This feature makes repeated execution faster, especially when procedures are complex.

Understanding Transactions and Locking Mechanisms

A programmer writing code for database objects with a focus on transactions and locking mechanisms

Database transactions play a key role in maintaining data integrity. In SQL Server, a transaction is a sequence of operations performed as a single logical unit. For successful execution, it follows the ACID properties: Atomicity, Consistency, Isolation, and Durability. These ensure that transactions are completed fully or not at all.

Locks are crucial for handling concurrency when multiple users access data. They prevent conflicts that could lead to data corruption. SQL Server uses various lock types, such as shared, exclusive, and update locks, to manage data access securely. Each type has specific purposes, affecting how data is read or modified.

Transaction Types:

  • Implicit Transactions: Automatically start with data modification statements.
  • Explicit Transactions: Manually start and end using BEGIN TRANSACTION and COMMIT or ROLLBACK statements.

Locking Mechanisms:

Locks come in different granularities, from row-level to table-level, depending on the operation’s scope. In large transactions, row-level locks can improve performance by reducing contention.

When a transaction needs to secure data, a process called blocking can occur. If not managed, this can lead to deadlocks, where two or more transactions wait indefinitely for resources held by each other, halting progress.

Transact-SQL supports defining transactions and managing locks effectively. Well-written database code can minimize contention and enhance performance. With Oracle Database, managing transactions ensures efficient and error-free database operations.

Securing Database Objects

A programmer creating and organizing database objects on a computer screen

Securing database objects such as stored procedures and user-defined functions is crucial to protect data and maintain integrity. Key aspects include implementing permissions correctly and following best practices for database security to prevent unauthorized access and data breaches.

Implementing Permissions

Granting the appropriate permissions is essential for database security. These permissions determine who can view, change, or delete data. By using stored procedures, access can be controlled without exposing the base tables directly. For example, SQL Server checks security on stored procedures instead of the underlying tables as long as they share the same owner. This method keeps sensitive data safeguarded while still allowing necessary operations.

Developers should define roles and assign permissions based on user needs. Least privilege is a vital principle, ensuring users only have access that is essential for their role. Regular audits of user permissions help ensure compliance with this principle and can uncover any excess privileges that might pose a security risk.

Best Practices for Database Security

Best practices for securing database objects include employing strong authentication methods and ensuring data encryption both at rest and in transit. Encryption is vital to safeguard data from unauthorized access. Additionally, implementing security patches regularly can prevent vulnerabilities from being exploited by malicious entities.

It’s also important to use parameterized queries instead of directly embedding user inputs in SQL statements. This practice avoids infection from SQL injection attacks. Regularly reviewing security logs and conducting vulnerability assessments are critical to identifying potential threats and understanding the security landscape, thereby enhancing the overall security posture.

Finally, backup policies should be established to recover data in case of a security breach, ensuring business continuity and data restoration after any data loss incidents.

Optimization Techniques for Queries and Stored Procedures

A programmer writing code for database optimization techniques

Optimizing database queries and stored procedures is essential for enhancing performance. One effective technique is to avoid using the prefix “sp_” in stored procedure names. This prevents unnecessary searches in the master database, reducing overhead and potential errors. For more insights on this, see SQL Server’s stored procedure optimization tips.

When dealing with complex calculations, it’s beneficial to use scalar variables or parameters rather than operating directly on columns. This strategy helps streamline processing. For further tips, consider exploring SQL Server’s query optimization techniques.

Modular programming in SQL should be approached with caution. Though breaking down code can be helpful, avoid using scalar user-defined functions too often since they can slow down performance by acting like loops. For additional advice, check out how to optimize stored procedures.

Utilizing aggregate functions wisely can enhance efficiency. Ensure that any complex logic is moved away from database columns and managed through parameters. More on query techniques can be found in SQL Shack’s article on SQL Server tips and tricks.

Code reuse is another key component of optimization. By storing frequently used queries in stored procedures or views, maintainability and readability improve. This approach not only aids in developing efficient systems but also supports team collaboration by providing clear and shared resources.

Effective Naming Conventions

A programmer creating and organizing database objects like functions and procedures in a virtual workspace

Naming conventions are essential in programming database objects like stored procedures and user-defined functions. A consistent naming strategy helps in maintaining clarity and reduces the chances of errors.

Stored Procedures: Avoid using the sp_ prefix for stored procedures. This prefix is reserved for system procedures and can create confusion, causing the database to search the master database unnecessarily. Use descriptive names that clearly define the procedure’s purpose, such as get_user_info.

User-Defined Functions: Prefix user-defined functions with fn_ to distinguish them from other functions. This practice helps identify them as custom functions, which enhances organization and usability within the code.

A list of practical best practices for naming includes:

  • Use underscores (_) to separate words for readability, like user_details.
  • Avoid abbreviations that are not universally understood.
  • Keep names short but meaningful.

An example of a naming convention table:

Object Type Convention Example
Stored Procedure verb_noun get_customer_data
User-Defined Function fn_verb_noun fn_calculate_tax
Table noun employee
Column data_type_noun int_age

Foreign Keys: Name foreign keys with the format fk_primaryTable_secondaryTable. This format clearly shows the relationship between tables and aids in database navigation and management.

Consistency in naming conventions makes your database more intuitive, aiding both new and experienced team members. Effective naming conventions enhance code readability and maintainability.

Utilizing SQL Server Management Studio (SSMS)

A person working on a computer, using SQL Server Management Studio to create user defined functions and stored procedures

SQL Server Management Studio (SSMS) is an important tool for database management. It provides a complete interface to manage all SQL Server components. Users can interact with databases, query engines, and more using this powerful environment.

Connecting to a Server: To start, launch SSMS and connect to a SQL Server instance. Input the server name, authentication type, and credentials. Once connected, users can access their databases.

Creating Database Objects: SSMS allows for the creation and management of various database objects. For instance, users can develop user-defined functions and stored procedures using the SSMS Query Editor. This editor supports writing, testing, and saving T-SQL queries, covering a broad range of database operations.

Query Editing and Execution: SSMS’s Query Editor is key for database operations. It helps in crafting queries, executing them, and viewing results. This feature aids in creating efficient database routines, such as stored procedures and user-defined functions.

Generating Scripts: Users can generate scripts for database objects in SSMS. Right-click a database, choose ‘Tasks,’ then ‘Generate Scripts.’ This generates script templates, making it easier to manage database changes.

Organizing with Folders: Databases and objects can be organized using folders in SSMS. Expand database nodes to see tables, views, and other objects. This visual organization simplifies managing complex databases.

SSMS is compatible with SQL Server, Azure SQL Database, and more. Users can access both on-premises and cloud-based databases efficiently. This versatility enables seamless database administration across different environments.

Integrating with Other Database Objects

A programmer creating database objects like user-defined functions and stored procedures

Integrating stored procedures and user-defined functions with other database objects is essential for efficient database management. Stored procedures can interact with views to retrieve data quickly. They can execute complex queries and return datasets, simplifying data analysis for developers and analysts.

User-defined functions are versatile. They can be used in SELECT statements to manipulate data on-the-fly. For instance, computing totals or averages becomes straightforward with functions in SQL queries.

A foreign key helps maintain data integrity between tables. Stored procedures can leverage foreign keys to join tables seamlessly. By ensuring relationships between tables, they keep the data consistent and reliable.

Example: Using a Stored Procedure with a View

A view can summarize data from one or more tables. Integrating a stored procedure with a view can simplify the process of retrieving detailed datasets. This combination can reduce network traffic, as complex logic is processed within the database.

Advantages:

  • Reduced Network Traffic: Only necessary data is sent over the network.
  • Security: Procedures help in controlling access to data manipulation operations.
  • Centralized Logic: Complex business logic can be encapsulated.

Example Code Snippet:

CREATE PROCEDURE GetEmployeeData
AS
BEGIN
    SELECT EmployeeID, FirstName, LastName FROM EmployeeView
END

By using these techniques, database management becomes more streamlined. Consistent use of procedures and functions ensures robust, scalable database systems that can adapt to changing needs.

Frequently Asked Questions

A programmer creating database objects with code and diagrams

Database objects like stored procedures and user-defined functions improve program efficiency and usability. They help interact with databases more effectively by allowing code reuse and controlled data manipulation. Understanding how to implement these objects is crucial for software development and database management.

How can I create a stored procedure to retrieve data from a specific table?

To create a stored procedure, the CREATE PROCEDURE statement is used. After specifying the procedure’s name, a SELECT statement is included to query the desired table. Execution permissions may need adjustment based on user roles. Consider performance optimization when dealing with large datasets.

What is the process for executing a stored procedure with parameters and obtaining a return value in C#?

In C#, calling a stored procedure with parameters involves using the SqlCommand object. Parameters are added with SqlParameter, and executing the procedure is typically done with ExecuteReader or ExecuteScalar, depending on the outcome needed. Handling exceptions and return values correctly is essential.

In what ways do user-defined functions differ from stored procedures, and under which circumstances is each one preferred?

User-defined functions and stored procedures both interact with SQL, but functions return values while procedures can perform actions without returning anything. Use functions for computation and manipulation within queries; procedures suit complex operations and database changes.

What steps are involved in generating a script for an existing stored procedure in SQL Server?

Creating a script for a stored procedure requires accessing SQL Server Management Studio. Here, users right-click the procedure and select “Script Procedure as,” followed by creation in a new query window. This allows viewing and modification of the existing script.

How can one utilize the Entity Framework to execute a stored procedure and work with its result set?

Using Entity Framework, stored procedures can be called by configuring the context class with a function import. The result can be mapped to entity classes or scalar values. This integration enables strong typing and easier data handling within .NET applications.

What database component should be used to structure the database and manage objects such as stored procedures?

For efficient management, SQL Server databases employ schemas, which provide organization and security for objects like stored procedures and tables.

Schemas help manage permissions and maintain object namespaces to avoid conflicts, supporting better database management practices.

Categories
Uncategorized

Learning Data Visualization in SQL: A Comprehensive Guide

Understanding SQL for Data Visualization

SQL, or Structured Query Language, is a powerful tool for interacting with relational databases. It’s essential for retrieving and manipulating data, making it crucial for data visualization tasks.

This section explores the basic SQL concepts necessary to enhance data understanding and extraction from databases.

Essentials of SQL Concepts

SQL serves as the backbone for managing relational databases, enabling users to perform operations such as querying, updating, and organizing data.

At the core, the SELECT statement is vital for choosing specific data columns. This makes it easy to tailor the data that is visualized.

Another key concept, FROM, specifies the tables to pull data from, creating a focus on relevant data sources.

The WHERE clause is critical for filtering data, ensuring that only relevant records are included in analyses. These features help transform raw data into meaningful insights.

Basic data exploration using SQL provides a solid foundation for building complex visualizations. Understanding these elements allows for the creation of effective visual displays that highlight important data trends and relationships.

Data Preparation Techniques

A person using a computer to analyze and visualize data using SQL techniques. Multiple data sets and charts are displayed on the screen

Data preparation is crucial for effective data visualization. It involves ensuring high data quality and performing necessary manipulations to make the data ready for visualization.

Data Quality and Cleaning

Maintaining data quality is essential. Analysts must identify and correct inaccuracies in the dataset. This process involves checking for missing values, removing duplicates, and correcting inconsistencies.

Tools like SQL allow for efficient quality checks using functions such as IS NULL, DISTINCT, and UPDATE.

Consistency is vital. Data must be in a uniform format before analysis. Data types should be standardized, and data entries should follow the same naming conventions. This may include converting date formats or ensuring all text entries are uniform, such as ensuring all names are capitalized.

Regular audits of the dataset can help spot errors. Implementing constraints in SQL, like NOT NULL and UNIQUE, can prevent future errors, ensuring the dataset remains reliable for continuous analysis.

Data Manipulation with SQL

SQL provides robust methods for data manipulation.

Filtering data is one of the primary tasks, and it is done using the WHERE clause. This allows analysts to work with relevant data subsets by specifying conditions the data must meet.

Aggregating data is another critical step. SQL functions like SUM, AVG, and COUNT are used to summarize data, providing insights into large datasets. These functions help in interpreting data trends and patterns by focusing on key metrics.

Grouping and ordering data improve clarity. Using GROUP BY organizes data into categories, while ORDER BY arranges data to highlight trends. This approach enhances the ability to extract actionable insights from datasets, making SQL a powerful tool in data visualization preparation.

SQL Query Fundamentals

A person studying a book on SQL fundamentals, with a computer screen showing data visualization in the background

Understanding the basics of SQL queries is essential for working with data. Key operations include selecting, filtering, sorting, and grouping data, allowing users to manipulate and view information as needed.

Selecting and Filtering Data

The SELECT statement is a crucial part of SQL queries. It retrieves specific columns from a database table. For example, SELECT name, age FROM people; will get names and ages from the table people.

Filtering enhances this by using the WHERE clause. It allows retrieval of rows that meet specific conditions. For instance, SELECT name FROM people WHERE age > 30; will fetch names of individuals older than 30.

Multiple conditions can be combined with AND or OR to refine results further.

Understanding these basic commands helps users focus on desired data without loading entire datasets, thus improving query efficiency. By filtering data at the query stage, unnecessary data processing is minimized, leading to better performance.

Sorting and Grouping Data

Sorting data is achieved using the ORDER BY clause. It sorts the result set by one or more columns. For example, SELECT name, age FROM people ORDER BY age DESC; will list people by age in descending order. This is useful for organizing data based on priority or significance.

Grouping data is managed through the GROUP BY clause. It aggregates data based on one or more columns. For example, SELECT department, COUNT(*) FROM employees GROUP BY department; calculates the number of employees in each department.

The HAVING clause can further filter these groups, for instance, HAVING COUNT(*) > 10 would only include groups with more than 10 members.

These tools allow for powerful data analysis by enabling users to view data from different perspectives and summarize large datasets effectively.

Advanced SQL Queries

Advanced SQL queries help analysts and developers extract more complex insights from databases. This involves using tools like Common Table Expressions (CTEs) and SQL Window Functions, which enhance query clarity and enable sophisticated data analysis.

Common Table Expressions

Common Table Expressions (CTEs) simplify complex queries by breaking them into more manageable parts. They allow users to define a temporary result set within a SQL statement, making the code cleaner.

CTEs are particularly useful for recursive queries, which require iterative processing without the complexity of self-joins or subqueries.

Using a CTE can streamline tasks such as hierarchical data processing or creating complex aggregations. Instead of writing multiple nested queries, a CTE allows the query writer to define a named temporary result that can be referenced multiple times within a single SQL statement. This improves readability and maintainability of SQL scripts by providing clarity and reducing redundancy.

SQL Window Functions

SQL Window Functions perform calculations across rows related to the current row within the result set, without collapsing them into a single output row. This feature is distinct from regular SQL aggregate functions as it retains the rows’ individuality while applying functions like rankings, running totals, and moving averages.

Window functions are defined within the OVER() clause, enabling calculations such as the cumulative sum or moving averages over a specified range.

With SQL Window Functions, users can analyze trends over sequences such as sales growth over time, without altering the structure of the dataset.

They are indispensable in financial analysis and data trend observations, where understanding changes over specified periods is crucial. This set of functions empowers analysts to deliver nuanced insights directly from SQL, facilitating a deeper analysis while keeping the data intact.

Integrating SQL with Data Analysis Tools

A computer screen displaying a SQL query alongside a chart and graph, with a data analysis tool open and SQL code visible

Integrating SQL with modern data analysis tools enhances the ability to handle, process, and visualize data efficiently. This integration combines SQL’s robust querying capabilities with the advanced analytical features of programming languages like Python and R.

SQL and Python Integration

Python is a versatile programming language used widely in data analysis and visualization. It pairs well with SQL for data manipulation and extraction, using libraries like Pandas for data handling.

These libraries can connect directly to SQL databases, allowing users to execute queries and import data easily.

Visualization tools such as Matplotlib and Seaborn work seamlessly with SQL data in Python. Users can create detailed plots that offer deeper insights into datasets.

For interactive charts, Plotly provides features that enable users to build rich, interactive visualizations reflecting real-time SQL data updates.

The flexible integration between SQL and Python is valuable for performing complex data analysis, ensuring data accuracy and enhancing the visual output. This collaboration empowers analysts to use SQL queries to gather data and leverage Python’s analytical strengths to transform and visualize it meaningfully.

SQL and R for Statistical Analysis

R is a powerful language specifically used for statistical analysis and graphical data representation. When integrated with SQL, it becomes a formidable tool for handling complex datasets and performing in-depth analyses.

Libraries like DBI and RMySQL provide interfaces for R to connect to SQL databases, enabling efficient data retrieval.

R’s strong statistical capabilities allow users to perform complex analysis on SQL data outputs. Statistical functions in R can be directly applied to data fetched from SQL databases, facilitating both predictive modeling and hypothesis testing.

Visualization packages in R, such as ggplot2, allow for the creation of custom plots that can highlight trends and patterns within data extracted from SQL.

This synergy enables analysts to capitalize on SQL’s management efficacy and R’s sophisticated statistical tools to comprehensively analyze datasets.

Creating Basic Visualizations with SQL

A computer screen with SQL code and colorful charts displayed

Creating visualizations in SQL involves translating data into a visual format such as charts and graphs. By manipulating SQL queries, data analysts can build visual tools to make data insights clear and accessible.

Basic visualization types include bar charts, pie charts, histograms, and line charts to represent different kinds of data stories effectively.

Charts and Graphs Essentials

Bar charts are ideal for showing comparisons among discrete categories. SQL queries that aggregate data like SUM or COUNT can help prepare data for these charts. Analysts can group and count items to show frequency or totals within each category.

Pie charts represent part-to-whole relationships. Using GROUP BY in SQL helps divide data into segments to display proportions.

Histograms are useful for showing distribution and identifying patterns in data. SQL can be used to calculate and group data into bins, which are then visualized to reflect the data frequency distribution.

Line charts effectively display trends over time. SQL can select and order data chronologically to visualize how data points change over periods. By selecting and arranging data sets appropriately, SQL queries guide in producing straightforward and insightful line charts.

Integrating SQL with visualization tools can enhance the capability to present complex data stories simply and effectively. Data analysts benefit from this synergy by crafting clear visual representations of comprehensive datasets.

Interactive Visualizations and Dashboards

A person using a computer to create interactive visualizations and dashboards while learning data visualization in SQL

Creating interactive visualizations involves using SQL to design engaging dashboards that help users explore data. Utilizing powerful tools like Tableau and Power BI, these dashboards allow for dynamic data presentations, enhancing data analysis and decision-making.

Designing Interactive SQL Dashboards

When designing an interactive SQL dashboard, clarity and usability are critical. Developers focus on arranging visual elements like charts and graphs for easy navigation. Colors and fonts are chosen to make data readable.

Important metrics and KPIs should be upfront. Incorporating filters and drill-down options lets users explore data subsets.

For e-commerce data, displaying sales trends and customer demographics can be useful. The aim is to present complex datasets in an easily digestible format.

Dashboard Tools and Platforms

Several tools facilitate the creation of interactive dashboards.

Tableau is known for its intuitive interface, allowing users to create complex visualizations without deep technical skills. It supports various data sources, including SQL databases, enabling detailed visualization.

Power BI is another popular choice, offering robust features for data connection and visualization. Its integration with Microsoft products makes it a preferred choice for businesses using SQL.

Both tools support real-time data updates, ensuring dashboards reflect the latest information. They offer customizable templates and widgets, allowing users to tailor dashboards to specific needs.

Analyzing Trends and Patterns

A person working at a computer, analyzing data trends and patterns using SQL data visualization tools

Analyzing trends and patterns in data is essential for gaining insights and making informed decisions. This involves examining time-series data and identifying outliers or anomalies that may affect the analysis.

Time-Series Analysis

Time-series analysis focuses on data points collected or recorded at specific time intervals. It helps in recognizing patterns over time, such as seasonality, trends, and cyclic behaviors.

Businesses often utilize this technique to forecast future events based on historical data.

By examining patterns in time-series data, analysts can develop strategies for managing inventory and anticipating market demands.

Using SQL, time-series analysis can identify trends by employing functions such as moving averages or exponential smoothing. These techniques help smooth out short-term fluctuations and highlight longer-term trends.

Visual tools, like line graphs, are common for displaying trends, making it easier to communicate insights to stakeholders. Visualization tools such as Power BI can enhance this process by allowing for more dynamic presentations of data trends.

Identifying Outliers and Anomalies

Outliers and anomalies can skew the interpretation of data, making it crucial to identify and address them properly. These are data points that deviate significantly from the majority of a dataset and can indicate errors, novel insights, or unexpected events.

In SQL, outlier detection can be achieved by using statistical techniques such as standard deviation or percentile ranks. This helps in isolating points that do not fit the expected pattern.

Handling anomalies involves deciding whether to remove them, investigate their causes, or consider them in further analysis.

Analyzing trends often involves identifying these deviations to ensure accurate modeling. Anomalies might uncover new patterns or trends that were previously unnoticed, offering unique insights into the data being studied.

Working with Different Dataset Types

A computer screen displaying various types of datasets with SQL code and visualizations on a desk with a notebook and pen

Analyzing diverse data types can enhance decision-making processes. Focusing on sales data and customer feedback can provide crucial insights for businesses.

Sales and Marketing Data

Sales data is fundamental for understanding a company’s performance in the market. Analyzing these datasets allows businesses to track revenue, identify trends, and optimize strategies.

Key metrics such as total sales volume, product category performance, and regional sales variations are essential when working with sales datasets.

A common approach involves using SQL to extract, aggregate, and filter sales data. This helps to create visualizations that highlight sales trends over time or by demographic segments.

Additionally, interactive dashboards can be developed to offer more detailed breakdowns and comparisons, improving strategic planning and resource allocation.

Customer Feedback Analysis

Customer feedback data provides valuable insights into customer satisfaction and areas for improvement. This dataset often includes survey responses, reviews, and service tickets.

It is crucial for identifying patterns in customer preferences and common issues faced by customers.

By using SQL queries, analysts can segment feedback by category, rating, or geographic location. This helps in pinpointing strengths and weaknesses in products or services.

Visual tools can then translate this data into actionable insights, enhancing customer experience by addressing specific concerns and recognizing positive trends. The analysis of customer feedback can lead to improved products and more effective marketing strategies.

Data Visualization for Business Decision-Making

A laptop displaying a SQL data visualization dashboard, with charts and graphs representing business data for decision-making

Effective data visualization is key to making business decisions. By transforming complex data into visual formats, companies can gain insights rapidly. Visual tools like charts and graphs make patterns and trends clear.

Businesses rely on visualizations to create insightful reports. These reports help stakeholders understand the data’s impact on strategic goals. Graphs and charts can illustrate sales performance and market trends.

Data-driven insights support informed decision-making. Visualizations allow decision-makers to assess data credibility quickly. This approach minimizes risks and fosters confidence in choices made.

List of Benefits:

  • Simplifies complex data
  • Enhances trend identification
  • Aids in storytelling

A compelling visualization captures the audience’s attention. It presents information in an engaging manner, ensuring stakeholders comprehend the message. This ensures that the data can drive meaningful actions that align with goals.

For those looking to deepen their understanding, the importance of data visualization in business settings is emphasized through various resources. Understanding how to leverage visual tools can help businesses navigate complex environments effectively.

Best Practices for SQL Data Visualization

A laptop displaying a SQL database with colorful, interactive charts and graphs

In the realm of SQL data visualization, accuracy and ethical considerations are crucial. Ensuring precise representations avoids misleading results, while ethical presentation maintains integrity and trust.

Ensuring Accurate Representations

Accurate data visualization starts with clean and correct data. Analysts should employ SQL queries that minimize errors.

Using SQL’s error-checking features helps avoid mistakes during data extraction and manipulation.

A significant aspect of accuracy is selecting appropriate visualization types. For example, bar charts effectively compare values, while line graphs are ideal for trends over time.

Consistency in scales, colors, and formats ensures clarity. Automatic tools and libraries, like Plotly and Bokeh, assist in maintaining standards by offering pre-set structures and validation options.

Ethical Considerations in Data Presentation

Ethics in data visualization deal with honesty and transparency. Presenting data without bias avoids skewing audience perceptions.

It’s vital to clearly label axes and scales to prevent misunderstanding. Avoid using exaggerated scales that might mislead viewers.

Ethical considerations also encompass data privacy. Data professionals must ensure data is anonymized if required, protecting individual identities.

Following ethical guidelines preserves trust and demonstrates professionalism. Organizations, such as Five, emphasize the importance of filters and reports that align with ethical standards, ensuring end-users receive true insights.

Frequently Asked Questions

A person studying a book titled "Frequently Asked Questions Learning Data Visualization in SQL" with a computer and charts in the background

Learning data visualization in SQL involves understanding best practices, utilizing tools, and grasping concepts such as schema visualization and the role of psychology. Exploring practical applications like using Tableau Public can enhance the effectiveness of SQL-based data visualizations.

What are the best practices for learning data visualization with SQL Server?

Best practices include starting with basic queries to manipulate and extract data. Understanding different SQL functions and how they impact visualization is crucial.

Regular practice and experimenting with real datasets helps build skills. Learning to use SQL Server’s built-in visualization tools can also be beneficial.

What open-source SQL data visualization tools are available?

Open-source tools like Grafana and Metabase can be used to create interactive visualizations from SQL data. They offer user-friendly interfaces and support multiple data sources.

Exploring these tools provides valuable experience in data visualization without needing proprietary software.

How can one visualize a SQL database schema?

Visualizing a SQL database schema can be done with tools like DBDiagram or using SQL Server Management Studio’s diagram functionality. These tools help in creating visual representations of tables, relationships, and keys, making it easier to understand and manage complex databases.

Are there online SQL visualization tools for beginners?

Yes, beginners can use Chartio or Google Data Studio to create simple visualizations from SQL queries. These platforms offer drag-and-drop features and intuitive interfaces, making it easier for newcomers to get started with data visualization.

What is the role of psychology in effective data visualization?

Psychology plays a crucial role by influencing how visual elements are perceived. Understanding concepts like color theory, cognitive load, and visual hierarchy can enhance the clarity and impact of data visualizations. Effective visuals can lead to better insights and decision-making.

How can Tableau Public be utilized for SQL-based data visualizations?

Tableau Public is a free tool that allows users to connect to SQL databases and create interactive dashboards. By leveraging its features, users can transform complex data into compelling visuals.

This tool provides an excellent platform for sharing insights derived from SQL data.

Categories
Uncategorized

Learning about Machine Learning with SciKit Learn: A Comprehensive Guide

Understanding Scikit-Learn and Its Ecosystem

Scikit-Learn is a crucial library in the Python machine learning environment, offering integration with tools like NumPy, SciPy, and Pandas to enhance data analysis and modeling efficiency.

These connections allow for powerful data manipulation, efficient execution of mathematical operations, and seamless installation processes.

Origins of Scikit-Learn

Scikit-Learn originated as a Google Summer of Code project in 2007 with initial contributions by David Cournapeau. It belongs to the broader SciPy ecosystem and was officially launched in 2010.

Originally designed to be a versatile tool, it focuses on providing accessible and efficient machine learning methodologies in Python. Over the years, it has become a staple for data scientists and researchers due to its robust set of algorithms and ease of use. Its open-source nature encourages contribution and improvement from developers all over the world.

Integrating Scikit-Learn with Numpy and Scipy

Scikit-Learn integrates smoothly with NumPy and SciPy, which are fundamental libraries for scientific computing in Python. NumPy provides powerful operations on large, multi-dimensional arrays and matrices, while SciPy offers modules for optimization, integration, and statistics.

Together, they enable Scikit-Learn to handle complex data operations efficiently. This integration allows for rapid prototyping of machine learning models, leveraging NumPy’s array-processing features and SciPy’s numerics.

Users can perform advanced computations easily, making Scikit-Learn a reliable choice for building scalable, high-performance machine learning applications.

Role of Pandas in Data Handling

Pandas plays an essential role in preprocessing and handling data for Scikit-Learn. Its powerful DataFrame object allows users to manage and transform datasets with ease.

With functions for filtering, aggregating, and cleaning data, Pandas complements Scikit-Learn by preparing datasets for analysis. Utilizing Pandas, data scientists can ensure that features are appropriately formatted and that any missing values are addressed.

This preprocessing is crucial before applying machine learning algorithms, ensuring accuracy and reliability in model predictions. By integrating these libraries, users can create seamless and efficient data workflows from start to finish.

Basics of Machine Learning Concepts

Machine learning involves teaching computers to learn patterns from data. Understanding its core concepts is crucial. This section focuses on different learning types, predicting outcomes, and working with data.

Using SciKit Learn, a popular Python library, can simplify handling these concepts.

Supervised vs. Unsupervised Learning

Supervised learning involves models that are trained with labeled data. Each input comes with an output, which helps the model learn the relationship between the two.

This method is often used for tasks like email filtering and fraud detection because the known outcomes improve prediction accuracy.

In contrast, unsupervised learning works with data that has no labels. The model attempts to find patterns or groupings on its own.

This approach is useful for clustering tasks, like grouping customers based on buying patterns. Both methods form the backbone of machine learning.

Understanding Classification and Regression

Classification refers to the process of predicting the category of given data points. It deals with discrete outcomes, like determining if an email is spam or not.

Tools such as decision trees and support vector machines handle these tasks effectively.

On the other hand, regression aims to predict continuous outcomes. It deals with real-valued numbers, like predicting house prices based on features.

Common algorithms include linear regression and regression trees. Both techniques are vital for different types of predictive modeling.

Features, Labels, and Target Values

Features are the input variables used in machine learning models. These can be anything from age and gender to income levels, depending on the problem.

Labels are the outcomes for each feature set, serving as the “answer key” during training.

In supervised learning, these outcomes are known, allowing the model to learn which features impact the result. Target values, often referred to in regression, are the data points the model attempts to predict.

Understanding how features, labels, and target values interact is essential for effective modeling. Emphasizing precise selection helps enhance model accuracy.

Essential Machine Learning Algorithms

A computer screen displaying code and visualizations of machine learning algorithms with a book on SciKit Learn open next to it

This section focuses on vital machine learning models: Support Vector Machines (SVM), k-Nearest Neighbors (k-NN), and Linear Regression. Each technique has distinct features and applications, crucial for predictive modeling and data analysis.

Introduction to SVM

Support Vector Machines (SVM) are powerful for classification tasks. They work by finding the hyperplane that best separates different classes in the data.

SVM is effective in high-dimensional spaces and is versatile thanks to kernel functions.

Key to SVM is margin maximization, separating data with the largest possible gap. This improves the model’s ability to generalize to new data.

SVM can handle linear and non-linear data using kernels like linear, polynomial, and radial basis function. This flexibility is valuable for complex datasets.

Exploring k-Nearest Neighbors

The k-Nearest Neighbors algorithm (k-NN) classifies data based on the closest training examples. It is simple yet effective for various tasks.

In k-NN, data points are assigned to the class most common among their k closest neighbors. The choice of k controls the balance between bias and variance.

Distance metrics such as Euclidean and Manhattan are essential in determining closeness. Proper normalization of features can significantly impact results.

k-NN is computationally expensive for large datasets, as it requires calculating distances for each query instance. Despite this, it remains popular for its straightforward implementation and intuitive nature.

Linear Regression Techniques

Linear regression is fundamental for modeling relationships between variables. It predicts an output value using a linear approximation of input features.

In its simplest form, it fits a line to two variables, minimizing the sum of squared differences between observed and predicted values.

Linear regression extends to multiple variables with multivariate linear regression, making it applicable for more complex problems.

Regularization techniques like Ridge and Lasso regression address overfitting by penalizing large coefficients. This ensures models do not become overly complex, striking a balance between bias and variance.

Despite its simplicity, linear regression provides a baseline for more advanced machine learning algorithms and remains a go-to technique in many applications.

Data Preprocessing and Transformation

Data preprocessing and transformation are essential steps in preparing datasets for machine learning. These steps include transforming raw data into structured and normalized forms for better model performance. The use of tools like NumPy arrays, sparse matrices, and various transformers can enhance the effectiveness of machine learning algorithms.

Handling Numeric and Categorical Data

When dealing with machine learning, handling numeric and categorical data properly is crucial. Numeric data often requires transformation into a suitable scale or range. Categorical data might need encoding techniques to be properly used in models.

One common approach to manage categorical data is using one-hot encoding or label encoding. These methods convert categories into a numerical form that machines can understand.

By using scikit-learn’s techniques, both numeric and categorical data can be efficiently preprocessed, enhancing the performance of downstream models. Proper handling helps in reducing bias and variance in predictions.

Scaling and Normalizing with StandardScaler

Scaling and normalizing data ensure that the model treats all features equally, which can lead to faster convergence. StandardScaler from scikit-learn standardizes features by removing the mean and scaling to unit variance.

Through this method, data becomes uniform and easier to work with.

This transformation is crucial in algorithms sensitive to the scale of data, such as Support Vector Machines and K-means clustering. The process of scaling can be applied using NumPy arrays, which hold numerical data efficiently.

Using the StandardScaler tool, consistency across datasets is maintained, and the risk of model bias is minimized.

Efficient Data Preprocessing with ColumnTransformer

For complex datasets that contain a mix of data types, ColumnTransformer provides an efficient way to preprocess them. This tool allows the application of different transformers to each column of the data.

This is particularly useful when some fields require scaling while others might need encoding.

ColumnTransformer can manage various transformations simultaneously, processing both dense matrices and sparse representations. By utilizing this tool, the preprocessing pipeline becomes streamlined, making it easier to handle multi-type datasets.

It provides flexibility in managing diverse data types, ensuring robust data preparation for machine learning tasks.

Effective Model Selection and Training

Choosing the right model and training it effectively are important steps in machine learning. In this section, the focus is on splitting datasets using train_test_split, using cross-validation for enhancing model reliability, and training models with the fit method.

Splitting Datasets with train_test_split

Dataset splitting is crucial for model evaluation. It provides an independent report on a model’s quality.

The train_test_split function in scikit-learn helps divide data into training and testing sets.

It is important to allocate a proper ratio, often 70-80% for training and 20-30% for testing, allowing the model to learn patterns from the training data while the results can be tested for accuracy on unseen data.

Key Parameters:

  • test_size or train_size: Specify proportions directly.
  • random_state: Ensures reproducibility by fixing the seed.
  • shuffle: Determines whether the data is shuffled before splitting.

These parameters allow customization of the train/test split, ensuring that the model is neither overfitting nor underfitting the data.

Utilizing Cross-Validation Techniques

Cross-validation is used for better assessment of a model’s performance. Instead of a single train/test split, cross-validation involves splitting the data multiple times to verify reliability.

Methods like K-Folds divide the dataset into K different subsets or folds.

During each iteration, the model is trained on K-1 folds and tested on the remaining fold. This process is repeated K times.

Cross-validation helps find optimal hyperparameters and improve model selection by verifying that the model’s performance is consistent and not random. This allows the practitioner to confidently compare and select the best model.

Learning Model Training and the fit Method

Training the model involves applying algorithms to datasets. In scikit-learn, this process is done using the fit method.

It adjusts the model parameters according to the training set data. Model training builds a mathematical representation that can predict outcomes from new data inputs.

Essential points about the fit method:

  • Requires training data features and target labels.
  • This step can be resource-intensive, depending on model complexity and dataset size.

Upon completion, the model should be able to generalize well to unseen data. Proper training can transform raw data into useful predictions, ensuring the model is ready for real-world application.

Understanding Estimators and Predictors

Estimators and predictors play a crucial role in machine learning models using Scikit-Learn. Estimators handle the fitting of models, while predictors are used to make predictions with trained models.

Estimator API in Scikit-Learn

Scikit-Learn provides a robust Estimator API that standardizes how different models fit data and predict outcomes. This API ensures that all estimators, whether they are support vector machines (SVM), decision trees, or linear models, follow a consistent interface.

To use an estimator, one usually calls the .fit() method with training data. This process adapts the model to identify patterns in the data.

Key features include flexibility to handle various types of data and ease of integration with other tools, such as pipelines.

From Estimation to Prediction

Once a model has been trained using an estimator, it transitions to making predictions. The .predict() method is central here, allowing the model to forecast based on new input data.

Predictors are vital for applying the insights drawn from data analysis to real-world scenarios.

For example, in classification tasks, such as identifying spam emails, the predictor analyzes features to classify new emails. Prediction accuracy is influenced heavily by the choice of estimator and the quality of the training.

Evaluating Estimators and Model Predictions

Model evaluation is crucial to understanding how well an estimator performs on unseen data.

Scikit-Learn offers various evaluation metrics to assess performance, like accuracy, precision, and recall. These metrics help in judging predictive power and are essential for refining models.

To ensure robust evaluation, techniques such as cross-validation are often used.

This involves splitting the dataset into parts and training the model several times, ensuring that model predictions are not only accurate but also reliable across different datasets.

Using Scikit-Learn’s tools, like GridSearchCV, developers can optimize model parameters systematically for better performance.

This systematic evaluation enhances the overall quality of predictions made by the model.

Evaluating Machine Learning Models

Evaluating machine learning models is crucial for understanding how well a model performs. This involves examining different metrics and tools to ensure accurate predictions and decision-making.

Metrics for Model Accuracy

Model evaluation begins with measuring how often predictions are correct.

The primary evaluation metric for this is the accuracy score, which calculates the percentage of correct predictions over the total number of cases.

Accuracy score is often used as a starting point, but it is important to consider additional metrics such as precision, recall, and F1-score. These provide a more granular understanding of model performance by revealing how many instances were correctly identified as positive or negative.

For example, Scikit-learn’s library offers tools to calculate these metrics, making it easier to compare different models or fine-tune parameters.

Confusion Matrix and ROC Curves

A confusion matrix is a table used to evaluate the performance of a classification model by showing the actual versus predicted values.

It presents true positives, false positives, true negatives, and false negatives. This helps identify not just the accuracy but also the kinds of errors a model makes.

The ROC curve (Receiver Operating Characteristic curve) illustrates the true positive rate against the false positive rate.

It is used to determine the optimal threshold for classification models, balancing sensitivity and specificity. Scikit-learn provides tools to plot ROC curves, offering insights into model discrimination between classes.

By analyzing these tools, users can better understand model performance in different scenarios.

Error Analysis and Model Improvement

Analyzing errors is key to improving model accuracy.

Errors can be categorized into two main types: bias and variance. Bias refers to errors due to overly simplistic models, while variance refers to errors because the model is too complex.

Errors can reveal inadequacies in data preprocessing or highlight areas where data might be misclassified.

Utilizing techniques such as cross-validation and hyperparameter tuning within Scikit-learn can help in refining model predictions.

By focusing on these errors, practitioners strive for a balance that minimizes both bias and variance, leading to better model performance.

Improving Model Performance through Tuning

Tuning a machine learning model can greatly enhance its performance. It involves adjusting hyper-parameters, employing various tuning strategies, and using optimization methods like gradient descent.

The Importance of Hyper-Parameters

Hyper-parameters play a vital role in defining the structure and performance of machine learning models. They are set before training and are not updated by the learning process.

These parameters can include the learning rate, the number of trees in a random forest, or the number of layers in a neural network.

Proper tuning of hyper-parameters can significantly boost a model’s accuracy and efficiency. For instance, in grid search, various combinations of parameters are tested to find the most effective one. Scikit-learn offers several tools to tune hyper-parameters effectively.

Strategies for Parameter Tuning

There are several strategies for parameter tuning that can help optimize model performance.

Grid search involves trying different combinations of hyper-parameters to find the best fit. Random search, on the other hand, selects random combinations and can be more efficient in some cases.

Bayesian optimization is another advanced technique that models the objective function to identify promising regions for parameter testing.

Scikit-learn provides convenient functions like GridSearchCV and RandomizedSearchCV, which automate some of these strategies and evaluate models on predefined metrics.

Gradient Descent and Optimization

Gradient descent is a fundamental optimization algorithm used in machine learning. It aims to minimize a cost function by iteratively moving towards the steepest descent, adjusting model weights accordingly.

There are different variants, such as Batch Gradient Descent, Stochastic Gradient Descent, and Mini-batch Gradient Descent, each with its own way of updating parameters.

This method is especially useful in training deep learning models and helps in refining hyper-parameters to achieve better performance. Understanding the nuances of gradient descent can enhance the effectiveness and speed of finding optimal parameters for a model.

Workflow Automation with Pipelines

Scikit-learn Pipelines provide a structured approach to manage and automate machine learning processes. They streamline tasks such as data preprocessing and model training, making it easier to create consistent and maintainable workflows.

Building Effective Pipelines

Building a pipeline involves organizing several processing steps into a sequential order. Each step can include tasks such as data transformations, feature selection, or model training.

By chaining these together, users ensure that the entire operation follows a consistent path from input data to final prediction.

Pipelines also reduce code complexity. By encapsulating processes within a single entity, they keep the code organized and easier to maintain. This approach minimizes chances of errors and ensures that data flows seamlessly through various stages.

Additionally, effective pipelines promote flexibility by allowing users to easily modify or update individual steps without disrupting the entire workflow.

Using pipelines can enhance cross-validation practices. By treating the whole workflow as a single object, the same transformations apply consistently across training and validation datasets. This guarantees that model evaluation is fair and accurate, enhancing the overall reliability of predictions.

Integrating Preprocessing and Model Training

Integrating data preprocessing and model training is a core function of pipelines. By combining these steps, pipelines automate the repetitive task of applying transformations before every model training process.

This saves time and reduces the risk of inconsistency between training and deployment processes.

Preprocessing steps might include scaling features, encoding categorical variables, or handling missing values. By embedding these within a pipeline, users ensure they are automatically applied whenever the model is trained or retrained.

Pipelines enhance reproducibility by maintaining a detailed record of all processing steps. This makes it easier to replicate results later or share workflows with other team members.

Implementing pipelines helps maintain clear documentation of data transformations and model settings, ensuring transparency throughout the machine learning project.

Practical Machine Learning with Real-World Datasets

Engaging with real-world datasets is essential for learning machine learning. It allows learners to apply techniques such as classification and regression on actual data.

Navigating Kaggle for Machine Learning Competitions

Kaggle is an excellent platform for tackling real-world data challenges. Competitions here provide datasets and pose problems that mirror real industry demands.

Participating in competitions can help improve skills in data cleaning, feature engineering, and model evaluation.

Using a Pandas DataFrame for data exploration is common. This process helps in understanding the structure and characteristics of the data.

Kaggle provides a collaborative environment where users can share kernels, which are notebooks containing code and insights, enhancing mutual learning.

Working with Iris, Diabetes, and Digits Datasets

The Iris dataset is a classic dataset for classification tasks. It includes measurements of iris flowers and is often used as a beginner’s project. The goal is to predict the class of the iris based on features like petal length and width.

The Diabetes dataset is used for regression tasks, aiming to predict disease progression based on several medical indicators. It helps in grasping how to handle numeric predictors and targets.

The Digits dataset contains images representing handwritten digits. It is widely used for image classification projects, applying algorithms like the Decision Tree or Support Vector Machine. By working with these datasets, learners develop an understanding of how to preprocess data and apply models effectively.

Visualizing Data and Machine Learning Models

Visualizing data and machine learning models is crucial in data science. It helps to understand model performance and make data-driven decisions.

Tools like Matplotlib and Seaborn are popular for creating these visualizations within Jupyter notebooks.

Data Visualization with Matplotlib and Seaborn

Matplotlib is a versatile library for creating various plots and graphs. It’s widely used for line charts, bar charts, and histograms. The library allows customization, helping users clearly display complex information.

Seaborn enhances Matplotlib’s functionality by providing a high-level interface for drawing attractive and informative statistical graphics. It excels in visualizing distribution and relationship between variables. Seaborn’s themes and color palettes make it easier to create visually appealing plots.

Using these tools, data scientists can generate insightful visualizations that aid in understanding trends, outliers, and patterns in data. Both libraries are well-integrated with Jupyter notebooks, making them convenient for interactive analysis.

Interpreting Models through Visualization

Machine learning models can be complex, making them difficult to interpret. Visualization can bridge this gap by offering insight into model behavior and decision-making processes.

For example, plotting learning curves helps evaluate model scalability and performance.

Visualizations like Scikit-learn’s API offer tools to visualize estimator predictions and decision boundaries. These tools help identify model strengths and weaknesses.

Furthermore, using tools like partial dependence plots and feature importance graphs can reveal how different features impact predictions. This transparency aids in building trust in models and provides a clearer understanding of their functioning.

How do I contribute to the scikit-learn GitHub repository?

Contributing involves making meaningful additions or improvements to the codebase.

Interested individuals can visit scikit-learn’s GitHub repository and follow the guidelines for contributors.

Participating in community discussions or submitting pull requests are common ways to get involved.