Understanding Polynomial Regression
Polynomial regression is a vital tool in machine learning for modeling complex, curved relationships.
By using polynomial equations, it extends simple linear regression to capture non-linear patterns in data.
Defining Polynomial Regression
Polynomial regression fits a curve to the data points rather than a straight line. This is achieved by using polynomials as the basis of the model.
A polynomial equation might look like this: (y = b_0 + b_1x + b_2x^2 + … + b_nx^n).
Here, (b_0, b_1, b_2, …, b_n) are coefficients, and (x^n) represents the predictor’s power.
The choice of polynomial degree (n) affects the model’s flexibility. Higher degrees can fit data more closely but may lead to overfitting, where the model captures noise rather than the underlying pattern.
By transforming the input features into polynomial features, polynomial regression can effectively capture more complex relationships that linear models cannot handle.
Comparing Linear and Polynomial Regression
Linear regression assumes a straight-line relationship between predictors and the target variable. This makes it simple and easy to interpret. However, it struggles with data that vary non-linearly.
Polynomial regression, on the other hand, uses polynomial terms to better fit curved data patterns.
While linear regression might appear insufficient for complex datasets, polynomial regression provides a feasible alternative by allowing different curve shapes through adjusting the polynomial degree.
Despite its advantages, polynomial regression requires careful handling. Determining the right degree and avoiding overfitting are essential for model effectiveness.
Feature Significance in Polynomial Regression
In polynomial regression, selecting and scaling features skillfully impacts the accuracy and efficiency of the machine learning model.
Identifying key features helps to establish a meaningful relationship between the independent variables and the target variable.
Importance of Features
Features form the backbone of any machine learning model. In polynomial regression, they dictate the interaction and complexity of relationships modeled.
Polynomial regression involves transforming original features into polynomial features. This can result in large feature values, and thus feature scaling—using tools like StandardScaler—becomes crucial.
Scaling ensures that each feature contributes equally to the model, preventing any single feature from dominating due to large variances.
Properly scaled features lead to a more balanced model, preventing errors related to overfitting or underfitting.
Selecting Relevant Features
Feature selection involves choosing the most potent features that have meaningful contributions to the prediction of the target variable.
Given the potential to create numerous polynomial terms, it’s essential to apply feature engineering to determine which features are most relevant.
Often, techniques like Regularization can help in simplifying the model by penalizing higher degrees or irrelevant features.
Also, cross-validation can be a helpful tool to gauge the model’s performance with different feature selections, refining the model to include only those features that significantly improve accuracy.
This focused selection aids in enhancing model interpretability and reducing computational costs.
Data Preparation Techniques
Preparing data effectively is essential for accurate polynomial regression. Key steps include cleaning the data to handle missing values and detecting outliers to prevent skewed results. These techniques ensure the data is ready for modeling and analysis.
Data Cleaning Essentials
Data cleaning is the first step in preparing data for analysis. In this stage, missing values are addressed, which can involve removing incomplete rows or imputing missing data using statistical methods. Attention to detail is critical to maintain data integrity.
Handling discrepancies in data types, formatting, and duplicates is also crucial. For instance, numerical fields should not contain text entries. Duplicates can skew results in regression models if not handled correctly.
Consistent formatting throughout the dataframe helps streamline the analysis. Consistent naming conventions and unit conversions play a role in ensuring data compatibility during feature scaling and other preprocessing steps.
Handling Outliers
Outliers are data points significantly different from others in a set. They can heavily influence polynomial regression models, leading to inaccurate predictions.
Detecting these outliers early requires methods like visual inspection using scatter plots or statistical techniques such as Z-scores or the IQR method.
Once identified, it is important to decide how to treat these outliers. Options include removing them, adjusting models to minimize their effects, or transforming data using robust techniques like the log transform.
By effectively handling outliers, the data maintains its quality and reliability, ensuring the polynomial regression model yields meaningful insights.
Feature Scaling and Normalization
Feature scaling is crucial in preprocessing data for machine learning, ensuring features have a similar scale to improve model performance. Normalization and standardization are two common techniques used to achieve this.
Understanding Feature Scaling
Feature scaling involves transforming the data to bring all features into a comparable range. This is especially important for algorithms that rely on distances between data points, like k-nearest neighbors.
By standardizing or normalizing data, biases due to differing scales are minimized, enhancing algorithm performance.
For preprocessing, techniques like StandardScaler adjust data so each feature is centered around zero with a standard deviation of one. It helps provide a consistent scale, which is vital for many machine learning models.
Normalization vs. Standardization
Normalization and standardization are different methods for scaling data.
Normalization typically rescales values to a range between 0 and 1, aiding in algorithms sensitive to the range of data.
Standardization, on the other hand, deals with data based on its distribution, often using the mean and standard deviation.
The choice between these methods depends on the model and data characteristics.
Some algorithms, such as decision trees, may not require scaling, but for those that do, choosing the right method is key. For more on this, the Scikit-Learn documentation on feature scaling offers detailed guidance.
Applying Polynomial Features
Polynomial features can transform simple models into powerful ones by adding degrees of input variables, which can capture complex patterns. The integration of these features can be done efficiently using tools like scikit-learn.
Generating Polynomial and Interaction Features
Generating polynomial features involves creating new features from existing ones by raising them to a power or multiplying them together. This process is key for capturing non-linear relationships in data.
The PolynomialFeatures class in scikit-learn provides a straightforward way to perform this transformation.
Users can specify the degree of the polynomial and choose whether to include interaction features, which are products of input features.
These transformations result in additional columns in the dataset, corresponding to the polynomial terms. Specifying the degree determines the number of terms. For instance, a degree of 2 with two variables creates terms like x1^2, x2^2, and x1*x2. Using interaction terms only will ignore standalone higher powers and focus on combinations.
Integrating Polynomial Features with sklearn
Once polynomial features are generated, they can be integrated into machine learning models using scikit-learn.
The PolynomialFeatures class can be used to seamlessly create these features before feeding data into models such as linear regression or more complex algorithms.
This integration provides a way to quickly adapt models to capture non-linear patterns.
Before using polynomial features, it is often essential to apply feature scaling to avoid issues such as multicollinearity and to enhance the learning process of models like Lasso regression.
The combination of scaled polynomial features and a tuned regression model may lead to better predictive performance.
Adjusting hyperparameters and experimenting with different degrees help refine the model’s accuracy and relevance to the dataset.
Building Polynomial Regression Models
When building polynomial regression models, both configuring the model and properly training and testing are crucial. These processes ensure that the model captures the complexities in the data accurately and performs well during predictions.
Model Configuration
Configuring a polynomial regression model begins with selecting the degree of the polynomial. This choice is crucial because a degree that’s too low might not capture the data’s complexity, while a degree that’s too high can lead to overfitting, where the model performs well on training data but poorly on new data.
Feature scaling is an important step to consider. Polynomials can be prone to numerical issues. Scaling helps to standardize data, effectively reducing error rates and improving model performance.
Algorithms may integrate techniques such as feature scaling to ensure stability in computations.
A learning algorithm fits these features using a linear model. Despite polynomials being nonlinear, they remain linear in parameters. This configuration ensures the computational efficiency needed for practical use.
Training and Testing Models
After configuration, training and testing are next. The data is split into training and testing sets using functions like train_test_split. This process ensures the model learns from one part of the data and is evaluated on another, unbiased part.
During training, the polynomial features are used to teach the model. It tries to minimize the difference between predicted and actual values. This training phase is essential for the model to learn the underlying patterns of the data.
Testing follows, using the reserved data not seen during training. This step measures how well the model generalizes to new, unseen data.
An R-squared score can indicate model performance, showing how much variance in the target variable the model can explain. For example, an R-squared score of 0.939 means the model explains 93.9% of the variance.
Interpreting Model Performance
Interpreting model performance involves assessing how well a machine learning model, such as polynomial regression, predicts outcomes. It requires evaluating the accuracy of the predictions and analyzing various performance metrics.
Assessing Model Accuracy
Accuracy measures how often the model correctly predicts class labels. In regression, though, accuracy is not as direct as classification tasks.
A common way to assess accuracy in regression models is using the R-squared metric, which indicates how much of the variation in the data is captured by the model. A higher R-squared value means better model fitting.
Another method of assessing model accuracy is through residual analysis. Residuals are the differences between observed and predicted values. Plotting these residuals can reveal patterns; ideally, they should be randomly scattered, indicating a good fit.
Cross-validation is another important technique. By splitting the data into training and validation sets, the model’s performance can be tested on unseen data. This helps ensure that the model generalizes well to new data, preventing overfitting.
Model Performance Metrics
Model performance in regression is often summarized using metrics like mean absolute error (MAE), mean squared error (MSE), and root mean squared error (RMSE). These metrics show the average magnitude of prediction errors.
MSE and RMSE are sensitive to outliers, while MAE gives a linear average of errors.
Another critical metric is the R-squared score, which represents the proportion of variance explained by the model.
Adjusted R-squared is useful when comparing models with different numbers of features, as it penalizes for additional predictors that do not improve the model significantly.
Metrics help identify how well the model fits the data and guides improvements in the algorithm or preprocessing steps like feature scaling. They provide insights into balancing complexity with predictive performance.
Algorithm Optimization Techniques
Algorithm optimization is crucial for improving the performance of machine learning models.
Two main strategies include using gradient descent for parameter tuning and managing convergence through learning rate adjustments.
Utilizing Gradient Descent
Gradient descent is a fundamental method used to optimize algorithms.
It involves adjusting parameters iteratively to minimize a cost function. By calculating the gradient of the cost function, the algorithm updates the parameters in the direction that reduces error. This process continues until the model’s predictions improve.
Different forms of gradient descent, such as batch, stochastic, and mini-batch, offer flexibility.
Batch gradient descent uses the entire dataset for each update, providing consistent directions but can be slow.
Stochastic gradient descent updates the model based on one data point at a time, making it faster but noisier.
Mini-batch gradient descent combines these approaches, balancing speed and accuracy.
Convergence and Learning Rate
Convergence refers to when an algorithm’s parameters settle into stable values. Achieving convergence is vital for a reliable model.
The learning rate, a key factor in convergence, determines how much adjustment occurs with each iteration. Too high a learning rate might cause the algorithm to overshoot, while too low a rate results in slow progress.
Choosing the right learning rate is critical.
Techniques like adaptive learning rates adjust the rate during training, enhancing convergence efficiency.
Learning rate schedules can also be used, where the rate decreases as training progresses, ensuring fine-tuning at the end.
Monitoring convergence through metrics and graphs helps ensure that the learning process is on track, providing insight into when to stop training.
Visualizing Polynomial Regression
Visualizing polynomial regression involves creating clear, informative plots that show how well the polynomial model fits the data.
By using tools like Matplotlib, users can illustrate these relationships, emphasizing key polynomial terms and the overall curve shape.
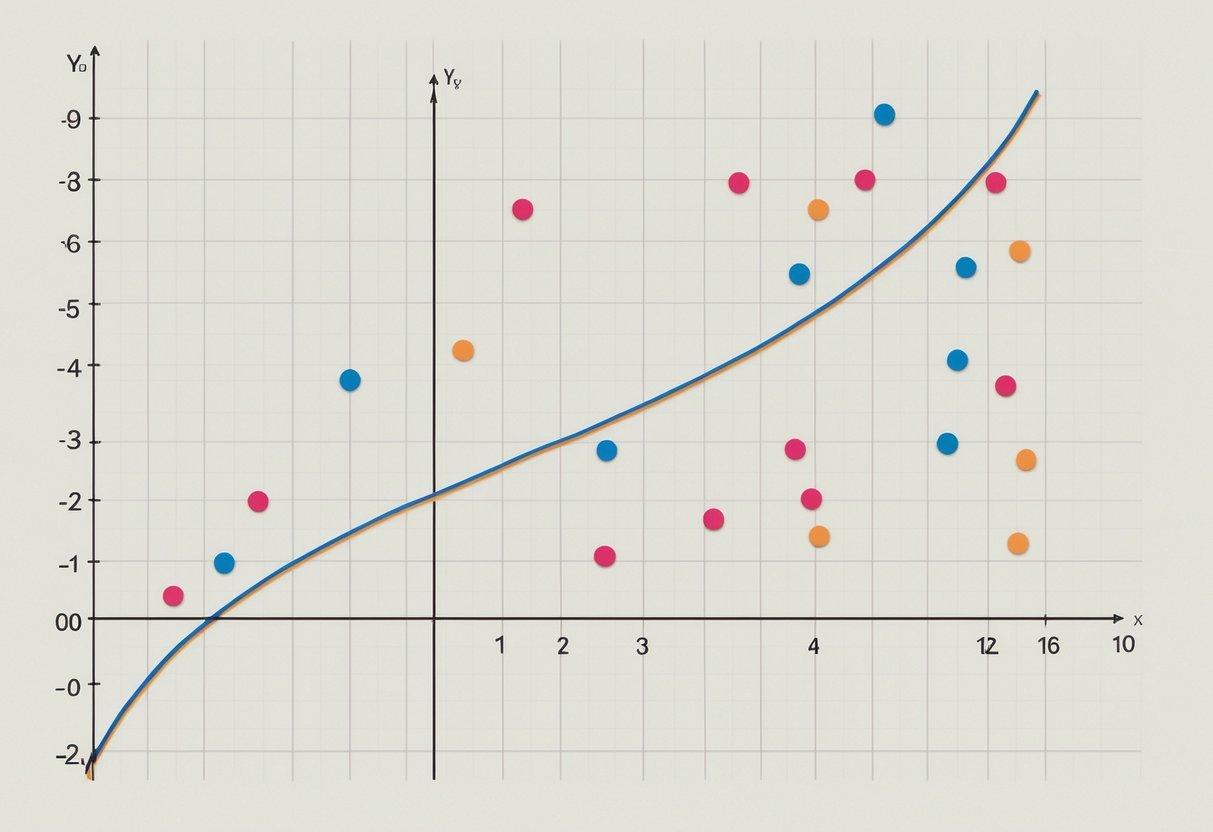
Plotting Polynomial Regression Curves
When plotting polynomial regression curves, the primary goal is to show the fit between the model and actual data points.
The curve is formed based on polynomial terms that are calculated to best match the data. A common approach is to use numpy.polyfit to calculate the coefficients of these polynomial terms. This function can help find the best-fitting line by minimizing the error between the predicted and actual values.
A proper plot will have both data points and the fitted curve.
Data points should be marked clearly, often as circles or dots, while the fitted curve typically appears as a smooth line. It is essential to choose the degree of the polynomial carefully, as a higher degree results in a curve that can potentially overfit.
Using Matplotlib for Visualization
Matplotlib is a popular library in Python used for creating static, interactive, and animated visualizations.
For visualizing polynomial regression, it’s essential to use this tool’s functions effectively.
One begins by plotting the raw data using plt.scatter() from Matplotlib to show individual data points.
Next, the fitted polynomial curve is plotted using plt.plot(). This involves generating predicted values from the polynomial model, usually prepared by evaluating polynomial terms generated by polyfit.
The visual clarity of these plots can be enhanced through labels, legends, and grid lines. This not only helps in understanding but also makes the visualization more informative and easier to interpret.
Leveraging Advanced Techniques
Polynomial regression can be effectively enhanced by incorporating advanced techniques such as Principal Component Analysis (PCA) and K-Nearest Neighbors (KNN).
These approaches help improve model performance by reducing complexity and optimally scaling features.
Principal Component Analysis for Dimensionality Reduction
Principal Component Analysis (PCA) is a technique used to simplify complex datasets. It reduces the number of input variables by transforming them into a new set, called principal components.
This is particularly useful in polynomial regression, where the feature set can become large due to polynomial terms.
By focusing on the most significant components, PCA helps manage multicollinearity. This leads to efficient model training and helps avoid overfitting.
For example, while using TensorFlow for polynomial regression, PCA can identify the main factors that describe the data variability, thus streamlining the training process and improving accuracy.
Utilizing PCA results in a more compact and interpretable model as it retains essential information with fewer variables. It is a practical solution when working with large datasets or high-degree polynomials.
K-Nearest Neighbors for Feature Scaling
K-Nearest Neighbors (KNN) is another useful technique applied in feature scaling. It involves using the distance between points to classify data or predict values.
In the context of polynomial regression, ensuring that features are on a similar scale can significantly affect model performance.
The KNeighborsClassifier from scikit-learn provides a way to implement KNN for scaling purposes. This method adjusts the feature scale by considering the distance from a point to its neighbors, which brings uniformity to the dataset.
Using KNN for feature scaling is particularly influential when dealing with datasets where features differ in units or magnitude. As a result, KNN not only aids in feature scaling but also enhances the predictive accuracy of polynomial regression models by ensuring no feature dominates due to scale differences.
Toolkits for Polynomial Regression
Polynomial regression can be enhanced through different toolkits designed to simplify the process and improve accuracy.
Two popular choices include Scikit-learn and the combination of Numpy and Pandas. Each offers unique benefits and functionalities.
Scikit-learn’s Role in Polynomial Regression
Scikit-learn is a powerful library for implementing polynomial regression. It provides the PolynomialFeatures module, which transforms input data by adding polynomial terms up to the specified degree. This allows the creation of more complex models without manually computing polynomials.
In practice, Scikit-learn’s LinearRegression can be paired with PolynomialFeatures to perform polynomial regression efficiently. By using these tools together, users can handle high-dimensional data and apply techniques like feature scaling to enhance model performance.
Another advantage is the integration of Scikit-learn’s evaluation metrics, such as r2_score, which helps in assessing model accuracy. Scikit-learn’s comprehensive documentation and community support make it a reliable choice for both beginners and experienced practitioners.
Utilizing Numpy and Pandas
Numpy and Pandas are essential libraries for data analysis and manipulation, often used together to prepare data for polynomial regression.
Numpy offers the polyfit function, which fits polynomial equations to data points. This function is useful for quick calculations and analysis.
Pandas complements Numpy by providing capabilities to handle large datasets and perform data cleaning and transformation. Users can easily manipulate data frames to prepare inputs for regression models. Pandas’ intuitive syntax and extensive functionalities make data preprocessing manageable.
Combining Numpy and Pandas ensures a seamless workflow for polynomial regression, enhancing efficiency in data preparation and model fitting. While they do not offer built-in polynomial regression functions like Scikit-learn, their flexibility and efficiency make them invaluable tools for data scientists.
Integrating Polynomial Regression into Pipelines
Incorporating polynomial regression into machine learning pipelines streamlines data preparation and model training. This involves transforming data, scaling features, and efficiently fitting it into various regression models like linear regression and logistic regression.
Creating and Customizing Pipelines
To integrate polynomial regression into a pipeline, tools like scikit-learn’s Pipeline can be used. It allows for sequential steps such as scaling, transformation, and model fitting.
The process starts by adding PolynomialFeatures to transform input data into polynomial terms. This includes terms like $x$, $x^2$, and $x^3$, expanding the feature set.
Next, StandardScaler is often applied to ensure data scales properly, which enhances model performance.
Finally, a regression model, such as LinearRegression, can be used to fit the transformed data. This combination ensures that data preprocessing and model training are seamlessly integrated.
Pipeline Efficiency and Maintenance
Efficient pipelines not only train models but also streamline workflows. By using scikit-learn’s Pipeline, users reduce code complexity and improve maintenance.
This setup allows users to replace or alter steps without disrupting the entire process. For example, switching from LinearRegression to LogisticRegression can be done effortlessly.
Moreover, using pipelines allows for easy experimentation with different model parameters and configurations. They also help in replicating experiments by maintaining consistency in data transformations and model training steps. This consistency ensures robust model performance across varied datasets and enhances overall efficiency.
Integrating polynomial regression in this way improves both the accuracy and reliability of machine learning tasks.
Frequently Asked Questions
Polynomial regression involves feature scaling, polynomial features, and comparing it to linear models. This section addresses common questions on these topics and offers practical tips for implementation.
How does feature scaling impact the performance of polynomial regression models?
Feature scaling can significantly affect the performance of polynomial regression models.
Scaling ensures that all features contribute equally, which can speed up optimization algorithms and improve model convergence. Feature scaling helps in handling features with a wide range of values more effectively.
What are the best practices for implementing feature scaling in polynomial regression analysis?
When implementing feature scaling in polynomial regression, it’s recommended to scale the data before generating polynomial features.
This practice helps in avoiding numerical instability and ensures that the polynomial terms do not exaggerate the differences in magnitude among features, leading to improved model performance.
Can you explain the relationship between polynomial features and the linearity in polynomial regression?
Polynomial regression is a type of linear regression that models the relationship between the independent variable and the dependent variable as an nth degree polynomial.
The model remains linear in terms of the coefficients, even though it involves polynomial terms, like (x^2) or (xy).
In what scenarios is it appropriate to use polynomial features in machine learning?
Polynomial features are useful when there is a non-linear relationship between predictors and the response variable.
They allow for more complex models that can capture these non-linear patterns, making them suitable for datasets where linear models may not perform well.
What advantages does polynomial regression offer over linear models?
Polynomial regression can model more complex relationships between variables than linear regression.
It provides better fitting when dealing with curved data patterns. By introducing polynomial terms, it can capture the intricacies of non-linear trends more effectively than a standard linear model.
How do feature selection techniques differ for polynomial regression compared to other types of regression analysis?
In polynomial regression, feature selection must account for interaction terms and higher-degree polynomial terms, which can lead to a large number of features.
Techniques like regularization, such as Lasso regression, can help in managing complexity by penalizing less informative features, ensuring the model remains interpretable and efficient.