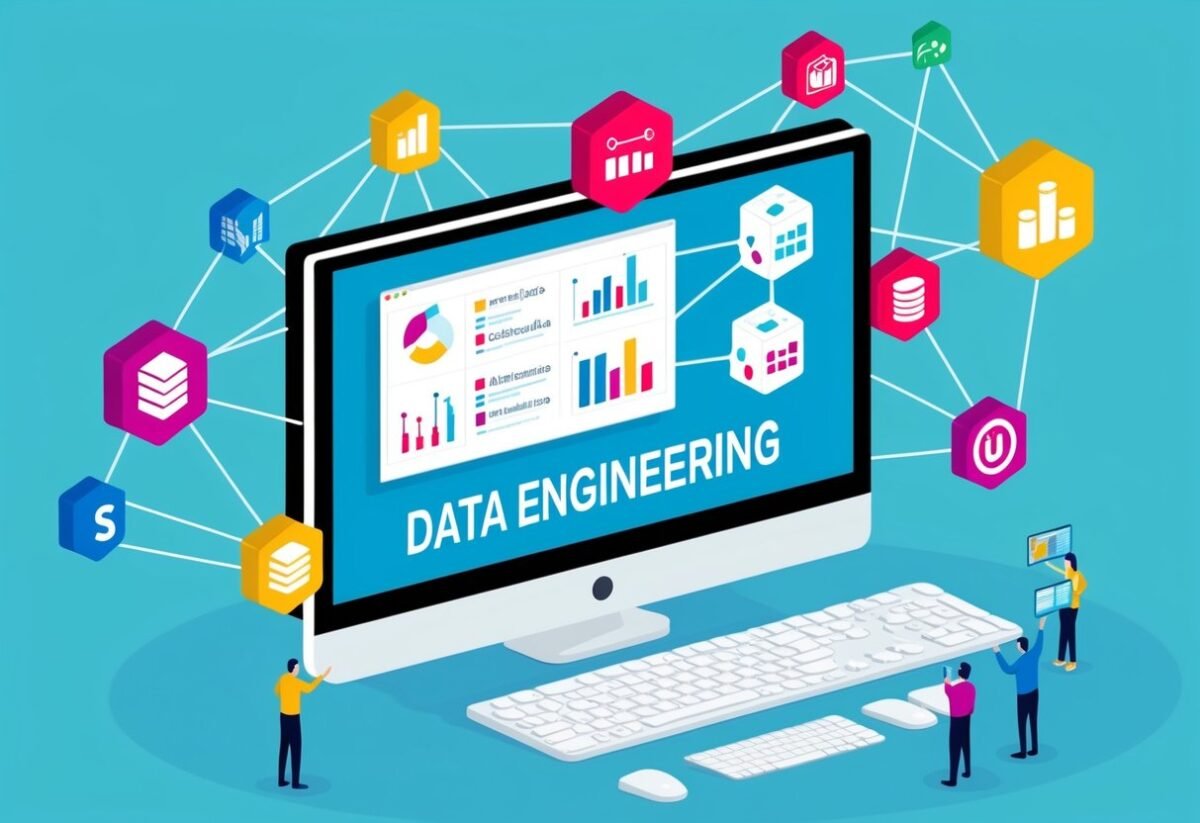
Demystifying the Data Trinity: Analysis, Engineering, and Science
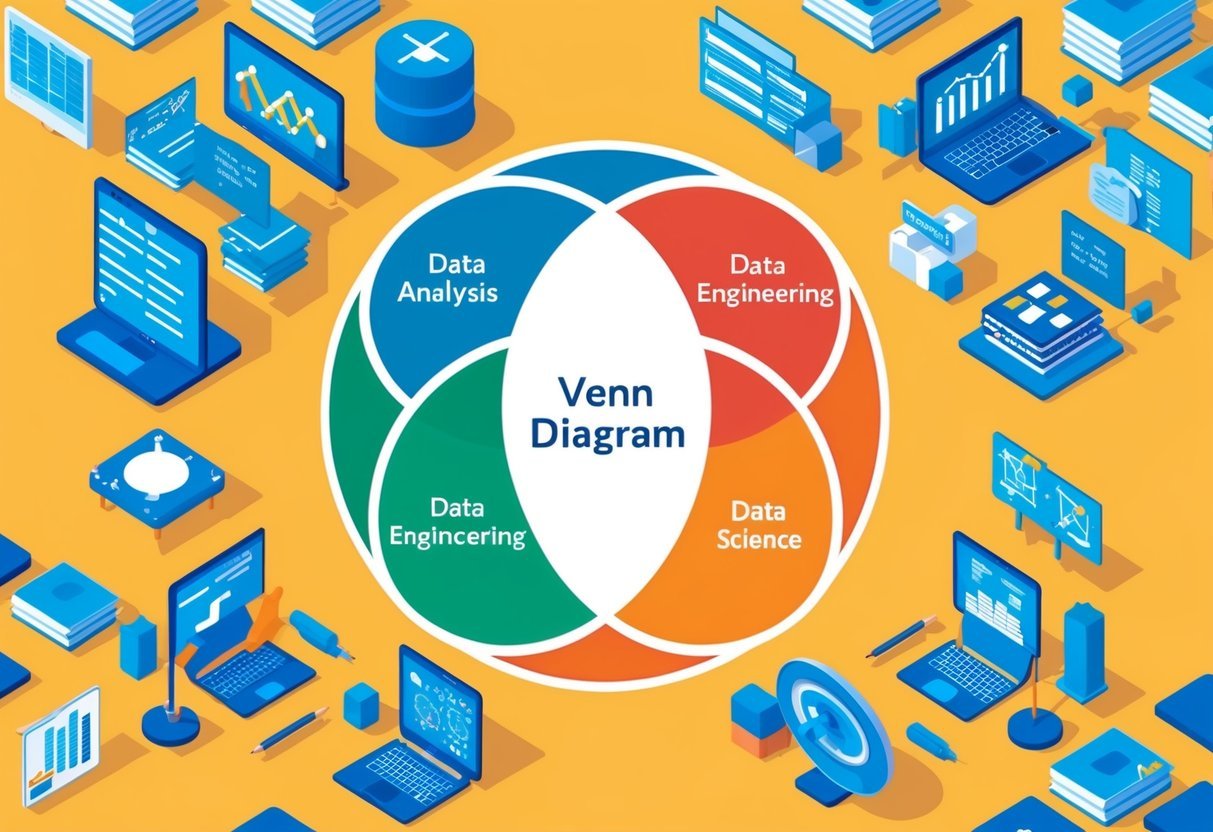
The fields of data analysis, data engineering, and data science share several skills and responsibilities that often overlap. Understanding these can help in choosing the right career path or improving collaboration between roles.
Core Competencies in Data Professions
Data Analysts focus on cleaning and interpreting data to identify trends. They often use tools like SQL, Excel, and various data visualization software.
Their goal is to present insights clearly to help businesses make informed decisions.
Data Engineers design systems to manage, store, and retrieve data efficiently. They require knowledge of database architecture and programming.
Skills in data warehousing and ETL (Extract, Transform, Load) pipelines are critical for handling large datasets.
Data Scientists work on creating predictive models using algorithms and statistical techniques. They often utilize machine learning to uncover deeper insights from data.
Proficiency in languages like Python and R is essential to manipulate data and build models.
Convergence of Roles and Responsibilities
While each role has distinct functions, there are key areas where these professions intersect. Communication is crucial, as results from data analysis need to be shared with engineers to improve data systems.
The findings by data analysts can also inform the creation of models by data scientists.
In some teams, data scientists might perform data-cleaning tasks typical of a data analyst. Similarly, data engineers might develop algorithms that aid data scientists.
In many organizations, collaboration is encouraged to ensure all roles contribute to the data lifecycle effectively.
Understanding these shared and unique responsibilities helps strengthen the overall data strategy within a company. By recognizing these overlaps, professionals in these fields can work more effectively and support each other’s roles.
Fundamentals of Data Manipulation and Management
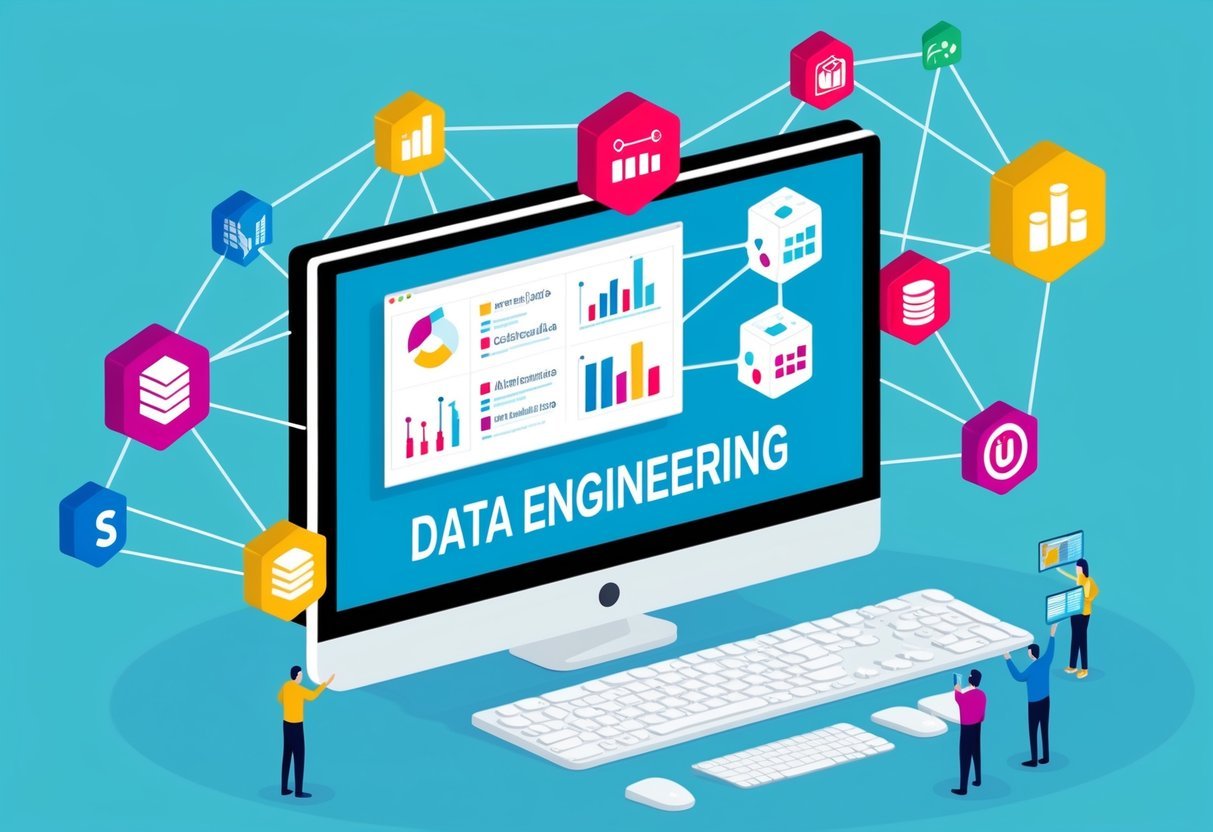
Data manipulation and management involve transforming raw data into a format that is easy to analyze. This process includes collecting, cleaning, and processing data using tools like Python and SQL to ensure high data quality.
Data Collection and Cleaning
Data collection is the initial step, crucial for any analysis. It involves gathering data from various sources such as databases, web scraping, or surveys.
Ensuring high data quality is essential at this stage.
Data cleaning comes next and involves identifying and correcting errors. This process addresses missing values, duplicates, and inconsistencies.
Tools like Python and R are often used, with libraries such as Pandas offering functions to handle these tasks efficiently.
Organizing data in a structured format helps streamline further analysis. Eliminating errors at this stage boosts the reliability of subsequent data processing and analysis.
Data Processing Techniques
Data processing involves transforming collected data into a usable format. It requires specific techniques to manipulate large datasets efficiently.
SQL and NoSQL databases are popular choices for managing structured and unstructured data, respectively.
Python is favored for its versatility, with libraries like Pandas facilitating advanced data processing tasks.
These tasks include filtering, sorting, and aggregating data, which help in revealing meaningful patterns and insights.
Data processing ensures that data is in a suitable state for modeling and analysis, making it a critical step for any data-driven project. Proper techniques ensure that the data remains accurate, complete, and organized.
Programming Languages and Tools of the Trade
Data professionals use a variety of programming languages and tools to handle data analysis, engineering, and science tasks. Python and R are the go-to languages for many, coupled with SQL and NoSQL for data management. Essential tools like Jupyter Notebooks and Tableau streamline complex workflows.
The Predominance of Python and R
Python and R are popular in data science for their versatility and ease of use. Python is widely used due to its readable syntax and robust libraries, such as NumPy and Pandas for data manipulation, and libraries like TensorFlow for machine learning.
R, on the other hand, excels in statistical analysis and offers powerful packages like ggplot2 for data visualization.
Both languages support extensive community resources that enhance problem-solving and development.
Leveraging SQL and NoSQL Platforms
SQL is the backbone of managing and extracting data from relational databases. It enables complex queries and efficient data manipulation, essential for structured datasets.
Commands like SELECT and JOIN are fundamental in retrieving meaningful insights from datasets.
NoSQL platforms, such as MongoDB, offer flexibility in managing unstructured data with schema-less models. They are useful for real-time data applications and can handle large volumes of distributed data, making them critical for certain data workflows.
Essential Tools for Data Workflows
Various tools facilitate data workflows and improve productivity. Jupyter Notebooks provide an interactive environment for writing code and visualizing results, making them popular among data scientists for exploratory data analysis.
Visualization tools such as Tableau and Power BI allow users to create interactive and shareable dashboards, which are invaluable in communicating data-driven insights.
Software like Excel remains a staple for handling smaller data tasks and quick calculations due to its accessibility and simplicity.
Using these tools, data professionals can seamlessly blend technical procedures with visual storytelling, leading to more informed decision-making. Together, these languages and tools form the foundation of effective data strategies across industries.
Statistical and Mathematical Foundations
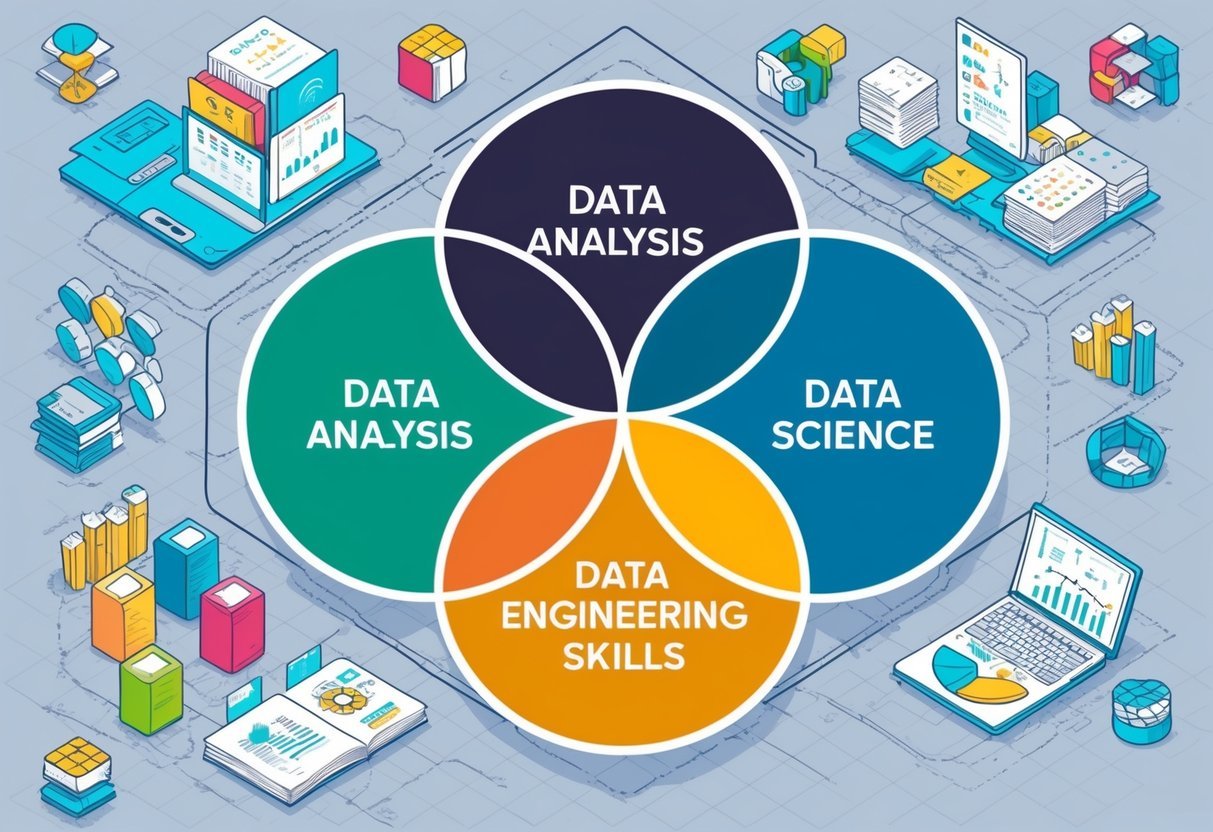
Statistics and mathematics play a crucial role in data analysis and data science. From building predictive models to conducting statistical analysis, these disciplines provide the tools needed to transform raw data into meaningful insights.
Importance of Statistics in Data Analysis
Statistics is pivotal for analyzing and understanding data. It allows analysts to summarize large datasets, identify trends, and make informed decisions.
Statistical analysis involves techniques like descriptive statistics, which describe basic features of data, and inferential statistics, which help in making predictions.
By leveraging statistics, data professionals can create predictive models that forecast future trends based on current data.
These models use probability theory to estimate the likelihood of various outcomes. Understanding statistical modeling enables analysts to identify relationships and trends, which is critical in fields like finance, healthcare, and technology.
Mathematical Concepts Underpinning Data Work
Mathematics provides a foundation for many data-related processes. Concepts such as linear algebra, calculus, and probability are essential in data science.
Linear algebra is used for working with data structures like matrices, which help in organizing and manipulating datasets efficiently. Calculus aids in optimizing algorithms and understanding changes in variables.
Incorporating mathematical concepts enhances the ability to build complex models and perform detailed data analysis.
For example, probabilistic methods help in dealing with uncertainty and variability in data. By grasping these mathematical foundations, professionals can develop robust models and perform sophisticated analyses, which are essential for extracting actionable insights from data.
Creating and Maintaining Robust Data Infrastructures

Building strong data infrastructures is key for supporting data-driven decision-making. It involves designing systems that can scale and efficiently handle data. Managing data pipelines and warehousing ensures data moves reliably across platforms.
Designing Scalable Data Architecture
Designing scalable data architecture is crucial for handling large volumes of information. It often includes technologies like Hadoop and Spark, which can process big data efficiently.
These systems are designed to grow with demand, ensuring that as more data flows in, the architecture can handle it seamlessly.
Cloud platforms such as AWS, Azure, and GCP provide on-demand resources that are both flexible and cost-effective.
Using data lakes and smaller distributed systems can further improve scalability by organizing data without the limitations of traditional data warehouses. Implementing Apache Spark for distributed data processing ensures quick analysis and insights.
Managing Data Pipelines and Warehousing
Data pipelines are automated processes that move data from one system to another while performing transformations. Tools like Apache Airflow are popular for orchestrating complex workflows.
These pipelines need to be reliable to ensure that data arrives correctly formatted at its destination.
ETL (Extract, Transform, Load) processes are vital for data warehousing, as they prepare data for analysis. Data warehousing systems store and manage large datasets, providing a central location for analysis.
Technologies such as AWS Redshift or Google BigQuery enable quick querying of stored data. Maintaining a robust pipeline architecture helps companies keep data consistent and accessible for real-time analytics.
Advanced Analytical Techniques and Algorithms

Advanced analytical techniques integrate predictive modeling and machine learning to enhance data analysis. These approaches leverage tools like scikit-learn and TensorFlow for developing robust models and algorithms. Utilizing these methods empowers professionals to manage big data and implement effective data mining strategies.
Developing Predictive Models and Algorithms
Predictive modeling involves creating a mathematical framework that forecasts outcomes using existing data. It requires the selection of appropriate algorithms, which can range from simple linear regression to complex neural networks.
These models analyze historical data to predict future events, aiding decision-makers in strategic planning.
Tools like scikit-learn simplify the process by providing a library of algorithms suitable for various data structures. Data scientists often select models based on factors like accuracy, speed, and scalability.
Big data processing helps improve model accuracy by providing a wider range of information. An effective approach combines model training with real-world testing, ensuring reliability and practicality.
Machine Learning and Its Applications
Machine learning (ML) utilizes algorithms to enable systems to learn and improve from experience. Its primary focus is to develop self-learning models that enhance decision-making without explicit programming.
Artificial intelligence drives innovation in machine learning by simulating human-like learning processes.
Applications of ML include classification, clustering, and regression tasks in areas like finance, healthcare, and marketing.
Technologies like TensorFlow facilitate the creation of complex neural networks, enabling high-level computations and simulations. Data engineers harness ML to automate data processing, improving efficiency in handling vast datasets.
Proper algorithm selection is key, with specialists often tailoring algorithms to suit specific requirements or constraints.
Insightful Data Visualization and Reporting
Data visualization is essential for turning raw data into meaningful insights. Effective reporting can shape business decisions, creating a clear narrative from complex data sets. With the right tools and techniques, anyone can develop a strong understanding of data trends and patterns.
Crafting Data Stories with Visuals
Visual storytelling in data isn’t just about making charts; it’s about framing data in a way that appeals to the audience’s logic and emotions. By using elements like color, scale, and patterns, visuals can highlight trends and outliers.
Tools like Tableau and Power BI allow users to create interactive dashboards that present data narratives effectively. This approach helps the audience quickly grasp insights without slogging through spreadsheets and numbers.
Incorporating visuals into reports enhances comprehension and retention. Presenting data through graphs, heat maps, or infographics can simplify complex datasets.
These visuals guide the reader to understand the story the data is telling, whether it’s tracking sales growth or understanding user engagement patterns. A well-crafted visual can transform dry statistics into a compelling narrative that drives business strategy.
Tools for Communicating Data Insights
Choosing the right tool for data visualization is crucial. Popular options include Tableau, which offers robust features for creating interactive dashboards, and Power BI, known for its compatibility with Microsoft products.
Both allow users to turn data into dynamic stories. They support a range of data sources, making them versatile options for diverse business intelligence needs.
For those familiar with coding, Jupyter Notebook is an excellent choice. It integrates data analysis, visualization, and documentation in one place. The flexibility in such tools allows users to compile and present data insights in a cohesive manner.
Selecting the most fitting tool depends on the specific needs, complexity of data, and the user’s expertise in handling these platforms.
Data Quality and Governance for Informed Decisions
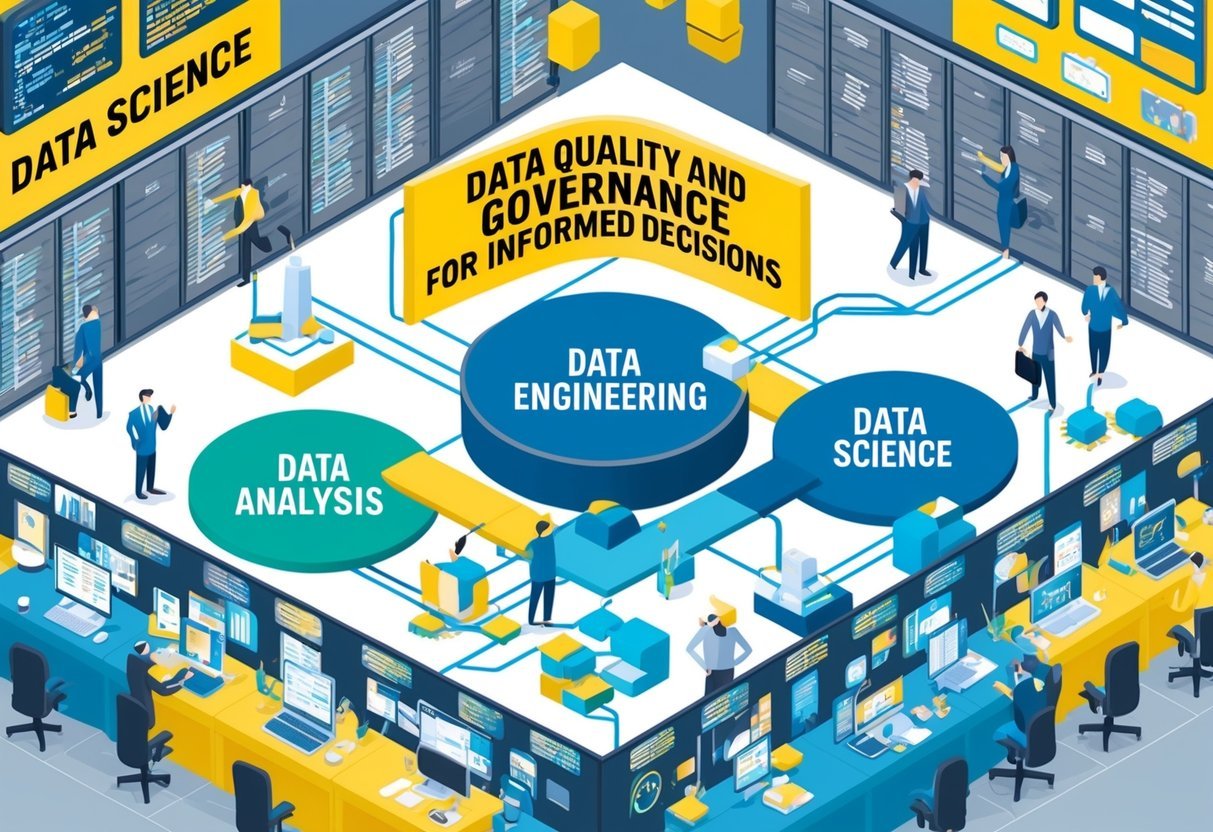
Data quality and governance are essential for organizations aiming to make accurate data-driven decisions. High-quality data and effective governance practices ensure that business decisions are backed by reliable and actionable insights.
Ensuring High-Quality Data Output
High-quality data is accurate, complete, and reliable. These characteristics are vital in making data-driven decisions.
Poor data quality can lead to incorrect or incomplete insights, which negatively impacts business strategies.
Organizations must focus on maintaining data quality to ensure that the insights derived from it are trustworthy. This involves regular checks and validation processes.
Using advanced tools and methodologies, like data cleaning and transformation, organizations can improve data quality. This enhances their ability to extract actionable insights from datasets.
Accurate data collection, entry, and storage practices are equally important.
Data Governance and Ethical Considerations
Data governance is a framework that ensures data is used appropriately and ethically. It involves setting policies and practices that guide the responsible use of data.
Effective governance establishes clear roles and responsibilities for data management.
Organizations must focus on data security, privacy, and compliance with laws to maintain trust with stakeholders. Ethical considerations in data usage also include ensuring transparency and fairness in data handling.
Implementing a robust data governance strategy supports informed business decisions and strengthens data-driven processes. Moreover, maintaining high data governance standards helps organizations avoid legal and ethical pitfalls.
To learn more about how data governance can improve data quality, visit the Data Governance Improves Data Quality page.
Building and Leading Effective Data Teams

Establishing effective data teams requires a balance of technical skills and collaboration.
Focus on encouraging domain expertise and clear communication among various roles to ensure successful teamwork.
Cultivating Domain Expertise Among Teams
Domain expertise is essential in data teams, as it deepens the team’s ability to interpret data insights accurately. Team members must develop an understanding of industry-specific concepts and challenges.
This knowledge allows data scientists and analysts to tailor their approaches to solve real-world problems better.
Training programs and workshops can be beneficial in fostering domain-specific skills. Encouraging team members to engage with industry publications and attend relevant conferences further enhances their knowledge.
These activities should be complemented by mentoring sessions, where experienced team members share insights with newer ones, fostering a culture of continuous learning and expertise growth.
Roles and Collaboration within Data Organizations
A successful data organization is one where roles are clearly defined but flexible enough to promote collaboration.
Key roles include data engineers, who manage data infrastructure, and data analysts, who interpret data using visualization tools. Data scientists often focus on creating predictive models.
Effective collaboration is fostered by encouraging open communication and regular cross-functional meetings. Tools like collaborative platforms and dashboards help keep workflow and progress transparent, allowing team members to identify and address potential issues.
Emphasizing teamwork over individual effort and recognizing collaborative achievements can significantly enhance the team’s cohesion and productivity.
Navigating Career Paths in Data Professions

Entering the realm of data professions requires a clear understanding of the right educational background and a keen insight into market trends. These insights help shape successful careers in data-related fields, from data analysis to data science.
Evaluating Data-Related Educational Backgrounds
Choosing the correct educational path is crucial for anyone aspiring to enter data professions. A bachelor’s degree in fields such as computer science, statistics, or mathematics can provide a strong foundation.
However, degrees aren’t the only path. Bootcamps and short courses offer focused training in practical skills relevant to data roles.
For those focusing on data analysis or engineering, knowledge in programming languages like Python and SQL is invaluable. Meanwhile, data scientists might benefit more from proficiency in machine learning frameworks.
Each career path has specific skills and qualifications, which aspiring professionals must consider to enhance their career opportunities.
Understanding the Market and Salary Trends
The demand for data professionals continues to grow, influencing market trends and salary expectations.
Professionals equipped with the right skills find themselves in a favorable career outlook.
Salaries can vary significantly based on role and experience level. For instance, entry-level data analysts might see different compensation compared to data scientists or engineers.
Reviewing resources like the Data Science Roadmap helps in estimating potential earnings.
Furthermore, regions play a role in salary variations. Typically, urban centers offer higher compensation, reflecting the demand and cost of living in these areas. Understanding these trends assists individuals in making informed career decisions.
Evolution and Future Trends in Data Ecosystems
Data ecosystems are rapidly evolving with advanced technologies and strategies. The focus is shifting towards more integrated and efficient systems that leverage emerging technologies in big data platforms and data-driven AI strategies.
Emerging Technologies in Big Data Platforms
Big data platforms are transforming with new technologies to handle increasingly complex data. Systems like Hadoop and Storm are being updated for better performance.
Advanced analytics tools play a crucial role in extracting valuable insights and enabling more accurate predictive analytics.
This involves processing vast amounts of information efficiently and requires innovative solutions in storage and retrieval.
As part of this evolution, the need for improved software engineering practices is evident. Developers are focusing on real-time data processing, scalability, and flexibility to support diverse applications across industries.
The Move Towards Data-Driven AI Strategies
AI strategies increasingly depend on data ecosystems that can effectively support machine learning models and decision-making processes.
A shift towards data-driven approaches enables organizations to realize more precise predictions and automated solutions.
This trend emphasizes the integration of robust data management practices and innovative big data platforms.
By linking AI with vast datasets, businesses aim to gain a competitive edge through insightful, actionable intelligence.
Investments in AI-driven platforms highlight the importance of scalable data architectures that facilitate continuous learning and adaptation. Companies are enhancing their capabilities to support advanced use cases, focusing on infrastructure that can grow with evolving AI needs.
Frequently Asked Questions
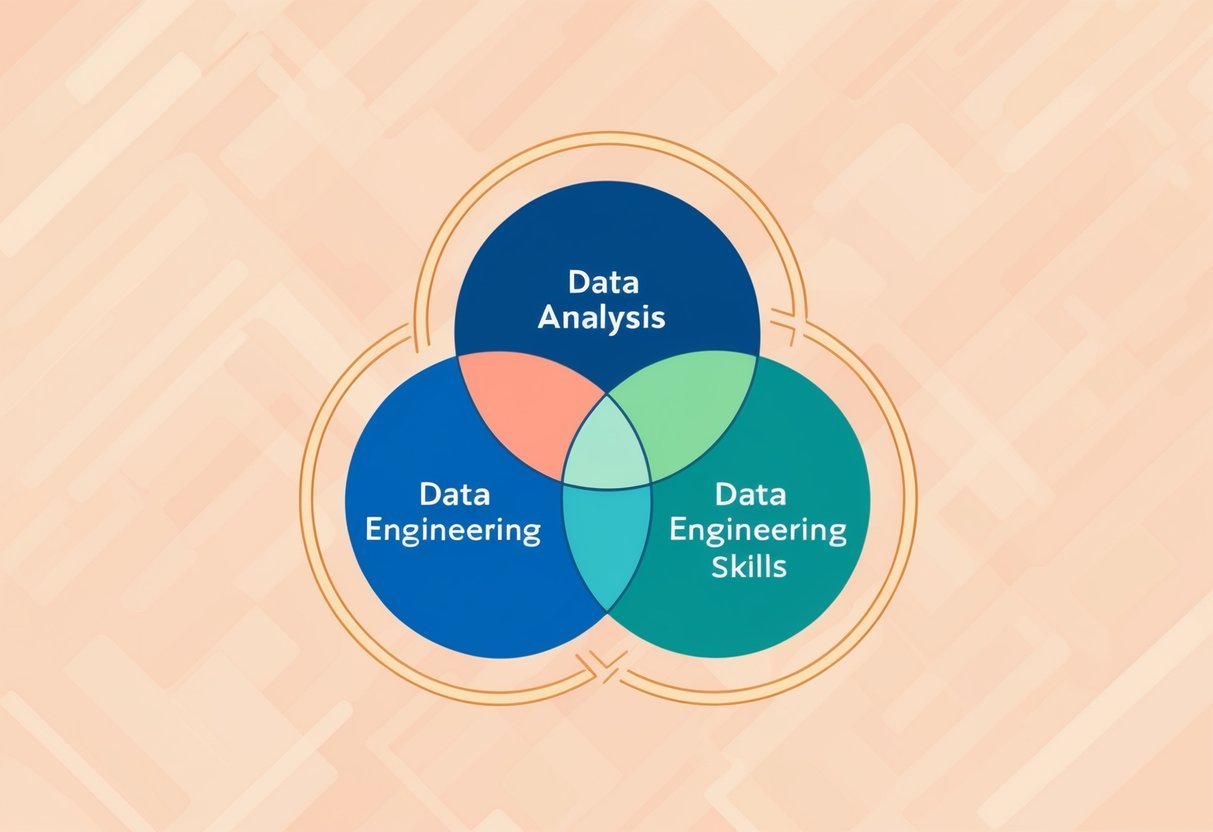
When exploring careers in data-related fields, it is important to understand the distinct roles and required skills. Data analysis, data engineering, and data science each have specific demands and responsibilities. Knowing these differences can guide career choices and skill development.
What distinct technical skill sets are required for a career in data analysis compared to data science?
Data analysts often focus on statistical analysis and data visualization. They need proficiency in tools like Excel and Tableau.
Data scientists, in contrast, typically need a deeper understanding of programming, machine learning, and algorithm development. Python and R are common programming languages for data scientists, as these languages support sophisticated data manipulation and modeling.
How does the role of a data engineer differ from a data analyst in terms of daily responsibilities?
Data engineers design, build, and maintain databases. They ensure that data pipelines are efficient and that data is available for analysis.
Their day-to-day tasks include working with big data tools and programming. Data analysts, on the other hand, spend more time exploring data and identifying patterns to inform business decisions.
What are the fundamental programming languages and tools that both data scientists and data analysts must be proficient in?
Both data scientists and data analysts commonly use programming languages like Python and R. These languages help with data manipulation and analysis.
Tools such as SQL are also essential for handling databases. Familiarity with data visualization tools like Tableau is critical for both roles to present data visually.
Which methodologies in data management are essential for data engineers?
Data engineers must be knowledgeable about data warehousing, ETL (Extract, Transform, Load) processes, and data architecture.
Understanding how to manage and organize data efficiently helps in building robust and scalable data systems. This knowledge ensures that data is clean, reliable, and ready for analysis by other data professionals.
