Categories
Uncategorized

Learning About Linear Regression and How to Implement in Python: A Comprehensive Guide

Understanding Linear Regression

Linear regression is a foundational statistical method used to explore the relationship between variables. It is a widely used technique in data science for predictive analysis, modeling, and understanding data patterns.

Defining Linear Regression

Linear regression is a method used to examine the linear relationship between dependent and independent variables. It involves fitting a straight line, often called a regression line, through the data points in a scatter plot.

The goal is to determine how changes in one or more predictors can affect the response variable. This technique predicts outcomes by minimizing the differences between observed and predicted values.

In mathematical terms, the relationship is expressed as:

[ y = mx + c ]

where y is the dependent variable, x is the independent variable, m is the slope of the line, and c is the intercept.

Simple vs Multiple Linear Regression

Simple linear regression focuses on analyzing the relationship between two variables: one independent and one dependent. The goal is to find the straight line that best fits the data, allowing one to predict future values of the dependent variable based on the independent variable.

Multiple linear regression extends this concept by involving two or more independent variables in the analysis. This allows for a more comprehensive model that can account for various factors influencing the dependent variable.

It uses a linear equation like:

[ y = b_0 + b_1x_1 + b_2x_2 + … + b_nx_n ]

Here, (y) is the dependent variable, (x_1, x_2,…,x_n) are independent variables, and (b_0, b_1, b_2,…,b_n) are the coefficients.

Applications of Linear Regression in Data Science

Linear regression is crucial in data science for tasks such as trend analysis, risk management, and forecasting. It is often used in economic modeling to predict trends based on past data.

Businesses apply it to estimate sales or budget forecasting and evaluate the impact of marketing strategies.

In healthcare, linear regression can analyze the effect of different treatments by assessing patient outcomes over time.

Additionally, it helps scientists understand relationships within datasets, making it an essential tool for both simple predictions and complex data analysis involving multiple variables. The ability to interpret and communicate these relationships effectively is a significant asset in various fields.

Fundamentals of Machine Learning

Machine learning involves teaching computers to learn from data and make predictions or decisions. It includes various methods, such as supervised learning and regression analysis, which are essential concepts for understanding how machines can process and analyze data effectively.

Supervised Learning Overview

Supervised learning is a core technique in machine learning where the model learns to map inputs to outputs based on example input-output pairs.

It involves training a model on a labeled dataset, which means each input comes with a known output. The goal is to enable the model to predict outcomes for new, unseen data accurately.

There are two main types of problems in supervised learning: classification and regression.

Classification tasks involve predicting a discrete label, like spam or not spam in an email. In contrast, regression tasks focus on predicting continuous values, such as house prices.

Supervised learning uses algorithms like linear regression, decision trees, and support vector machines to construct models.

Introduction to Regression Analysis

Regression analysis is a critical aspect of supervised learning, focusing on estimating the relationships between variables. This analysis helps in predicting continuous outcomes by learning the connection between dependent and independent variables.

Linear regression, the simplest form, assumes a linear relationship between variables, allowing for easy interpretation and implementation.

In linear regression, the model attempts to fit a line that best represents the data trend. This method is widely used in forecasting and determining the strength of predictors. It is crucial in scenarios where understanding the impact of one variable over another is necessary.

Multiple linear regression involves more than one predictor, providing a more complex analysis for diverse sets of data. For detailed guidance on aspects like model formulas, refer to resources on multiple linear regression.

Preparing Data for Regression

Proper preparation of data is crucial for creating an effective linear regression model in Python. This involves sourcing the right dataset, selecting features and targets, and dealing with missing data and outliers.

Dataset Sourcing and Structure

It’s important to use a well-structured dataset for linear regression. The dataset should include both independent variables and dependent variables.

It is often stored in formats like CSV, Excel, or SQL databases.

The dataset should have a clear structure, with columns representing different features and the target variable. Sources like DataCamp’s tutorial can provide guidance on where to find quality datasets. Always verify the credibility and relevance of your data source to the problem at hand.

Features and Target Selection

Selecting the right features and target is key in linear regression. Features are the predictors or independent variables, while the target is the outcome or dependent variable.

Choosing relevant features is essential. Irrelevant features can lead to overfitting or inaccurate models.

Tools like correlation matrices can help identify which features have the most impact on the target variable. Understanding these relationships aids in selecting the most appropriate predictors.

Handling Missing Data and Outliers

Missing data and outliers can skew the results of a regression analysis.

Effective strategies for addressing these issues include:

  • Imputation: Filling in missing data using methods like mean, median, or mode.
  • Removing Outliers: Identifying and excluding data points that fall outside the normal range. Techniques include Z-scores and the IQR method.

Regular checks should be done to ensure data integrity before proceeding with any regression analysis. Handling these issues carefully enhances the model’s reliability and accuracy.

Working with Python for Linear Regression

Implementing linear regression in Python involves using several key libraries that streamline data manipulation and visualization tasks. These tools make it easier to prepare data, visualize patterns, and apply linear regression models effectively.

Important Python Libraries

Python has various libraries that support linear regression. Scikit-learn is a popular choice due to its efficient and straightforward API for implementing machine learning models, including linear regression.

NumPy and SciPy are essential for numerical computations and scientific computing tasks. They provide foundational support for data handling and array manipulation.

Libraries like pandas assist in data manipulation, while Matplotlib helps in creating visualizations that clarify data relationships.

These tools enable smooth data processing and analysis.

Loading and Manipulating Data with Pandas

Pandas is a vital library for data analysis in Python. It allows easy loading and manipulation of data, which is crucial when preparing data for linear regression.

With pandas, data can be read from various sources like CSVs or databases and then cleaned and transformed efficiently. Users can filter, sort, and aggregate data to prepare it for regression analysis.

DataFrames, a primary data structure in pandas, offer robust capabilities for handling spreadsheets or tabular data. This enhances the analytical capabilities of pandas, making data preparation a more simplified process.

Visualizing Data with Matplotlib

Matplotlib is a powerful library for data visualization in Python. It enables users to create diverse plots and graphs, which help in understanding data features before applying linear regression models.

Through plots like scatter plots or line graphs, users can visualize potential relationships between variables, aiding in model selection.

The interactive capabilities of Matplotlib allow for detailed exploration of data, enhancing insights into trends and outliers. Users can customize these plots for better illustration of their data’s behavior.

Thus, Matplotlib is integral for creating visuals that support data interpretation and model assessment.

Constructing a Regression Model

Constructing a regression model involves selecting variables, determining coefficients, and plotting the regression line. The process often utilizes the method of ordinary least squares to find the most suitable line that fits the data. Understanding these concepts is essential to accurately modeling data relationships.

Determining Variables and Coefficients

In a regression model, selecting variables is crucial. The dependent variable is what the model predicts, while independent variables are used for prediction.

For example, in predicting house prices, the price is the dependent variable, and features like size or location are independent variables.

Coefficients in the linear equation represent the relationship between the variables. They show how much the dependent variable is expected to increase or decrease with a change in an independent variable.

Calculating these coefficients accurately is essential for the model’s reliability.

Plotting the Regression Line

Plotting the regression line helps visualize the relationship between the dependent and independent variables. The best-fit line is drawn through the data points, showing the general trend.

To plot the regression line, it’s helpful to use tools like matplotlib in Python, which can easily display graphs.

The closer the data points are to the line, the more accurate the model is. This visual representation helps in assessing the model’s effectiveness and in identifying any potential outliers or anomalies in the data.

Understanding Ordinary Least Squares

The ordinary least squares (OLS) method is commonly used to ensure the best possible fit for the regression line.

OLS minimizes the sum of the squared differences between the observed values and the values predicted by the linear equation. This method provides the most accurate coefficients.

By reducing prediction errors, OLS helps in achieving a balance between the model’s simplicity and accuracy. It’s a fundamental approach that underpins many linear regression models.

Detailed information on how to implement OLS in Python can be found in resources like Scikit-learn’s linear models.

Diving into Linear Algebra Concepts

Linear algebra plays a crucial role in understanding linear regression. It helps explain how data points relate through mathematical concepts like slope and intercept, and how variance and mean influence these relationships.

Slope and Intercept in Linear Equation

The slope and intercept are key components of a linear equation, usually written as (y = mx + b). Here, (m) represents the slope, and (b) is the y-intercept.

The slope indicates the steepness of a line and shows how much (y) changes for each unit increase in (x). A positive slope means the line rises, while a negative slope means it falls. Learning to calculate the slope is essential for predicting outcomes based on trends.

The intercept is the point where the line crosses the y-axis. It represents the value of (y) when (x) is zero. Knowing the intercept helps to understand the starting point of a data trend or the influence of variables not included in the model. Both slope and intercept are fundamental in building accurate predictive models.

Calculating Variance and Mean

Variance measures the spread of data points from the mean, reflecting how much variability exists. It’s calculated by averaging the squared differences from the mean. A high variance indicates that data points are spread out over a wide range of values.

The mean is the average value of a data set and provides a central point around which data points are dispersed.

Understanding mean and variance is pivotal in assessing data consistency and variability.

Together, they form the basis for more complex concepts in statistics and linear regression, allowing analysts to evaluate data distribution and reliability effectively. Variance and mean are essential for developing and refining statistical models, making them indispensable in data analysis.

Model Training and Evaluation

To effectively develop a predictive model, it is crucial to split data appropriately and evaluate the model’s performance accurately. Ensuring that a model is neither too complex nor too simple helps improve its generalizability and accuracy.

Splitting Data into Training and Test Sets

Data splitting is a fundamental step in machine learning. To create reliable models, the dataset is divided into a training dataset and a test set.

This can be done using the train_test_split function in Python’s Scikit-learn library. Typically, the training set comprises 70-80% of the data.

The training dataset teaches the model, while the test set evaluates its prediction capability. Properly splitting the data helps achieve an unbiased measurement of model performance.

It ensures that the model learns the underlying patterns rather than memorizing the dataset.

Assessing Model Performance

Assessing how well a model performs involves using metrics like R-squared, Mean Absolute Error (MAE), and Root Mean Square Error (RMSE).

These metrics quantify the differences between predicted and actual values. Each metric offers insight into model accuracy and error rates.

Cross-validation is another vital technique. It involves splitting the data into multiple parts and training on each subset, providing a more generalized view of the model’s performance.

This approach helps prevent the model from being overly tailored to specific data splits, thus offering a clearer picture of its predictive power.

Preventing Overfitting and Underfitting

Balancing complexity is key to avoiding overfitting and underfitting. Overfitting occurs when a model is too complex, capturing noise rather than the actual pattern. This results in high accuracy on training data but poorly generalizes to new data.

Techniques like regularization and pruning can help address this.

Underfitting, in contrast, happens when a model is too simple, failing to capture essential data patterns. Increasing model complexity or adding more features can address this.

Cross-validation is also an effective tool for identifying and mitigating overfitting and underfitting, ensuring the model maintains its predictive accuracy across different datasets.

Optimization and Computational Efficiency

A computer screen displaying code for linear regression in Python, with mathematical equations and data visualization

In linear regression, improving the performance of models is crucial. This is often achieved by optimizing parameters and ensuring computational efficiency.

Methods like gradient descent and handling statistical issues such as multicollinearity and homoscedasticity are key.

Gradient Descent Explained

Gradient descent is a popular method for optimizing the parameters of a linear regression model. It involves iterating over data to minimize the cost function, often denoted as J(θ).

The algorithm updates the parameters by moving in the direction of the steepest descent. This is calculated by taking the gradient of the cost function.

The learning rate, an important hyperparameter, determines the step size in each iteration.

A small learning rate can result in slow convergence, while a large one might overshoot the minimum. It’s essential to choose an appropriate learning rate to ensure efficient computation and avoid oscillations.

Implementations in Python often use libraries such as scikit-learn, offering easy integration for gradient descent algorithms.

Dealing with Multicollinearity and Homoscedasticity

Multicollinearity occurs when two or more predictors in a model are correlated, making it difficult to isolate the impact of each variable.

This can be addressed by removing highly correlated predictors or using techniques like principal component analysis (PCA) to reduce dimensionality.

Homoscedasticity refers to the consistency of variance in the error terms of a regression model. When this is not met, the reliability of the inference in regression is compromised.

Detecting violations of homoscedasticity can be done using visual methods like residual plots.

Solutions for dealing with heteroscedasticity include transforming variables or using robust standard errors.

Both multicollinearity and homoscedasticity issues need careful handling to ensure accurate model predictions.

Advanced Regression Techniques

Advanced regression techniques enhance predictive accuracy and address issues like overfitting in linear models. Key approaches include polynomial regression and regularization methods, which help understand complex patterns and improve model reliability.

Exploring Polynomial Regression

Polynomial regression is an extension of linear regression used to model data with a non-linear relationship. Unlike simple linear models, polynomial regression can capture curvatures in data by including polynomial terms such as squares or cubes of the predictors.

This approach still uses the method of least squares to minimize errors but allows for a more flexible fit to complex datasets.

For example, a quadratic model (including squared terms) can curve a line to better match the data points. This technique is particularly useful when linear relationships are insufficient.

Care must be taken to select the correct degree of the polynomial, as a higher degree can lead to overfitting, making the model less generalizable.

Leveraging Regularization Methods

Regularization methods can reduce overfitting by adding penalties to the regression model’s complexity.

Common techniques include Lasso and Ridge regression, which modify the cost function used in least squares to balance the model fit and its complexity.

Lasso (L1 regularization) tends to produce sparse models by shrinking some coefficients to zero, effectively selecting relevant features.

Ridge (L2 regularization) shrinks coefficients but retains all features, which can stabilize the solution for datasets with multicollinearity.

Both approaches help in creating models that generalize better to unseen data by preventing overly complex models that fit the noise in the training set.

Using these methods ensures that the model retains necessary features while avoiding the pitfalls of overfitting, making it robust and reliable for predictions.

Measuring Regression Accuracy

A computer screen displaying a python code editor with a linear regression algorithm and a scatter plot of data points

Understanding how well a regression model makes predictions is crucial. This involves analyzing the model’s residuals and error metrics like MAE, MSE, and R-Squared.

Fine-tuning the model ensures more accurate predictions.

Residuals and The Importance of Fit

Residuals are the differences between actual and predicted values. They indicate how well the regression line fits the data.

A good fit implies that residuals are randomly distributed around zero. When residuals show a pattern, it suggests the model could be improved.

Plotting residuals helps identify any patterns. Consistent patterns in residuals often indicate that the model is missing key relationships.

Thus, analyzing residuals is essential to determine if adjustments are needed to improve the model’s accuracy.

Error Metrics: MAE, MSE, and R-Squared

Mean Absolute Error (MAE) measures the average magnitude of errors in predictions, ignoring their direction. It’s calculated as the average of the absolute differences between predicted and actual values.

Mean Squared Error (MSE) considers both variance and bias, making it useful for sensitive datasets. It squares each error, so larger errors have more impact.

R-Squared, or the coefficient of determination, indicates how well data points fit a model. It’s a measure of explained variance, and its value ranges from 0 to 1. An R-Squared close to 1 means predictions are more accurate.

These metrics are key to evaluating model performance and guiding improvements.

Fine-Tuning Predictions

Improving predictions often involves tweaking model parameters. Techniques like cross-validation and grid search can help refine models.

Cross-validation involves dividing the dataset and testing the model on different subsets, ensuring robustness. This process helps identify the best fitting parameters.

Another approach is to adjust model complexity. This involves finding a balance between underfitting and overfitting.

Adding relevant features, transforming variables, or using regularization methods can enhance predictions.

Fine-tuning maximizes accuracy by finding the most effective model configuration.

Frequently Asked Questions

Linear regression is a crucial topic for those interested in data analysis and machine learning. Understanding how to implement it in Python can help analyze relationships between variables effectively. Here are some frequently asked questions to guide new learners.

How do you perform linear regression analysis using a specific dataset in Python?

To perform linear regression on a dataset, one first needs to explore the data using libraries like pandas for data manipulation. Then, tools such as scikit-learn or statsmodels can be applied to fit a linear model.

These libraries offer functions that simplify fitting and evaluating regression models.

What are the necessary steps to implement linear regression from scratch in Python?

Implementing linear regression from scratch involves several steps. First, clean and prepare the data. Then, calculate the line of best fit that minimizes error by using the least squares method.

Once the model is defined, predictions can be made. Resources like Analytics Vidhya offer detailed guides on this process.

Which Python libraries are considered best for conducting linear regression analysis?

Python offers several robust libraries for linear regression. Common options include scikit-learn for its ease of use and efficiency, and statsmodels for detailed statistical insights.

NumPy and pandas are also helpful for data manipulation and preparation.

Can you provide an example of how to build and interpret a multiple linear regression model in Python?

To build a multiple linear regression model, scikit-learn can be used. Begin by importing the necessary libraries and dataset. Then, separate the dependent and independent variables.

Use the model’s coefficients to interpret the relationship between variables. GeeksforGeeks provides practical examples.

How is the pandas library utilized for linear regression tasks in Python?

Pandas is instrumental in preparing and cleaning data for linear regression. It allows users to handle missing values, normalize data, and create data frames needed for regression models.

The library is often used alongside others like scikit-learn to manage data pre-processing efficiently.

What are the core concepts one must understand when learning about linear regression in the context of machine learning?

Key concepts in linear regression include understanding the relationship between dependent and independent variables. Also, the significance of the slope and intercept, and how these elements influence predictions.

Learners should also grasp how to evaluate a model’s accuracy through metrics like R-squared. These foundational ideas are essential for effective model interpretation.

Categories
Uncategorized

Learning Seaborn Matrix Plots: A Guide to Visualizing Data Relationships

Getting Started with Seaborn

Seaborn is a powerful Python library for creating engaging statistical graphics. It is built on top of Matplotlib, offering a more user-friendly interface for creating visually appealing plots.

This guide will outline how to install Seaborn and provide a basic introduction to the library’s features.

Installing Seaborn

To start using Seaborn, it’s important to first ensure that it is properly installed.

Seaborn can be installed in a Python environment using pip, the Python package manager. Run the following command in your terminal or command prompt:

pip install seaborn

If you are using the Anaconda distribution, you can install Seaborn using Conda, which is another package manager. The command for this is:

conda install seaborn

In addition to Seaborn, it’s necessary to have both Python and Matplotlib installed in your environment, as Seaborn relies on these to function.

To verify the installation, try importing Seaborn in a Python script:

import seaborn as sns

A successful import indicates that the installation went smoothly.

Understanding the Seaborn Library

Seaborn is designed to build on top of Matplotlib, simplifying complex visualizations. It is particularly noted for its built-in themes, which give plots a professional appearance with minimal effort.

The library also supports visualization of complex datasets, including heatmaps and pairwise scatter plots. These features are useful for exploring relationships between variables in data.

Seaborn offers specialized plot types like violin and swarm plots, which are not readily available in Matplotlib. Use Seaborn to easily customize these visuals and tailor them to specific needs.

For detailed examples and tutorials, visit resources such as the Python Seaborn Tutorial on GeeksforGeeks or the Seaborn Tutorial on DataCamp.

Essentials of Seaborn Plots

Seaborn plots are valuable tools for creating clear and appealing visualizations in Python. They work especially well with Pandas DataFrames and come with various themes to enhance readability and presentation.

Plotting with Pandas DataFrames

Seaborn integrates seamlessly with Pandas, which makes it ideal for plotting data stored in DataFrames. DataFrames are collections of data organized into labeled columns, making them perfect for handling datasets.

By accepting DataFrames directly, Seaborn allows users to specify which columns contain the data to be plotted, simplifying the plotting process.

This integration provides a straightforward way to visualize relationships between variables. For example, scatter plots, bar plots, and heatmaps can be quickly generated to express patterns or trends within the data.

Using Seaborn with Pandas not only enhances data efficiency but also supports complex visualizations with minimal code.

Seaborn Themes and Aesthetics

Seaborn offers various themes to improve plot aesthetics, providing an appealing look by default.

Users can choose from themes like dark, white, and ticks, among others. These themes adjust the plot’s overall appearance, catering to different presentation needs.

Color palettes further enhance plot clarity by customizing colors. Options like deep, muted, or user-defined palettes enable standout visualizations.

The use of themes and colors is vital during presentations or in a Jupyter Notebook, where a talk style might be appropriate. By setting these aesthetics, Seaborn ensures that data visuals not only convey information accurately but also look professional and polished.

Matrix Plots and Heatmaps

Matrix plots and heatmaps are powerful tools in data visualization, allowing users to display complex data like correlation matrices or pivot tables in an easy-to-read format. These plots use color-coded cells to represent data values, making patterns and relationships easier to spot.

Creating a Simple Heatmap

A simple heatmap can be created using the sns.heatmap function from the Seaborn library. This function requires a 2D dataset, such as a correlation matrix or a pivot table.

The library translates data values into a color gradient specified by the cmap parameter. Popular color maps include 'viridis', 'plasma', and 'coolwarm'.

For clarity, additional parameters can be used to enhance the display. Setting annot=True will add numeric labels to each cell. Adjusting the fmt parameter allows for control over the number formatting of these annotations.

The combination of color and annotations helps users quickly grasp data insights.

For example:

import seaborn as sns
import matplotlib.pyplot as plt

data = [...]  # Your dataset here
sns.heatmap(data, cmap='viridis', annot=True)
plt.show()

This code creates a visual map of the data, where each cell’s color depends on the data’s value, helping viewers visually assess variable relationships.

Advanced Heatmap Customizations

For more complex data visualization needs, advanced customizations are available.

Adjusting the linewidths parameter can create space between the cells for clarity. Adding cbar arguments allows control over the color bar placement and appearance.

Users may customize the axis labels or titles to better explain their dataset.

To make an annotated heatmap more engaging, modifying the cmap for contrasting colors can emphasize variations in data. Another customization involves setting the limits using vmin and vmax, which can help focus on specific data ranges.

These customizations drive home the data’s story, allowing users to highlight key aspects tailored to their audience and specific analytical requirements. Enhanced heatmaps present a polished and insightful view, critical for in-depth data analysis.

Cluster Maps

Cluster maps in Seaborn are powerful tools for visualizing data patterns through hierarchical clustering. They not only rearrange data into a more insightful view but also allow high customization, including color palettes and scaling options.

Understanding Hierarchical Clustering

Hierarchical clustering is a method used to categorize data points into nested clusters.

In Seaborn, the sns.clustermap function provides a visual representation by arranging data into a heatmap accompanied by dendrograms. These tree-like diagrams show how clusters are grouped at various levels.

A key feature is its ability to reorder both rows and columns of the dataset, making patterns more obvious.

Users can access the reordered indices through clustergrid.dendrogram_row.reordered_ind and clustergrid.dendrogram_col.reordered_ind, which can help in further data analysis.

This technique is especially useful for identifying relationships and trends within complex datasets.

Customizing Cluster Maps

Customizing a cluster map is essential for adapting the visualization to specific requirements.

With Seaborn’s clustermap, adjustments can be made to the color palette, which affects how data values are represented visually. Options are available for various palettes like coolwarm or viridis.

Another feature is standard_scale, which standardizes data along rows or columns to make comparisons clearer. Users can set this parameter to 0 for scaling across columns or 1 for rows.

Additionally, options like figsize and col_cluster help tailor the size and clustering of columns, respectively.

Cluster maps are highly customizable, enabling users to create clear and informative visualizations that suit their specific data analysis needs.

Examining Distributions

When examining data distributions in Seaborn, understanding both histograms and KDE plots is crucial. These tools help visualize a dataset’s spread, providing insights into the underlying patterns and density.

Creating Histograms

Histograms are essential for visualizing frequency distributions. They display data by grouping values into bins, allowing readers to understand how data points are spread across different ranges. Each bin is shown as a bar, with the height indicating the number of data points within that range.

Using Seaborn, histograms can be easily created to provide a clear view of data distributions.

For example, a histogram can quickly show if the data is skewed or exhibits bimodality, revealing different peaks. This makes it easier to identify trends and anomalies.

The choice of bin size can significantly impact the histogram’s appearance and interpretation. Too few bins can oversimplify the data, while too many can make the graph cluttered, complicating analysis.

Understanding KDE Plots

KDE (Kernel Density Estimation) plots provide a smooth estimate of the data distribution. Unlike histograms, which use bins, KDE plots use a kernel to estimate the probability density function. This results in a smooth curve that represents data trends.

KDE plots are particularly useful for identifying the underlying structure of data without being affected by bin size. They can reveal multimodal distributions and subtle data patterns that histograms might miss.

In Seaborn, KDE plots can be combined with histograms for a more comprehensive view. This combination allows for a clearer comparison between the observed frequencies in the histogram and the estimated probability density.

This technique offers a deeper insight into the data’s distribution and density, which is essential for detailed analysis.

Comparative Data Analysis

In the field of data visualization, comparing datasets effectively can reveal patterns and insights that are less obvious in raw data. Seaborn offers versatile tools such as bar, box, and violin plots to highlight these differences and trends. These plots help illustrate categorical comparisons and the distribution of data features.

Bar Plots for Categorical Comparison

Bar plots are a staple for visualizing categorical data. They display data using rectangular bars where lengths represent the value of each category, making them ideal for comparing quantities across different groups.

In Seaborn, categorical plots like bar plots are easy to create and customize. Users can change the color maps (cmaps) and order of categories to emphasize specific features of the dataset.

These plots are particularly useful for assessing differences in frequencies or averages across categories. Adding error bars can provide additional context by showing variability within each category. This lets users see not just mean values, but also how much these values can vary.

Seaborn’s ability to layer additional statistical graphics makes bar plots a powerful choice for comparative analysis.

Utilizing Box and Violin Plots

Box plots offer a concise summary of data distributions through their five-number summary: minimum, first quartile, median, third quartile, and maximum. This makes them excellent for highlighting differences in features, particularly when comparing between groups. Box plots can also identify outliers, providing insight into potential anomalies or unusual data points within the dataset.

Violin plots extend box plots by incorporating density information. They add detail about the distribution’s shape and spread by showing the probability density of the data at different values.

This additional layer is beneficial when distinguishing between multiple datasets or comparing variations within the same category. When analyzing the distribution of datasets, the visual depth provided by pair plots can offer meaningful insights.

Multivariate Data Exploration

Multivariate data exploration involves analyzing datasets with multiple variables to uncover meaningful patterns and insights. Effective visualization tools like pair plots and facet grids in Seaborn can significantly enhance the analysis process, helping to make complex data more understandable.

Leveraging Pair Plots

Pair plots are a powerful way to explore relationships between several continuous variables. They create a grid of scatter plots for each pair of variables, which makes it easy to spot trends or correlations.

In Seaborn, the pairplot() function is used to generate these plots, displaying bivariate relationships and offering insights into distributions with histograms along the diagonal.

This function is particularly useful for identifying linear relationships and potential outliers in datasets.

Pair plots also support customization for exploring trivariate interactions by using hue to add a categorical variable, thus adding a third dimension to the analysis.

This visualization method is efficient for initial data exploration, providing a broad view of the data’s structure.

Facet Grids for Subgroup Comparisons

FacetGrids enhance multivariate exploration by allowing subgroup comparisons across categorical variables. This tool excels in visualizing the distribution of data across different levels of a categorical variable, such as gender or region.

In Seaborn, a FacetGrid is used to map a function like a scatter plot onto multiple axes. Each plot represents a different subgroup, making it easier to detect patterns or differences.

This approach is beneficial for datasets with both continuous and categorical variables, leveraging grid layouts to present comparisons clearly.

FacetGrids make large datasets more manageable, ensuring that each subgroup’s data can be individually inspected while maintaining a consistent visual style across multiple plots.

Line Plots and Time Series

Line plots are essential tools in data visualization, showcasing changes over time in a clear, interpretable manner. In time series analysis, they reveal patterns, trends, and cycles, essential for data-driven decision-making.

Time Series Visualization

Time series visualization highlights data over a time continuum, displaying trends and seasonal patterns. A line plot with Seaborn is ideal for this purpose, plotting data points with a connected line that emphasizes changes between them.

By handling datetime data on the x-axis, Seaborn formats the tick marks effectively, enhancing readability.

Such visualization is crucial for identifying recurring patterns and anomalies in datasets like stock prices or weather records, aiding in forecasting and monitoring. Pairing line plots with additional components like highlighting specific events can make the insights even more meaningful.

Line Plot Customizations

Customization in line plots enhances the clarity and impact of the visual representation. Users can modify attributes like line style, color, and marker type to better convey the data’s message.

In Seaborn’s documentation, versatility in customization is highlighted, allowing adjustments to suit various datasets and visualization requirements.

For instance, using different colors or line styles for different data categories can make multivariate data easier to interpret. Incorporating transparency and error bands, as seen in timeseries plot examples, provides a more comprehensive view by indicating variability and uncertainty.

Such customizations leverage the full power of Seaborn’s functionality, creating compelling and informative visualizations.

Advanced Plot Types

Exploring advanced plot types can greatly enhance data visualization capabilities. This section covers the use of joint plots with hexbins and how data reshaping allows for complex visualizations.

Joint Plots and Hexbins

Joint plots are powerful tools in data visualization, combining different plot types to explore relationships between two variables. They often mix scatter plots with histograms or density plots.

A popular enhancement of the scatter plot in these is the hexbin plot, which aggregates data points into hexagonal bins. This is especially useful for large datasets where overplotting might obscure patterns.

Hexbins improve clarity by displaying the density of points, helping identify trends and correlations in matrix data.

Seaborn provides straightforward methods to create these, using joint plot syntax with options to incorporate hexbins. The ability to interpret high-density regions in data sets sets them apart from plain scatter plots.

Reshaping Data for Complex Visualizations

Reshaping data is essential for creating complex visualizations, such as those involving matrix data. In Seaborn, this often requires adjusting data formats to fit specific plot requirements like pivot tables or reorganizing data into long or wide forms.

Matrix plots benefit from data reshaping by allowing the representation of 3D data relationships in 2D formats. Tools in Seaborn, like FacetGrid and PairGrid, make it easier to handle such data modifications.

These tools enable the visualization of multiple variables simultaneously, providing insights into broader data patterns and interactions. With complex visualizations, users can interpret intricate datasets more effectively.

Categorical Data Representation

Categorical data can be visualized effectively using various plot types in Seaborn. Understanding which plot to use depends on the specific details you want to highlight, such as individual data distributions or frequency counts.

Strip and Swarm Plots

Strip plots and swarm plots are valuable for displaying individual data points within categories. These plots can help identify patterns or outliers in a dataset.

The strip plot scatters data points along a single line for each category, which can show the distribution but may overlap, making it hard to read with larger datasets. In contrast, the swarm plot adjusts for overlap by spreading points along the categorical axis, ensuring each point is visible. This approach provides a clear visualization when categories contain many data points.

Using strip or swarm plots is beneficial in data analysis, especially if understanding specific details about the data distribution is crucial. These plots offer insights that are sometimes not visible in aggregated data representations.

Count Plots for Frequency Visualization

Count plots are an effective tool for illustrating the frequency of categories in a dataset. This plot represents the number of occurrences of each category as bars.

By visualizing frequency, one can quickly identify which categories are most or least common.

Count plots help with comparative analysis among categories, allowing easy spotting of trends or imbalances. For example, a count plot can highlight which products are most popular in sales data or survey responses. Using count plots supports data-driven decisions by revealing simple count-based insights that might dictate different analysis strategies or business actions.

Interactive Visualizations

A computer screen displaying a colorful matrix plot with interactive visualizations

Interactive visualizations enhance the user experience by allowing dynamic exploration of data. While Seaborn is primarily a static visualization library, tools and methods can be used to make its plots interactive, especially when combined with other libraries.

Dynamic Plots with Seaborn

Seaborn integrates closely with Matplotlib, which serves as a base for creating dynamic plots. Although Seaborn itself doesn’t offer native interactivity, users can leverage the capabilities of Matplotlib to add interactivity.

This feature allows users to interact with plots through zooming, panning, and more.

To make plots interactive in environments like Jupyter Notebooks, libraries like ipympl can be used.

ipympl provides an interactive Matplotlib backend that makes Seaborn plots interactive within the notebook environment. Installing and enabling ipympl can transform static plots into interactive ones, enhancing the visualization experience significantly.

Integrating with Other Libraries

Beyond Matplotlib, integrating Seaborn with other libraries enhances interactivity.

For instance, using Plotly alongside Seaborn can create dynamic plots that allow hover effects and drill-down capabilities. Plotly is well-known for its ability to handle interactive graphing efficiently.

Another tool to consider is Bokeh, which works well for creating interactive visualizations that can be embedded into web pages.

Bokeh’s server functionality is particularly useful for deploying interactive visualizations at scale.

These integrations enable data analysts and scientists to transform static Seaborn plots into powerful, interactive tools, providing more insightful and engaging data experiences.

Practical Tips and Tricks

A laptop displaying a Seaborn matrix plot tutorial with a notebook, pen, and coffee mug on a desk

This section offers strategic advice on enhancing Seaborn plots’ efficiency and tackling common obstacles. Learn how to handle the tips dataset for better performance and gain insights into practical troubleshooting methods.

Performance Optimization

When working with large datasets like the tips dataset, performance can be enhanced by reducing data size and complexity. Use sampling techniques to work with a smaller subset of data without losing important insights.

Preprocessing data efficiently can also save computation time. When plotting, setting parameters like dpi for increased resolution improves clarity without redrawing large plots repeatedly.

Choosing the right plot type is key. For example, using heatmaps in matrix plots can provide comprehensive data visualization without overloading the system. Ensure to update Seaborn and related libraries to their latest versions for optimized performance.

Troubleshooting Common Issues

Users often encounter issues such as mismatched plot sizes or rendering errors in tutorials. Checking for inconsistencies in datasets, such as the tips dataset, can prevent these errors.

Ensure data types are correctly formatted; for example, converting categorical data into numeric types where necessary.

Sometimes plots appear cluttered. Simplifying data and removing unnecessary dimensions can help. Users might face installation problems; confirming the proper installation of dependencies like Matplotlib and Pandas is essential.

Quick Tip: Use online forums and resources when errors persist. They’re rich in community-driven solutions that pinpoint specific Seaborn issues. For more detailed guidance, see the troubleshooting section in relevant documentation on Seaborn matrix plots.

Frequently Asked Questions

A person browsing a webpage with a list of frequently asked questions about learning Seaborn matrix plots

Seaborn is a powerful tool for creating matrix plots with customizable features. It provides easy ways to manipulate color palettes, manage axis labels, and create specific types of plots like scatterplot matrices and pairplots.

How can you customize the color palette of a heatmap in Seaborn?

To customize the color palette of a heatmap in Seaborn, use the cmap parameter. It allows the selection of color maps such as 'viridis', 'coolwarm', or any other Matplotlib colormap.

Users can also create custom palettes with Seaborn’s color_palette() function, enhancing visual presentations significantly.

What are the steps to create a pairplot in Seaborn?

Creating a pairplot in Seaborn involves using the pairplot() function. Import necessary libraries and data, then call sns.pairplot(data).

This function generates pairwise relationships in a dataset, automatically adjusting labels and legends for convenience. It’s helpful for exploring data distributions and relationships.

How is a matrix plot implemented in Seaborn differently from Matplotlib?

Seaborn builds on Matplotlib’s capabilities by providing more advanced statistical graphics. Seaborn’s matrix plots, like heatmaps or correlation matrices, integrate better with Pandas data structures, offering additional features like easier customization and automatic legend generation, as noted in its documentation.

Can you provide an example of using Seaborn to plot a correlation matrix?

To plot a correlation matrix in Seaborn, first calculate the correlation using df.corr() with a DataFrame df. Then, use sns.heatmap(corr) to visualize the matrix.

Options like annot=True can add value labels to each cell, making the matrix easier to interpret.

What options are available for controlling the axis labels in Seaborn matrix plots?

Controlling axis labels in Seaborn matrix plots involves parameters like xticklabels and yticklabels. Users can specify label rotation or frequency displayed on axes.

Additionally, functions like sns.set() can adjust style and global settings, providing flexibility in label presentation.

In what scenarios is Seaborn’s scatterplot matrix preferred over a simple scatterplot?

A scatterplot matrix is preferred when analyzing relationships between multiple variables simultaneously. It displays all pairwise scatterplots for a dataset rather than focusing on just two variables.

This helps in understanding complex data interactions more thoroughly and efficiently.

Categories
Uncategorized

Learning T-SQL – Database Security Concepts for Effective Safeguarding

Understanding T-SQL and SQL Server Fundamentals

T-SQL is a language used to interact with databases. It is an extension of SQL, providing extra features like procedural programming and variables. These features allow for complex transactions and operations within a relational database management system (RDBMS).

SQL Server is a popular RDBMS that uses T-SQL as its primary language. It manages data in a structured way, ensuring efficient data retrieval and storage. SQL Server is widely used in businesses for managing large databases safely and reliably.

When working with databases, it’s essential to know basic concepts such as tables, rows, and columns.

Tables store data in rows, with each row representing a single record. Columns define the type of data stored.

One of the main tasks in database management is ensuring data security. T-SQL offers commands for setting permissions and access controls. This is crucial to protect sensitive information from unauthorized access.

A simple T-SQL command for retrieving data is the SELECT statement. This statement can be used to query specific columns from a table.

SELECT column1, column2 FROM table_name;

Studying these fundamentals helps users effectively manage and interact with database systems. For more advanced understanding, the concepts in Microsoft’s SQL Server 2012 T-SQL Fundamentals are highly recommended. They provide in-depth knowledge for both beginners and experienced users.

Authentication in SQL Server

In SQL Server, authentication is crucial for database security. It involves verifying the identity of a user or system before granting access to resources. Two common methods are Windows Authentication and SQL Server Authentication.

Windows Authentication

Windows Authentication uses the user’s Windows credentials to access SQL Server. This method integrates with the Windows security model, which means it benefits from network security features such as Kerberos. No separate SQL Server password is needed, reducing the risk of password breaches.

Administrators prefer this method for its ease of use and centralized management. It ensures uniform security policies across the network. Moreover, it supports automatic login, enhancing user convenience and maintaining security.

Benefits of Windows Authentication include:

  • Integrated Security: Uses domain credentials.
  • No Password Synchronization: Relies on Windows passwords.
  • Stronger Security Measures: Leverage existing network security protocols.

SQL Server Authentication

SQL Server Authentication requires separate login credentials specific to SQL Server. Users must provide a username and password to connect. This method is useful in environments not fully integrated with Windows or in mixed operating system setups.

It allows flexibility as users do not need a Windows account. This is beneficial for external users or applications that access the database without a Windows domain. However, maintaining security with SQL Server Authentication demands strong password policies and regular updates.

Considerations include:

  • Separate Credentials: Requires unique SQL account.
  • Greater Administrative Burden: Need to manage passwords.
  • Potential Security Risks: If passwords are weak, there is a higher risk.

Both authentication methods offer distinct advantages for different scenarios. Proper implementation ensures secure access to SQL Server environments.

Authorization and Role Management

Understanding the main aspects of authorization and role management in T-SQL is crucial for maintaining database security. This involves specific roles that determine what actions users can perform on the database. These roles help control access and ensure that users only have privileges that match their responsibilities.

Fixed Server Roles

Fixed server roles in SQL Server are predefined roles designed to provide specific permissions broadly across the entire server. They simplify management by grouping common privileges under a single role.

An example is the sysadmin role, which grants complete control over all server activities.

Other important fixed server roles include securityadmin, which allows user permission management, and serveradmin, which handles server-wide configuration.

These roles are essential for effective server administration, as they help to assign and manage permissions consistently across multiple databases.

Fixed Database Roles

Fixed database roles apply to individual databases, granting specific permissions necessary for database-level tasks.

The db_owner role has complete database management authority, similar to sysadmin at the server level. This role allows users to perform any activity at the database level, including schema design and data manipulation.

Alternative roles include db_datareader, allowing reading of all data within the database, and db_datawriter, permitting data modification.

These roles ensure that access permissions are appropriate to the user’s responsibilities, helping to maintain efficient and secure database operations.

Custom Role Definitions

Custom role definitions allow for tailored permission settings that are not covered by fixed roles. This flexibility is vital for unique organizational needs, enabling database administrators to create roles that match specific job functions and security policies precisely.

To define a custom role, administrators can use T-SQL to specify the exact permissions and targets.

This might include permissions for creating tables, executing stored procedures, or managing user accounts.

Custom roles thus offer granular control, ensuring that users can perform their roles effectively without being granted unnecessary permissions.

Implementing Database Security Policies

Implementing database security policies is crucial for maintaining data integrity and privacy. These policies define rules and permissions to ensure only authorized users access sensitive information.

A strong security policy involves several key components.

Regularly updating security measures and performing audits help identify vulnerabilities. Database administrators often use Role-Based Access Control (RBAC) to manage permissions effectively.

Encryption is another essential tool. It protects data by converting it into a secure format, especially important for data transmitted over networks.

Monitoring and logging database activities are vital for detecting suspicious behavior. By recording actions, it becomes easier to track unauthorized access attempts and take necessary actions quickly.

Implementing security policies also means considering privacy statements. These statements inform users about data collection and usage, ensuring transparency and compliance with legal standards.

Here’s a table summarizing important components for database security:

Component Description
RBAC Manages user permissions
Encryption Secures data through coding
Monitoring Tracks database activities
Privacy Statement Educates users about data handling

Ensuring that all these elements are in place can significantly reduce the risk of data breaches. Administrators need to stay informed about the latest security threats and adapt their policies accordingly. They play a pivotal role in safeguarding the organization’s data and maintaining trust with users.

User Management and Permissions

User management and permissions are crucial for maintaining database integrity and security. It involves creating and managing user accounts, assigning permissions, and resolving issues like orphaned users.

Creating and Managing Database Users

Database users are the individuals or applications that interact with a database. These users need specific credentials to access the system.

Creating a user involves defining a username and setting a secure password. Administrators assign users with the necessary permissions to perform their tasks.

Managing users includes modifying or removing accounts as needed. The command DROP USER can be used to remove unnecessary users. Care should be taken when removing users to avoid affecting database access unexpectedly.

Granting and Revoking Access

Granting access means providing users with the permissions they need to interact with the database.

This can include read, write, or execute permissions at the database level. These are usually handled with SQL commands like GRANT and REVOKE.

Using these commands allows administrators to ensure the right users have the necessary access while maintaining security.

It is important to regularly review permissions to adapt to any changes in user roles or responsibilities.

Handling Orphaned Users

Orphaned users occur when database users are not linked to a valid login. This can happen if a login is removed or changed without updating its associated database users.

Resolving orphaned users involves identifying them with query commands and correcting their links.

Using SQL tools like ALTER USER or DROP LOGIN, administrators can address these orphaned accounts. Keeping track of logins and their associations with database users is essential in preventing and resolving orphaned users efficiently.

Protecting Data with Encryption

Ensuring data security in SQL Server is crucial. Two commonly used methods are Transparent Data Encryption (TDE) and Column-Level Encryption. Each method offers unique benefits and serves distinct purposes, allowing users to protect sensitive information effectively.

Transparent Data Encryption

Transparent Data Encryption (TDE) helps secure databases by encrypting data at rest. This means the entire physical database file, including log files, is encrypted without requiring changes to existing applications.

TDE uses an encryption certificate and key, which secure the data and prevent unauthorized access.

SQL Server handles encryption and decryption automatically, making it invisible to users.

This feature is particularly beneficial for compliance requirements as it encrypts backups, enhancing protection against unauthorized recovery attempts.

TDE is a robust choice for organizations needing to secure data without modifying applications.

Column-Level Encryption

Column-Level Encryption targets specific columns in a database table. This method is ideal for encrypting sensitive data, like credit card numbers and social security numbers, while leaving other data untouched.

Implementing this encryption involves using functions like ENCRYPTBYKEY and DECRYPTBYKEY in Transact-SQL.

Unlike TDE, Column-Level Encryption requires developers to modify database schemas and application code to handle encryption and decryption manually.

This method offers greater control over which data elements are encrypted. However, it may impact performance, particularly in large databases. Despite the complexity, it is an effective strategy for ensuring that specific, sensitive data remains protected.

Data Privacy Considerations

Data privacy is crucial in database management and involves understanding privacy statements and managing cookies efficiently. These elements protect personal information and affect how online activity and personalized advertising are handled.

Understanding Privacy Statements

Privacy statements are documents that detail how a company collects, uses, and protects personal data. They are essential for informing users about what data is being gathered.

These statements include specific information such as data usage, storage methods, and the security measures in place. Transparency in these statements builds trust with users.

They help ensure compliance with regulations like GDPR.

Companies should update their privacy statements regularly to reflect any changes in data management policies. Doing so helps users feel informed about their personal data.

Cookie Management

Cookie management is essential for maintaining user privacy.

Cookies are small files stored on devices that track online activity. They can be classified into several types, including mandatory and optional cookies.

Managing third-party cookies is crucial since they are often used for personalized advertising.

Users can adjust their settings to block such cookies.

It’s advisable for websites to inform users about the cookies they use and offer options to manage them.

Users should be able to easily reject or choose only necessary cookies for the best privacy experience. Allowing users control over these settings enhances their trust and protects personal data.

Working with Database Objects

Database objects are crucial components in managing and securing data. This involves creating and managing objects, as well as ensuring secure access to them. These tasks are often implemented using tools like SQL Server Management Studio (SSMS).

Creating and Managing Objects

Creating database objects is an essential skill in working with SQL databases. Objects include tables, views, indexes, and stored procedures.

In SSMS, users can easily create these objects through the graphical interface or T-SQL scripts. For example, a table can be created with specific columns and data types.

Managing these objects involves tasks such as updating structures, modifying indexes, and maintaining relationships. Regularly checking the performance and usage of these objects ensures they meet the database requirements.

Effective management also includes backing up objects and monitoring their health using SSMS tools.

Securing Access to Objects

Securing database objects is critical for protecting data integrity and privacy. Access control is implemented through permissions and roles.

In SSMS, administrators can assign specific rights to users, allowing them to perform only the necessary actions on database objects. This means defining who can read, write, or modify specific data.

Another aspect of security involves encrypting sensitive data. It ensures that even if unauthorized access occurs, the data remains unreadable.

Regular audits and reviews of security policies help maintain a secure environment. By using SSMS, these security settings can be managed efficiently, enabling administrators to quickly implement changes when needed.

Advanced Security Features

Implementing robust security features in databases is crucial for protecting sensitive data. Two important elements are Row-Level Security and Dynamic Data Masking. These techniques help control access and visibility of data within a database, enhancing overall security.

Row-Level Security

Row-Level Security (RLS) allows database administrators to control access to rows in a table based on user identities. This feature ensures users see only the data relevant to them without altering application code.

With RLS, security policies are defined using predicates that filter rows at query time. For example, managers can access their team’s data only.

It’s particularly valuable in multi-tenant applications where data separation is essential.

Implementing RLS involves creating security policies and functions, ensuring data visibility aligns with individual roles.

RLS simplifies security management by centralizing access control within the database. It reduces the need for extensive code changes in applications.

Users experience seamless and secure access without knowing the complexities behind the scenes.

Dynamic Data Masking

Dynamic Data Masking (DDM) limits sensitive data exposure by masking it at query time. Users see only partial or obfuscated data, protecting valuable information like credit card numbers or social security numbers.

DDM is configured at the column level. Administrators define mask patterns based on security needs.

This technique helps comply with privacy regulations, allowing safe data sharing across different departments or user roles. For example, displaying only the last four digits of a credit card number.

Implementing DDM does not require changes to database schema or client applications.

It helps organizations prevent unauthorized access while delivering accurate, non-sensitive data to users. DDM enhances security, making it easier to manage data privacy and comply with regulations.

Maintaining SQL Server Security

SQL Server security is vital for protecting data and ensuring smooth operations. There are several key practices to help maintain it effectively.

Use Authentication and Permissions:
SQL Server supports both Windows authentication and SQL Server authentication. Windows authentication is generally more secure because it uses Active Directory.

Assign permissions wisely, granting specific users only what they need.

Encrypt Data:
Data encryption is crucial. SQL Server offers features such as Transparent Data Encryption (TDE) to protect data at rest and Secure Sockets Layer (SSL) for encrypting data in transit.

Regular Updates:
Regularly update SQL Server to patch security vulnerabilities. Keeping the server up-to-date helps protect against new threats.

Monitor Access and Logs:
Use SQL Server’s auditing features to track who accesses the database. Regularly review these logs for any suspicious activity that might indicate a security breach.

Backups and Recovery:
Frequent backups are essential for data security. Ensure backups are stored securely and test recovery procedures regularly to prevent data loss during incidents.

Implement Network Security:
Network security, including firewalls and secure network configurations, helps protect SQL Server from unauthorized access. Limit access to the SQL Server through trusted IP addresses only.

These practices strengthen SQL Server security and protect valuable data. It requires consistent monitoring and adaptation to new security challenges.

Security Best Practices and Auditing

Database security is vital for protecting sensitive data. Implementing best practices ensures that databases are secure against unauthorized access and data breaches. Regular audits help in identifying vulnerabilities.

Use Strong Passwords:
Enforce complex password requirements for all database accounts. Change passwords regularly to minimize security risks.

Enable Encryption:
Encrypt data both at rest and in transit to prevent unauthorized access. Using T-SQL, administrators can set up encryption protocols for added protection.

Implement Access Controls:
Limit access to sensitive information through role-based permissions. Only essential personnel should have access to critical data.

Conduct Regular Audits:
Regularly audit database activities using tools like SQL Server Management Studio. Audits help detect suspicious activities or policy violations.

Set up audit specifications for different databases, as outlined in a guide on setting up server audit specifications.

Monitor Data Changes:
Use triggers in T-SQL to track changes. Triggers log edits and deletions, essential for maintaining data integrity.

More about T-SQL triggers can be found in the KSU database security and auditing PDF.

Back Up Data:
Regular backups are crucial. Store backups securely and test recovery processes regularly to ensure they work when needed.

Update Software:
Keep database management systems updated with the latest patches. This reduces the risk of exploits targeting outdated software.

Social Media Connections:
Be cautious about sharing database information over social media platforms. Connect with trusted and verified accounts only, minimizing potential security threats.

Applying Security Updates and Patches

Applying security updates and patches is a critical practice in computer science. These updates help protect databases from vulnerabilities and potential attacks.

Regularly updating databases ensures that security measures are current. Keeping software updated reduces the risk of exploitation by cyber threats.

Patch management involves identifying, acquiring, and applying patches. This process can be automated using patch management systems. Automation saves time and minimizes human error.

It is essential to prioritize updates according to their severity. High-risk vulnerabilities should be patched immediately to prevent possible breaches.

Create a schedule for regular updates and backups. This ensures minimal disruption and maintains system integrity.

Task Frequency
Critical Updates Immediately
Regular Updates Weekly or Monthly
System Backups Before Major Updates

Testing patches in a controlled environment is recommended. This helps identify potential issues before deploying them to live systems.

Communication within teams is vital. Everyone should be aware of updates and any changes they might bring.

Keeping track of updates and patches through detailed documentation is important. This provides a clear history of actions taken to secure the database.

Incorporating effective patch management strategies helps in building a robust defense against potential threats. Applying security updates and patches is not a one-time task but an ongoing process that ensures the safety and reliability of database systems.

Frequently Asked Questions

Database security involves several key practices and measures such as establishing security roles, configuring secure environments, and using specific security measures in SQL Server and Azure SQL databases. Implementing these effectively requires adherence to established principles and checklists.

What are the essential security best practices for SQL Server?

Ensuring SQL Server security starts with strong authentication and access controls. Regularly update and patch the server to protect against vulnerabilities.

Utilize firewalls and network security groups to limit access. Implement encryption for sensitive data and monitor server activity for unusual patterns. Consider using encrypted connections to enhance protection.

How do SQL Server security roles contribute to database protection?

SQL Server security roles help manage who can access and modify data by defining specific permissions. Roles such as sysadmin, db_owner, and db_datareader provide different levels of access.

Assign roles based on the principle of least privilege, ensuring that users have only the permissions necessary to perform their tasks.

What are the primary types of database security measures implementable in SQL Server?

Several key measures include encryption, authentication, and access controls.

Encryption methods such as TDE (Transparent Data Encryption) protect data at rest. SQL Authentication and Windows Authentication ensure secure login processes.

Role-based access control (RBAC) allows precise user permissions, while auditing provides a record of access and changes.

Could you provide a checklist for securing an Azure SQL Database?

When securing an Azure SQL Database, first configure firewall settings to restrict access. Use Azure Active Directory for centralized identity management.

Enable auditing and threat detection to monitor activities. Apply advanced data security protections like encryption.

Examine and apply the latest updates and patches regularly for optimal security.

What principles should guide the configuration of a secure SQL Server environment?

Key principles include the principle of least privilege, ensuring minimal permissions are granted to users and applications.

Ensure proper segmentation of networks to reduce risk exposure. Applying security patches promptly and regularly, conducting continuous monitoring, and using encryption for sensitive information are foundational practices.

How does one effectively implement database security in T-SQL?

To implement database security in T-SQL, you should start by writing scripts. These scripts will ensure that only authorized users can access or modify data. Use T-SQL to configure roles and permissions systematically. You should also encrypt sensitive columns within tables using TDE or column-level encryption. Lastly, write triggers to monitor data changes and help detect unauthorized actions.

Categories
Uncategorized

Learning T-SQL – GUIDs and Sequences: Mastering Unique Identifiers

Understanding T-SQL and Its Environment

T-SQL, short for Transact-SQL, is a key player in managing data within Microsoft environments. It enhances SQL capabilities and is used within Microsoft SQL Server. T-SQL supports complex operations and is integral to handling data efficiently.

Azure SQL Database and Managed Instance also use T-SQL for cloud database services.

Basics of SQL and T-SQL

SQL, or Structured Query Language, is used for managing and manipulating relational databases. It allows users to query data, update records, and define data structures.

T-SQL, an extension of SQL, adds procedural programming capabilities. This enables users to include control-of-flow language constructs such as loops and conditionals.

T-SQL provides tools for error handling and transaction control, making it more powerful for database development. Its enhancements include local variables, functions, and support for triggers, which are actions automatically executed in response to certain events.

This makes T-SQL essential for advanced database operations, especially in relational database management systems.

Overview of Microsoft SQL Server

Microsoft SQL Server is a comprehensive RDBMS that uses T-SQL. It supports a wide range of business intelligence tools and complex applications. SQL Server is known for its robust security features, scalability, and integration with Microsoft applications.

The database engine within SQL Server handles tasks such as storing, retrieving, and processing data. It supports both on-premises and hybrid cloud environments. SQL Server also includes tools for data analytics and visualization, and it enables the development of high-performance, reliable data-driven applications.

T-SQL is embedded in SQL Server, enhancing its functionality by providing procedural logic and system control abilities.

Introduction to Azure SQL Database and Managed Instance

Azure SQL Database is a fully managed cloud database service powered by Microsoft, which uses T-SQL. It provides scalability, high availability, and supports most SQL Server features. Azure SQL Database is optimized for cloud environments, offering automatic scaling and patching.

Azure SQL Managed Instance integrates Azure’s capabilities with on-premises SQL Server. It provides a seamless migration path to the cloud. Managed Instance offers compatibility with SQL Server features, making it easier to shift existing databases to the cloud. This ensures minimal changes to applications requiring database connectivity, thus maintaining application integrity while benefiting from cloud-based services.

Both Azure services leverage T-SQL for database operations, ensuring effective data management in the cloud.

Database Objects and Schema Definitions

A database schema diagram with tables, columns, and relationships

Database objects such as tables, views, and functions play essential roles in how databases operate. Understanding how these components are structured and defined is key to effectively working with SQL databases.

Tables and Their Role in SQL

Tables are fundamental database objects that store data in rows and columns. Each table is designed to represent a specific entity, like customers or orders. The structure of a table is defined by its schema, which includes column names, data types, and constraints. Tables serve as the main interface for querying and manipulating data.

Creating a table requires specifying these details, often with a designated schema_name to organize and manage permissions. Tables must be carefully designed to ensure data integrity and efficiency.

Views, Stored Procedures, and Functions

Views in SQL are virtual tables created by querying one or more tables. They provide a way to streamline complex queries and can be used to restrict access to specific data. Unlike tables, views do not store data themselves; they display results based on stored queries.

Stored procedures are predefined collections of SQL statements that can perform operations like updates or calculations. Functions, including user-defined functions, are similar but mainly return a single value. Both are vital for automating tasks and enhancing database performance. They are associated with a schema_name for managing accessibility and execution permissions effectively.

Data Manipulation and Query Language Essentials

Understanding the essentials of SQL is crucial for working with databases effectively. This includes writing basic queries and employing advanced data manipulation techniques. These skills are vital for both beginners and experienced developers who aim to retrieve and manipulate data efficiently.

Writing Basic SQL Queries

SQL is the query language that lets users interact with databases to access data. Writing a basic SQL query usually begins with the SELECT statement, which retrieves data from the database. Users often specify the columns needed or use * to select all fields.

Clauses like WHERE filter results based on conditions, which helps in narrowing down data.

The ORDER BY clause sorts the data in ascending or descending order. String functions such as CONCAT and UPPER are frequently used to manipulate text data. These allow users to combine or transform strings within the query. It’s important to grasp these fundamentals to build complex queries with ease.

Advanced Data Manipulation Techniques

Advanced techniques in SQL include window functions, which perform calculations across a set of table rows that are somehow related to the current row. Examples include ranking functions like ROW_NUMBER and aggregation functions like SUM. These are vital for generating reports without altering the underlying data.

Joining tables using INNER JOIN, LEFT JOIN, and others enable the combination of related data from different tables.

Additionally, manipulating data involves using SQL commands like INSERT, UPDATE, and DELETE for modifying dataset entries. Mastering these advanced techniques is essential for efficiently managing and analyzing large datasets.

Working with Indexes and Keys

Indexes and keys are essential components for managing databases efficiently. They play a significant role in organizing data and optimizing search and retrieval processes. Proper use of keys helps maintain data integrity, while indexes enhance query performance.

Understanding Primary Keys

A primary key is a unique identifier for each record in a database table. It ensures that each entry is distinct, preventing duplicate data. Primary keys are crucial for establishing relationships between tables, which is fundamental for relational database designs.

These keys are often composed of one or more columns in a table. They must contain unique values for each row and cannot be null.

By enforcing uniqueness, primary keys help maintain data accuracy and consistency. This makes them invaluable for any well-structured database system.

The Importance of Indexes in Performance

Indexes improve the speed of data retrieval operations by creating a data structure that allows for faster searches. They work like an index in a book, allowing the database to quickly locate the needed information without scanning every row.

This efficiency is particularly important in large databases where query performance is a concern.

Without indexes, database queries would be significantly slower, especially for complex queries on large datasets. However, while indexes increase search speed, they also require additional storage space. Therefore, balancing between speed and storage is critical for optimal database management. This book on T-SQL fundamentals discusses how indexes can create a unique structure for quick access to data.

Introduction to GUIDs in T-SQL

GUIDs, or Globally Unique Identifiers, serve as a universal identifier in T-SQL. They ensure each identifier is unique across databases. This section covers their nature and how they function as primary keys, highlighting their role in maintaining unique entries within SQL Server databases.

The Nature of GUIDs

A GUID is a 128-bit number used in T-SQL to uniquely identify database objects. It is written as a string containing hex digits separated by hyphens, such as {123e4567-e89b-12d3-a456-426614174000}.

Uniqueness is a key property, ensuring that no two GUIDs are the same, even across different servers. This nature makes them ideal for scenarios requiring integration or synchronization between multiple databases.

Though GUIDs offer significant advantages in uniqueness, they can lead to larger table sizes and slower performance due to their length compared to integers. Therefore, it’s essential to weigh their benefits against potential impacts on database efficiency when considering their use in SQL Server.

Using GUIDs as Primary Keys

Using GUIDs as primary keys helps databases maintain unique records effortlessly. As a primary key, a GUID ensures that each row in a table is distinct, which is crucial in terms of data integrity.

While having GUIDs as primary keys is beneficial, there are performance considerations. GUIDs are larger than typical integer keys, which may lead to fragmentation in indexes and larger database sizes. This can result in slower read and write operations.

To mitigate this, a sequential GUID can be used to reduce fragmentation by maintaining the insertion order in the database.

The choice to use GUIDs as primary keys ultimately depends on the specific requirements and constraints of the database system being used.

Implementing Sequences in SQL Server

Sequences in SQL Server provide a way to generate unique numeric values, which is especially useful for creating primary keys or other unique identifiers. By understanding how to work with sequence objects, developers can efficiently manage and automate value generation in databases.

Basics of Sequence Objects

In SQL Server, a sequence is a user-defined schema-bound object. It generates numeric values according to a specified format. A sequence can be created and managed independently from a table, which provides more flexibility compared to auto-incrementing columns.

Attributes of Sequence Objects:

  • Sequence Name: Each sequence is identified by a unique name.
  • Start With: Defines the starting point of the sequence.
  • Increment By: Specifies how much the sequence should increase or decrease with each call.

Sequence objects are especially useful when you need to control the specific order of numbers generated. Additionally, they allow you to use the same sequence across multiple tables.

To read more about SQL Server’s implementation, consider practical resources like T-SQL Fundamentals.

Creating and Using a Sequence

To create a sequence in SQL Server, the CREATE SEQUENCE statement is used, which specifies the name, start value, and increment value. Here’s a basic syntax outline:

CREATE SEQUENCE sequence_name
START WITH 1
INCREMENT BY 1;

Once created, sequences can be used with the NEXT VALUE FOR function to insert generated numbers into tables. This function retrieves the next number from the specified sequence.

For example, using a sequence to assign values in a table:

INSERT INTO my_table (id, column1)
VALUES (NEXT VALUE FOR sequence_name, 'value1');

By using sequences, developers gain precise control over value generation, enhancing data management continuity. For more advanced techniques, the Microsoft SQL Server T-SQL guide is an excellent reference.

Controlling Sequence Behavior

In T-SQL, controlling sequence behavior involves setting important parameters such as increments, limits, and options that affect cycling and caching. These adjustments allow sequences to be tailored to fit specific data requirements and performance goals within a database system.

Setting Sequence Increment and Limits

When defining a sequence in T-SQL, specifying the increment is crucial. The increment value determines how much the sequence number increases with each use.

Users can define both positive and negative increments based on the application’s needs.

Ranges are set using the MINVALUE and MAXVALUE options. Setting these values controls the boundary of the sequence.

When a sequence reaches its maximum value, it will either stop or reset depending on other settings. This feature is important for preventing overflow and ensuring the expected performance.

Understanding Cycles and Caching in Sequences

Sequences in T-SQL can be configured to cycle or not cycle. The CYCLE option allows the sequence to reset to the min value once the max value is reached.

Conversely, using the NO CYCLE option will stop the sequence from generating new numbers upon reaching its limit. This choice impacts how repeated values are handled, which can be vital for maintaining data integrity.

Caching helps improve performance by storing a set of sequence numbers in memory, reducing trips to the database.

Using the CACHE option can significantly enhance performance for applications needing frequent sequence number generation.

For critical use cases where persistent tracking of sequence numbers is required, the NO CACHE option ensures that each number is retrieved directly from the database, ensuring consistency.

Integrating Sequences with Tables

When working with T-SQL, integrating sequences into tables can be managed effectively through different methods. Sequences can be generated for table columns, and they can be controlled together with identity columns for seamless data handling.

Sequence Generation for Table Columns

Sequences are database objects that help generate unique numbers. They can be created using the CREATE SEQUENCE statement.

Once a sequence is defined, it can be used to populate a column with numbers that follow a specific order.

To integrate a sequence with a table, use the NEXT VALUE FOR function. This function retrieves the next value from the sequence and can be inserted directly into a table’s column.

This practice ensures that each entry gets a unique number, which can be crucial for maintaining data integrity in applications that require consistent numbering across rows.

Managing Identity Columns and Sequences

Identity columns are another way to generate unique numbers automatically for table entries. While both sequences and identity columns serve similar purposes, they have different use cases and advantages.

Identity columns auto-increment with each new row. They are often used when the requirement is strictly tied to the order of row insertion.

However, sequences offer more flexibility as they are independent objects and can be shared across multiple tables.

For managing sequences, the sp_sequence_get_range procedure might be used to obtain a set of values efficiently. This allows pre-allocating a range of numbers, reducing overhead when handling large insert operations.

Error Handling and Exceptions with Sequences

Error handling in T-SQL related to sequences can be intricate. Key challenges include managing gaps and ensuring correct restart scenarios. Understanding these issues can help maintain data integrity.

Common Errors with Sequences

When working with sequences in T-SQL, common errors include duplicated values, skipped numbers, and incorrect ordering. Sequence values might also be consumed without being used, leading to gaps.

Errors occur when sequences are incremented but not stored in the intended table, causing number gaps.

Concurrency issues can arise when multiple transactions access a sequence, potentially leading to duplicates.

To mitigate these issues, developers should use TRY…CATCH blocks for transactions involving sequences. This helps handle exceptions and ensures sequence integrity.

Another strategy includes careful planning of sequence restarts or resets, especially during deployments or data migrations.

Handling Gaps and Restart Scenarios

Gaps in sequences are typically caused by rolled-back transactions or aborted operations. Although T-SQL does not provide built-in features to avoid gaps entirely, strategies can minimize their impact.

For critical applications, setting the sequence object’s cache size to a small number or even zero can reduce gaps. This affects performance but ensures tighter number control.

Restart scenarios need attention when reseeding sequences after data truncation or during maintenance.

A typical approach is using the ALTER SEQUENCE ... RESTART WITH statement to control the starting point. Developers must ensure the new starting value does not overlap with existing data, preventing potential conflicts.

Optimization Techniques for T-SQL

Optimizing T-SQL involves improving the performance of queries by effectively using sequences and writing efficient code. These strategies can help manage how SQL Server processes and retrieves data.

Improving Performance with Sequences

Using sequences in T-SQL can significantly enhance query performance. Sequences are like auto-incrementing counters but offer more flexibility.

When a new number is needed, SQL Server provides the next value in the sequence, which helps avoid locking issues that can occur with identity columns.

To implement sequences, the CREATE SEQUENCE statement is used.

Sequences can be shared among multiple tables, making them valuable for managing unique identifiers efficiently. They are particularly useful in high-concurrency environments where controlling order and performance is crucial.

When harnessed effectively, sequences can help optimize resource use and minimize latency in query processing. They prevent table-locking issues, contributing to smoother operation within SQL Server.

Writing Efficient T-SQL Code

Writing efficient T-SQL code is essential to improve how SQL Server processes and queries data.

Careful management of NULLs allows avoidance of unnecessary computations.

Efficient index usage plays a pivotal role. Proper indexing can drastically reduce query execution time by minimizing the amount of data that needs to be scanned.

Additionally, using set-based operations instead of cursors enhances performance. Cursors process data row by row, which is often slower, while set-based operations work with entire data sets at once.

Choosing appropriate data types and avoiding unnecessary columns also contribute to more efficient code.

T-SQL Best Practices and Design Patterns

Incorporating best practices and effective design patterns in T-SQL can significantly enhance performance and maintainability. Key areas include optimizing sequences and carefully considering design aspects to improve query efficiency.

Effective Use of Sequences

Sequences in T-SQL provide a way to generate unique numeric values. They are useful for tasks that require unique identifiers.

Unlike identity columns, sequences can be accessed outside the context of a table. This flexibility allows their use across multiple tables or applications.

Configuring sequences requires attention to increment values and cycling options. For instance, specifying a suitable INCREMENT value can prevent gaps if sequence numbers are used frequently.

The CYCLE option can be applied when numbers need to start from the beginning after reaching a maximum value, which is vital for limited range scenarios.

Example Configuration:

CREATE SEQUENCE MySequence
    START WITH 1
    INCREMENT BY 1;

Sequences are not limited by table scopes, offering flexibility in design. Choosing sequences over identity columns can also prevent concurrency issues, as they are not tied to a specific table insertion.

Design Considerations for T-SQL

When designing T-SQL code, use of best practices like modularization improves readability and maintainability. Modular code allows for reusability and easier debugging.

Avoid complex queries; instead, break them down into smaller parts. Using views and stored procedures can encapsulate logic, reducing redundancy.

Indexing strategies are pivotal; proper indexing improves search speed and reduces resource usage. It’s essential to evaluate index needs based on query patterns and data distribution.

Common Design Patterns:

  • Simplicity: Limit the use of unneeded subqueries.
  • Consistency: Maintain naming conventions for tables and columns.
  • Security: Use parameterized queries to mitigate SQL injection risks.

Adopting these practices ensures robust, secure, and efficient T-SQL development, aiding in database management.

Frequently Asked Questions

A computer screen displaying a webpage with a title "Frequently Asked Questions Learning T-SQL – GUIDs and Sequences"

Learning T-SQL involves dealing with unique identifiers and sequences. It’s important to understand how to generate unique values, set primary keys, and the considerations for using GUIDs and sequences.

How can I automatically generate uniqueidentifier values in SQL Server when inserting a new row?

In SQL Server, the NEWID() function is used to generate a new GUID value when inserting a row. By setting a column’s default value to NEWID(), SQL Server will automatically fill in a unique identifier for each new row.

What steps are needed to define a primary key of type uniqueidentifier in SQL Server?

To set a primary key of type uniqueidentifier, create the table with a column of this data type. Define this column as a primary key either during table creation or by altering the table using the ALTER TABLE command.

In what scenarios should I use NEWSEQUENTIALID() over NEWID() in SQL Server?

NEWSEQUENTIALID() generates ordered GUIDs which can improve index performance compared to the random values from NEWID(). It’s useful when insert performance optimization is needed, and predictable ordering is preferred.

What are the benefits and drawbacks of using GUIDs as primary keys in SQL Server?

GUIDs offer a high level of uniqueness, making them ideal for distributed systems. However, they require more storage space than integers and can lead to slower performance and fragmentation when used in clustered indexes.

How do you implement and use sequences in T-SQL for number generation?

Sequences in T-SQL are objects that generate numeric values according to specified rules. They are created using the CREATE SEQUENCE statement and values are fetched using the NEXT VALUE FOR clause, allowing for consistent number increments across different tables or transactions.

Can you compare the performance implications of using sequences versus identity columns in T-SQL?

Sequences provide flexibility. They allow manual control over the value generation process and can be shared across multiple tables. On the other hand, identity columns are simpler. They are tied directly to a specific table but lack versatility. However, sequences may incur additional performance overhead due to this flexibility.

Categories
Uncategorized

Learning about Grid Search and How to Implement in Python: A Step-by-Step Guide

Understanding Grid Search in Machine Learning

Grid search plays a critical role in optimizing machine learning models by systematically trying different parameter combinations.

It involves hyperparameter tuning and cross-validation to find the best settings for a model.

This section explores these important concepts and contrasts grid search with random search to highlight its advantages.

Concept of Hyperparameter Tuning

Hyperparameter tuning is essential for machine learning models as it adjusts parameters that are not learned by the model itself.

Examples include learning rate and number of trees in a random forest. Unlike regular parameters, hyperparameters must be set before training begins.

The effectiveness of hyperparameter tuning is evident. It can significantly influence model performance by finding optimal parameter values.

Grid search evaluates every possible combination within a specified range, ensuring thorough exploration of options to improve results.

Grid Search Versus Random Search

Grid search tests all combinations of specified hyperparameters, making it a comprehensive strategy.

While effective, it can be time-consuming, especially for large models with many parameters. This systematic approach often yields better parameter settings but may require significant computational resources.

On the other hand, random search selects random combinations of parameters within specified distributions.

Although less thorough, it can be faster and more efficient. Research shows that random search can be quite effective, especially when only a few parameters impact model performance significantly.

The Role of Cross-Validation

Cross-validation is vital in assessing model performance during hyperparameter tuning.

It involves splitting the dataset into subsets, training the model on some while validating it on others. This process helps evaluate the stability and effectiveness of chosen hyperparameters and reduces overfitting risks.

In grid search, cross-validation ensures selected hyperparameters are consistent across different data segments.

It examines generalization ability, supporting robust hyperparameter selection. By leveraging cross-validation, grid search offers a reliable method to find parameter combinations that work well across diverse datasets.

Setting Up a Grid Search in Python

Setting up a grid search in Python involves configuring parameters to optimize machine learning models effectively.

This process includes preparing the parameter grid and using GridSearchCV from the sklearn library.

Preparing the Parameter Grid

The parameter grid is a key element in grid search that involves specifying ranges of hyperparameters.

In Python, this is typically done using a dictionary where keys represent parameter names, and values are lists of possible options. For instance, when working with a support vector machine, common parameters like C or gamma might be included.

A well-defined parameter grid can significantly impact the model’s performance. Choosing values requires a balance between a comprehensive search and computational efficiency.

Careful selection also reduces the risk of overfitting by considering only relevant parameters.

Creating the parameter grid can involve domain knowledge and experimenting with different values.

It’s important to start with key parameters and expand as needed to include others. This strategic approach streamlines the grid search process and aids in achieving optimal model configurations.

Configuring GridSearchCV in Sklearn

GridSearchCV is part of the sklearn library and is essential for carrying out the grid search process.

To use GridSearchCV, you need to import it from sklearn.model_selection. Initialize it with the estimator, parameter grid, and other settings like cross-validation folds.

For example, using GridSearchCV to tune a Random Forest model, start by providing the model and the parameter grid. You can also set cv for cross-validation and verbose to see the output of the search process. Here’s a sample setup:

from sklearn.model_selection import GridSearchCV

grid_search = GridSearchCV(estimator=model, param_grid=param_grid, cv=5, verbose=1)

Once configured, fit GridSearchCV to the training data.

This execution evaluates all parameter combinations specified and identifies the optimal set for the model. Results from GridSearchCV can be used to improve model accuracy and predictive performance, making this tool indispensable in machine learning.

Selecting Hyperparameters for Tuning

Choosing the right hyperparameters is essential for building effective machine learning models.

This process involves considering various factors like regularization, learning rates, and kernels while leveraging domain knowledge for better outcomes.

Choosing Relevant Parameters

When tuning a model, selecting which hyperparameters to adjust is crucial.

Some common hyperparameters include learning rates, regularization terms, and kernel types for algorithms like support vector machines. These parameters significantly affect how the model learns from data.

The learning rate controls how much the model’s weights are adjusted during training. A small learning rate ensures stability but can slow down training. Conversely, a large learning rate might speed up training but risk overshooting a good solution.

Regularization helps prevent overfitting by adding a penalty to the loss function. Common options include L1 and L2 regularization, which can be tuned to find the right balance for the model.

Selecting the appropriate kernel, especially in methods like support vector machines, is also critical. Linear, polynomial, and RBF (Radial Basis Function) kernels each fit different types of data patterns.

Incorporating Domain Knowledge

Incorporating domain knowledge into hyperparameter selection can enhance model performance.

Understanding the data and underlying processes helps in choosing more suitable hyperparameters, reducing the need for extensive trial and error.

For instance, in fields like finance or biology, specific trends or constraints may guide choices for regularization techniques or learning rates.

A validation set is valuable for evaluating hyperparameter configurations. This reserved dataset lets one test different settings without biasing the model towards the training data. It’s critical for assessing the generalizability of the model’s predictions.
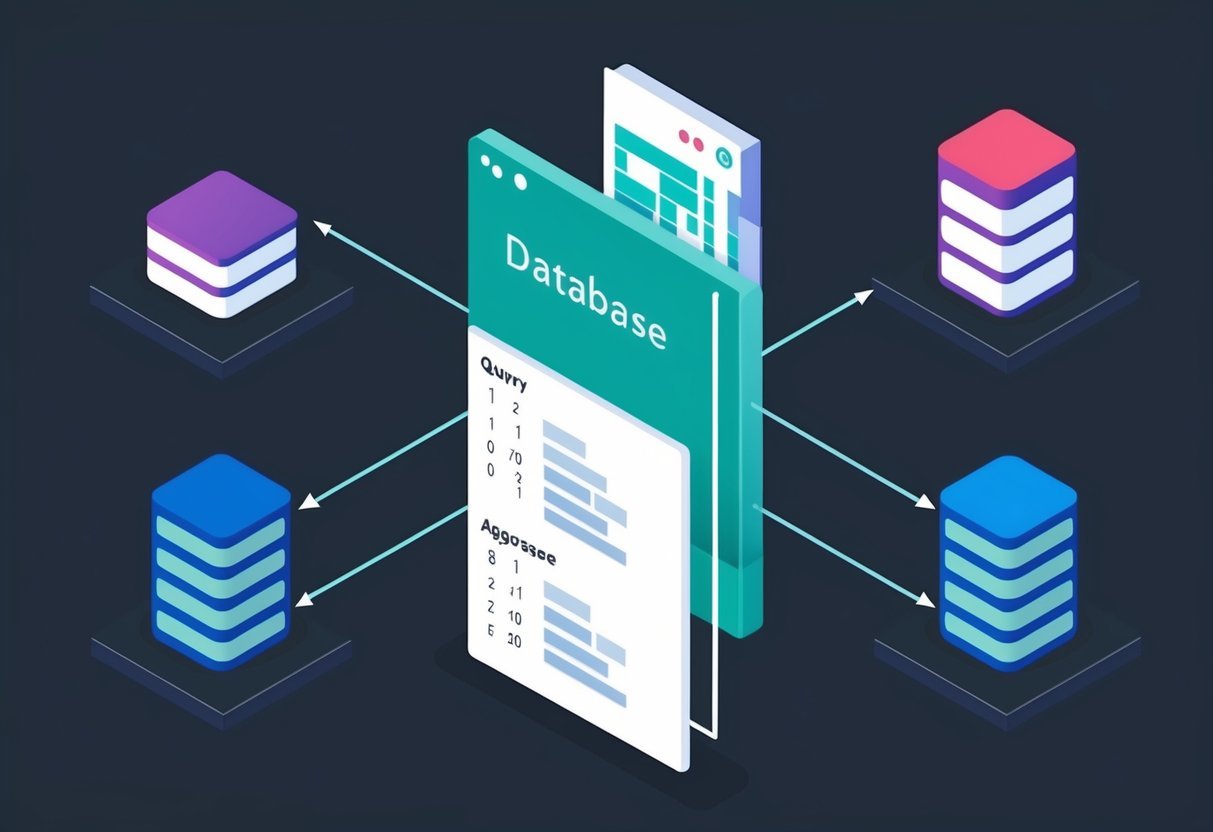
Using domain knowledge makes it possible to prioritize certain parameters over others, ensuring a concentrated effort on the most impactful areas.

This focus not only saves time but also increases the likelihood of discovering an optimal set of hyperparameters efficiently.

Implementing Grid Search on Models

Grid search is a technique used to optimize hyperparameters in machine learning models. This process involves an exhaustive search over a parameter grid to find the best model configuration for performance.

Applying to Logistic Regression

When implementing grid search on logistic regression models, the focus is on hyperparameters like penalty, C value, and solver. These parameters significantly influence the model’s ability to classify correctly.

By creating a parameter grid, each combination is tested using cross-validation. The process helps find the combination that results in the highest accuracy.

Scikit-learn provides a convenient class called GridSearchCV to automate this task.

This class requires defining the parameter grid and then applying it to the model. It performs cross-validation and returns the best parameters. This ensures models are not overfitting while maintaining high accuracy.

Grid Search in Neural Networks

For neural networks, particularly when using frameworks like Keras, grid search helps in optimizing architecture and learning parameters.

Important hyperparameters include the number of layers, the number of neurons per layer, learning rate, and activation functions.
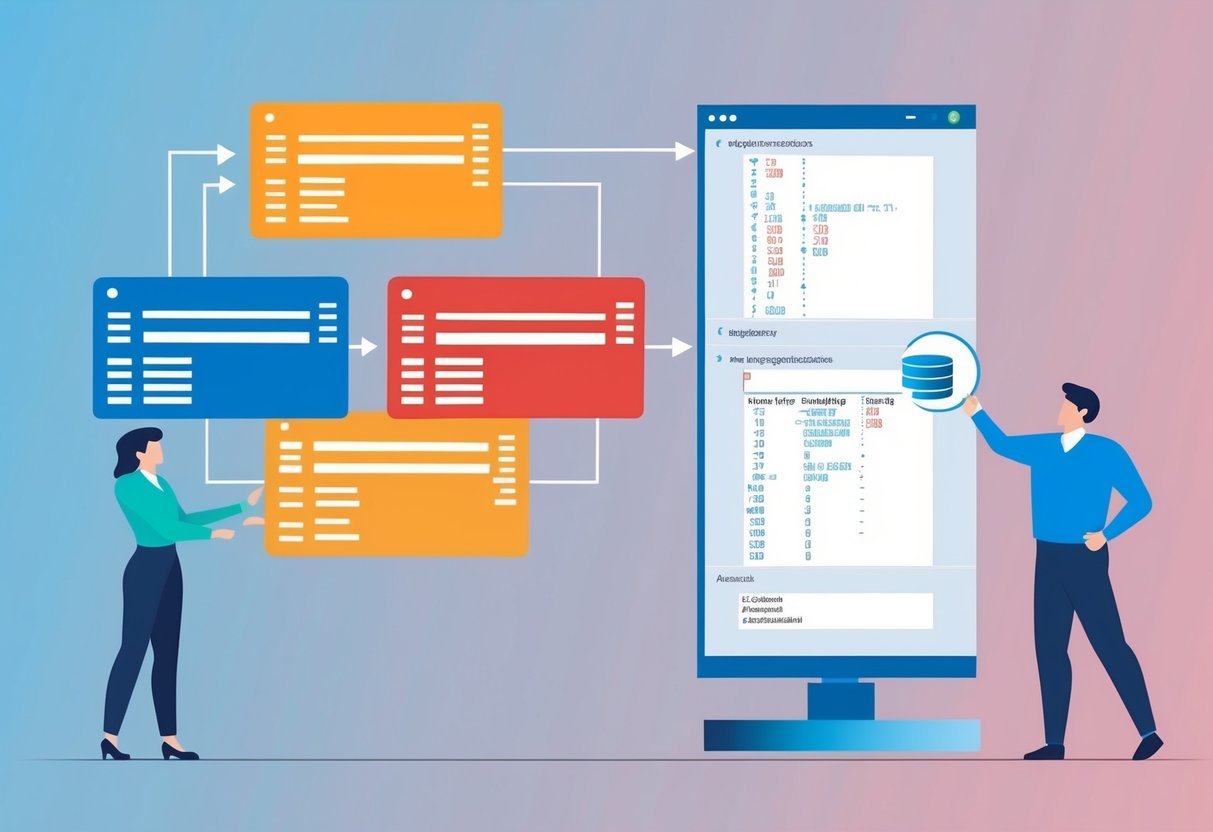
By using grid search, various combinations of these parameters can be evaluated systematically.

The goal is to achieve the best validation accuracy with optimal model capacity and training efficiency.

Integration with frameworks like Keras is straightforward, involving defining the model architecture and using tools to explore parameter spaces. This pragmatic approach allows for efficient hyperparameter tuning, resulting in better-performing deep learning models.

Analyzing Grid Search Results

Grid search is a powerful tool for hyperparameter optimization in machine learning. It helps identify the best model settings to improve accuracy and overall performance. Key elements to focus on are best_score_, best_params_, and best_estimator_, which provide insights into the effectiveness of the selected model.

Interpreting best_score_ and best_params_

The best_score_ attribute represents the highest accuracy achieved during grid search. This score is crucial because it indicates how well the model performed with the optimal hyperparameters. A high best_score_ suggests a robust model setup.

best_params_ contains the best hyperparameters found. These parameters directly affect the model’s ability to generalize from data.

For example, in a support vector machine, adjusting the C and gamma values can significantly impact results. Knowing the best_params_ helps in replicating successful model configurations.

Understanding these outputs allows data scientists to confidently tweak models for specific tasks. By focusing on best_score_ and best_params_, they gain clarity on how hyperparameter tuning affects model quality and precision.

Understanding best_estimator_

best_estimator_ refers to the actual model that achieved the highest score during the grid search process.

It combines the optimal hyperparameters with the selected machine learning algorithm. This estimator is useful for making predictions on new data as it represents the best possible version of the model obtained from the search.

In practice, using best_estimator_ ensures that the model leverages the training data effectively.

For example, applying best_estimator_ in a logistic regression model would mean it utilizes the best hyperparameters for coefficient calculation and class prediction.

By understanding best_estimator_, practitioners can confidently deploy models with expectations of high performance.

Accurate analysis and interpretation of best_estimator_ support strategic decisions in model deployment and improvement.

Data Preparation for Grid Search

Preparing data for grid search involves crucial steps like feature scaling and splitting the dataset. Feature scaling, often through tools such as StandardScaler, ensures consistency across features, while splitting separates data into training and testing sets for effective model evaluation.

Feature Scaling and Preprocessing

In grid search, feature scaling is essential. This process adjusts the range of variables, making them consistent across all features. Features often have different units or scales, which can affect model performance.

Using tools from libraries like pandas and numpy, researchers can preprocess data efficiently.

StandardScaler in Python standardizes features by removing the mean and scaling to unit variance. This is particularly important for algorithms like support vector machines and k-nearest neighbors, which rely on distances between data points.

Feature scaling ensures that each feature contributes equally to the final decision, preventing any single feature from dominating due to its scale.

Splitting Dataset into Training and Testing Sets

Splitting the dataset ensures that models are effectively trained and tested. This involves dividing data into separate training and testing sets using functions like train_test_split from sklearn. By randomly splitting the data, researchers can more accurately assess a model’s performance.

The training set is used to fit the model, while the testing set evaluates its predictive capabilities. This approach prevents overfitting, where a model performs well on training data but poorly on unseen data.

The typical split is 70-30 or 80-20, but this can vary based on dataset size and model requirements. Proper splitting is critical for developing robust models that generalize well to new data.

Avoiding Overfitting During Tuning

Overfitting occurs when a model learns the training data too well, capturing noise instead of patterns. This can lead to poor performance on new data.

During hyperparameter tuning, it’s crucial to minimize overfitting.

Cross-validation is a key technique. It involves splitting the data into multiple sets—training and validation.

By averaging the results across these sets, the model’s performance is assessed more reliably.

Using a validation set helps in estimating the model’s performance on unseen data. This set is not used for training, allowing for a genuine evaluation of the model’s ability to generalize.

A common method to reduce overfitting is adjusting the regularization parameter. This parameter adds a penalty to the model complexity, discouraging overly complex models.

In algorithms like Logistic Regression, adjusting the regularization can significantly improve generalization.

When using grid search for hyperparameter tuning, care must be taken as it can lead to overfitting by selecting parameters that perform well on the test set by chance.

Implementing strategies like cross-validation within the grid search can help address this issue.

Applying early stopping is another strategy. In algorithms like XGBoost, stopping the training process when the model’s performance on the validation set starts to decline can help prevent overfitting. Read more about this approach in the XGBoost early stopping method.

Advanced Grid Search Strategies

Advanced grid search strategies enhance hyperparameter optimization through innovative techniques. Two such strategies include genetic algorithms and adaptive parameter sampling, which can fine-tune model performance with precision.

Utilizing Genetic Algorithms

Genetic algorithms offer a novel way to improve grid search efficiency by mimicking the process of natural selection. These algorithms are part of heuristic search methods and are particularly useful in large search spaces.

The process begins with a population of candidate solutions—random sets of hyperparameters. Through operations like selection, crossover, and mutation, these solutions evolve over time. The best-performing solutions are retained and combined, similar to biological evolution.

This iterative process can explore vast possibilities with fewer computational resources than traditional grid search.

Genetic algorithms are especially valuable when dealing with complex models requiring extensive parameter tuning.

Adaptive Parameter Sampling

Adaptive parameter sampling dynamically adjusts the selection of hyperparameters based on the performance of previous trials. Unlike standard grid search, which exhaustively tries every combination in a predefined grid, adaptive sampling focuses resources on promising areas of the search space.

This method evaluates initial results and uses algorithms to guide subsequent sampling. Bayesian optimization is a common technique used here, leveraging past evaluations to predict performance and refine parameter choices.

Adaptive sampling is particularly useful in models with many hyperparameters, reducing computation time while finding optimal configurations. This strategy effectively balances exploration and exploitation, improving the efficiency of hyperparameter tuning in real-world applications.

Grid Search Computation Considerations

Grid search is a common technique for hyperparameter tuning, but it can be computationally expensive. This is because it evaluates every combination of parameters defined in the search space. The larger the space, the more time and resources it will require.

When using grid search, one must consider the potential time it may take. To reduce computation time, it is helpful to use a smaller grid. This can mean fewer parameter options, or using a subset of the data for quicker evaluations.

The parameter max_iter is important when dealing with iterative algorithms like logistic regression. Setting a reasonable value for max_iter helps control the number of iterations that these algorithms will perform, preventing them from running indefinitely.

Another consideration is selecting an efficient optimization algorithm. Some algorithms converge quicker than others, reducing the overall computational load.

It’s essential to choose an algorithm that works well with the dataset and model in question.

For a successful grid search, tools like scikit-learn’s GridSearchCV are useful. They provide functionalities such as parallel execution to further mitigate the computational expense.

In large-scale applications, it is beneficial to incorporate techniques like cross-validation within the grid search setup. This ensures that chosen parameters generalize well across different data splits, while keeping computational costs balanced.

Python Libraries Supporting Grid Search

Python offers several libraries that make implementing grid search straightforward. Sklearn is well-known for its user-friendly approach to hyperparameter tuning, while Keras is beneficial for optimizing deep learning models.

Sklearn’s Role in Grid Searching

Sklearn, also known as scikit-learn, is a popular library for machine learning in Python.

It provides the GridSearchCV class, a robust tool for hyperparameter optimization. This class automates the testing of multiple parameter combinations to find the optimal one.

By using a predefined dictionary, users can easily set which parameters to test. The function supports cross-validation, offering reliable estimates of performance.

Hyper-parameter tuning with GridSearchCV includes multiple scoring methods, making it a flexible choice.

Sklearn’s comprehensive documentation and strong community support further cement its role in enhancing grid search efficiency within machine learning models.

Leveraging Keras for Deep Learning Grid Search

Keras, known for its simplicity in designing deep learning models, also supports grid search through integration with Scikit-learn.

By pairing Keras with Scikit-learn’s GridSearchCV, users can conduct systematic hyperparameter exploration. This combo is particularly beneficial for optimizing neural network structures.

Users may adjust elements such as learning rate, batch size, and activation functions.

A custom Keras model can be defined and used within the grid search setup to iterate over various configurations. This flexibility empowers users to fine-tune their deep learning models, leading to enhanced performance as it leverages Python’s strengths in machine learning and deep learning.

Metrics and Scoring in Grid Search

In grid search, selecting the right metrics and scoring methods is important for tuning models effectively. This involves choosing the best metric for model evaluation and handling situations where the model exhibits errors during training.

Customizing the Score Method

Selecting an appropriate score method is key when using grid search. Different problems require different metrics, so it’s important to choose a score that fits the specific needs of the task.

For classification tasks, common metrics include accuracy, precision, and F1-score. These metrics help in understanding how well a model performs.

To customize the score method, the GridSearchCV function from scikit-learn allows the use of a custom scoring metric. Users can define their own score function or use predefined ones.

For instance, to use the F1-score, you would incorporate it through the make_scorer function combined with GridSearchCV. This makes the tuning process flexible and more aligned with specific project requirements.

Dealing with Error Score in Grid Search

During grid searching, errors can occur when a model is unable to fit a particular set of parameters.

Handling these errors is critical to ensure the search continues smoothly without interruptions.

Scikit-learn provides an option to manage these situations using the error_score parameter. If an error happens, this parameter will assign a score (often a default low value) to those failed fits, allowing the process to move on to other parameter sets.

Managing error scores effectively ensures that these outliers do not skew results. By setting realistic default values for error scores, grid search remains robust, providing a clear comparison between different sets of parameters. This approach helps in not discarding potentially useful parameter combinations prematurely.

Incorporating Grid Search into Machine Learning Pipelines

Grid search is a key technique for optimizing machine learning algorithms by searching for the best hyperparameters. This method can be combined seamlessly with machine learning pipelines, making it easier to automate workflows and improve model performance.

Seamless Integration with Sklearn Pipelines

Scikit-learn pipelines allow for a smooth integration of grid search, combining data preprocessing and model training steps into a single workflow.

By using pipelines, each step can be treated as an estimator, enabling easy evaluation with different hyperparameters.

For instance, in a pipeline involving an SVM classifier or logistic regression classifier, parameters like the regularization strength can be adjusted through grid search.

This ensures that each transformation and model fitting is performed consistently during k-fold cross-validation, which splits the data into k subsets for training and testing.

A pipeline might include steps such as data scaling and feature selection before model fitting. By setting it up with grid search, each combination of preprocessing and model parameters is evaluated efficiently, ensuring the best set of parameters is discovered.

Automating Workflows with Sequential Models

When using sequential models in a pipeline, grid search offers a powerful way to automate and optimize workflows.

In deep learning models, layers like dense and dropout can be tuned to enhance performance.

A sequential model might consist of several dense layers with varying numbers of neurons. Grid search can test different configurations to find the most effective layer setup.

Automating this process allows for a streamlined approach to model selection, saving time and improving accuracy.

Incorporating grid search into pipelines provides a comprehensive solution for hyperparameter tuning. By systematically evaluating each candidate configuration, this approach enhances the model’s ability to generalize well to unseen data.

Frequently Asked Questions

This section addresses how grid search can be implemented in Python for machine learning models. It covers steps for using GridSearchCV, explains hyperparameter optimization, and highlights the benefits and best practices of grid search.

How do I apply grid search in machine learning using Python?

Grid search helps find the best model parameters by testing predefined parameter combinations. It systematically works through multiple combinations of parameter values to determine which one gives the best performance. Using Python libraries like scikit-learn makes implementing grid search straightforward.

What are the steps for implementing GridSearchCV in a Python model?

To use GridSearchCV, start by importing the necessary module from scikit-learn. Define the model and a parameter grid with Python dictionaries. Use the GridSearchCV function, passing the model and the parameter grid. Finally, fit the model on the training data to complete the search.

Can you explain how grid search optimizes hyperparameters in machine learning?

Grid search optimizes hyperparameters by testing combinations of parameter values systematically. This allows one to evaluate each combination’s performance using cross-validation. By identifying which set of parameters produces the best results, grid search effectively fine-tunes the model.

What are the advantages of using grid search over other tuning methods in Python?

One advantage is its thoroughness; grid search evaluates all possible parameter combinations. This ensures the optimal parameters are not overlooked. Additionally, it’s easy to use with Python’s GridSearchCV function, making it suitable for various learning models.

How can I specify a parameter grid for use with GridSearchCV?

A parameter grid is specified using a dictionary format where keys represent parameter names and values are lists of you want to test. For instance, when specifying for logistic regression, one might include parameters like 'C' for regularization and 'solver' values.

What is the best practice for evaluating the performance of a grid search in Python?

Using cross-validation is a best practice for evaluating grid search performance. It helps to assess model performance across different subsets of data.

This approach provides a more reliable estimate of how the tuned model will perform on unseen data.

Categories
Uncategorized

Learning How to Work with APIs Through Practice in Python: A Comprehensive Guide

Understanding APIs

Application Programming Interface (API) is a set of rules and protocols. It allows different software applications to communicate with each other.

APIs define methods and data formats such that various applications can interact seamlessly.

REST (Representational State Transfer) is a popular architectural style for creating APIs. RESTful APIs use standard web protocols like HTTP to make requests.

REST is about resources, represented by URL paths that are manipulated using HTTP methods.

HTTP Methods are integral to API operations. Common methods include:

  • GET: Retrieve data
  • POST: Add data
  • PUT: Update data
  • DELETE: Remove data

These methods enable clients to interact with API resources effectively.

An API Call is like sending a request to the API. The client sends a request to an API endpoint, and the server responds with data.

This interaction usually involves sending data in JSON format, which is easy for both humans and machines to read.

In a RESTful API, endpoints often serve as access points for specific resources. For example, a URL for user data might look like https://api.example.com/users.

Understanding these endpoints and their usage is key to working effectively with APIs.

API Concepts such as authentication, endpoints, request and response, and data formats are fundamental.

Knowing how data flows in and out of an API helps in building robust applications. By grasping these concepts, developers can leverage APIs to enhance functionality and streamline operations in their projects.

The Basics of HTTP Requests

HTTP requests allow communication between a client and a server. They use various methods to perform different operations and return responses that include status codes.

Typical requests involve headers containing critical data about the request.

HTTP Request Methods

HTTP methods define the kind of operation to be performed. The GET method retrieves data from a server. It’s usually safe and doesn’t change the server state.

POST sends data to the server, like submitting a form, which can change server state.

PUT replaces existing data. It is used often in update operations.

DELETE removes specified data from the server.

Each of these methods plays a crucial role in building and interacting with APIs.

Status Codes and Responses

HTTP responses consist of status codes which indicate the result of the request.

A 200 OK status means the request was successful. When authentication fails, a 401 Unauthorized status is returned.

Server errors return a 500 Internal Server Error, indicating a problem on the server’s end.

Understanding these codes helps in identifying and troubleshooting issues during API communication.

Common HTTP Headers

HTTP headers provide essential information about an HTTP request or response. They help in content negotiation, authentication, and controlling cache behaviors.

For example, the Content-Type header shows the type of data being sent, like application/json.

The Authorization header is used for passing credentials.

They ensure requests are handled correctly by the server, enhancing security and functionality.

Setting Up Python for API Interaction

A computer screen displaying Python code with API documentation open in the background

To begin working with APIs in Python, it’s crucial to have the right tools and environment set up. This involves installing the requests library, which helps to communicate with APIs, and using virtual environments to manage dependencies effectively.

Installing Requests Library

The requests library is essential for making HTTP requests in Python. To install this library, users can use the pip package manager with the following command:

pip install requests

This library simplifies the process of sending HTTP requests and handling responses.

For anyone looking to interact with web services, understanding how to use this library is key. It provides a user-friendly way to deal with complex tasks such as sending data, managing headers, and processing response contents.

The Python API tutorial frequently emphasizes the importance of starting with this tool for anyone new to API interactions.

Understanding Virtual Environments

Virtual environments are crucial for managing project-specific dependencies effectively. They help in creating isolated spaces for different projects, ensuring that the libraries used in one project don’t interfere with another.

To create a virtual environment, one can use the venv module with this command:

python -m venv myenv

Activating the environment varies slightly depending on the operating system. On Windows, users would run myenvScriptsactivate, while on macOS and Linux, they use source myenv/bin/activate.

This setup avoids potential conflicts by keeping each project’s dependencies separate, a practice highly recommended in many Python API tutorials.

Making API Calls in Python

When working with APIs in Python, focusing on constructing the API URL, using query parameters, and handling responses is crucial. Each step provides specific guidance to ensure smooth communication with the API for retrieving data.

Constructing the API URL

The API URL is formed by combining the base URL with the endpoint. The base URL provides the starting point of the API, while the endpoint specifies the exact resource.

Understanding the structure is essential for making successful API calls.

Check the API documentation to find correct URLs and endpoints. A typical URL might look like this: https://api.example.com/data. They guide the API to retrieve data that the user requests.

It’s important to ensure that the endpoint is correctly formatted to avoid errors. These URLs often need to be constructed carefully for the API call to work.

Working with Query Parameters

Query parameters allow customization of an API request and are added to the URL to filter or specify data more precisely. They take the form of key-value pairs appended to the URL.

For example, a URL with query parameters might look like https://api.example.com/data?parameter=value. Query parameters are prefixed by a ? and separated by & for multiple parameters.

Reading through API documentation helps to find available parameters and their correct usage. This is an important part of adapting requests to get exactly the data needed from the API.

Handling API Responses

After making an API call, the API response is the data returned by the API. Responses usually come in JSON format, which is easy to work with in Python.

It’s important to check the success of the response using status codes. A successful API call generally returns a status code of 200.

After verifying the response, the JSON data can be parsed using Python’s json module. This allows the manipulation and use of the data in applications.

Efficiently handling the response ensures that data retrieval from the API is effective.

Exploring RESTful APIs with Python

RESTful APIs allow developers to interact with web services using simple HTTP requests. Python offers powerful tools to access these APIs, making data integration and retrieval easier for developers.

Understanding REST Principles

REST (Representational State Transfer) is an architectural style designed for building scalable web services. Key principles include statelessness, where each HTTP request from a client contains all the information needed to process the request, without relying on stored context on the server.

Resources in a REST API are pieces of data the API interacts with, such as users, posts, or products. These resources are accessed using URLs and often represented in formats like JSON or XML.

Understanding these principles helps developers ensure efficient communication with APIs.

Interacting with REST Endpoints

Interacting with REST endpoints involves sending HTTP requests to specified URLs.

Common HTTP methods include GET for retrieving data, POST for creating data, PUT for updating data, and DELETE for removing data. Each method works with specific endpoints to manipulate resources within a web service.

Python’s requests library simplifies these HTTP interactions.

For instance, sending a GET request to a REST API’s endpoint might look like this in Python:

import requests

response = requests.get('https://api.example.com/resource')
data = response.json()

This code snippet demonstrates fetching data from a REST API and converting the response into JSON for easier manipulation.

Using REST APIs effectively requires understanding how to construct requests and handle responses, making Python an excellent choice for this task.

Working with Python Frameworks

Python frameworks such as Flask and Django play crucial roles in developing and building APIs. These frameworks provide tools and libraries that help streamline the creation of efficient and scalable software applications.

Developing APIs with Flask

Flask is a micro-framework known for its simplicity and flexibility. It’s an excellent choice for developers who want to start small and scale up as needed.

Flask offers a lightweight core, which allows the addition of extensions to enhance functionality.

Developers appreciate Flask for its intuitive routing mechanism, which helps define API endpoints easily. The framework supports building RESTful APIs, which are commonly used in modern web development.

Documentation and community support make it a user-friendly option for beginners.

Flask is also praised for its minimalistic approach, leading to faster development cycles. Its modular design encourages a plug-and-play architecture.

By using Flask, developers can focus on writing clean and maintainable code.

Building APIs with Django

Django is a high-level framework aimed at rapid development and clean, pragmatic design. It’s often used for building larger applications due to its “batteries-included” philosophy, offering more built-in features compared to Flask.

Django REST Framework (DRF) extends Django to simplify building APIs. It provides powerful authentication, serialization, and view classes to handle HTTP requests.

The framework’s ORM (Object-Relational Mapping) simplifies database interactions, making it easy to create and manage complex databases.

Django’s admin interface is another highlight. It offers a quick way to adjust and manage models while developing APIs.

The Django community offers vast documentation and resources, making it a robust choice for those seeking to build comprehensive software applications with advanced features.

Securing API Requests

Securing API requests is crucial for protecting sensitive data and preventing unauthorized access. Key elements include utilizing API keys and managing authentication and authorization effectively.

Utilizing API Keys

API keys are essential for identifying and authenticating requests. They should be used as a part of every request to an API, typically included in the header.

When a client makes a request, the server checks the API key to ensure it’s valid and properly formatted. If valid, the server may respond with a 201 Created status, confirming the request was successful.

Careful storage of API keys is important. They should not be hardcoded within applications. Instead, use environment variables to keep them secure.

This prevents exposure and reduces the risk of unauthorized access. Additionally, API keys can be paired with rate limiting to control how often a single client can make requests, reducing the chance of abuse or attacks.

Managing Authentication and Authorization

Effective management of authentication and authorization ensures APIs are accessed only by users with the right permissions.

401 Unauthorized errors are returned when authentication is required but has failed or has not been provided.

It’s crucial to implement a strong authentication mechanism such as OAuth 2.0 or JSON Web Tokens (JWTs) for verifying user identity.

Access control can be further strengthened using Role-Based Access Control (RBAC), which restricts access based on user roles.

This minimizes security risks by ensuring users only have the permissions necessary for their role. Developers should also handle user input carefully to prevent security vulnerabilities like 400 Bad Request errors, which occur when the server cannot process the request due to client error.

Handling Data Formats

When working with APIs in Python, handling data formats is crucial.

JSON is the most common data format, making it important to understand how to manipulate it.

Additionally, knowing data serialization is key to efficiently transfer data between a server and a client.

Working with JSON Format

JSON (JavaScript Object Notation) is a lightweight data-interchange format. It’s easy to read and write for humans, and easy for machines to parse and generate.

Python’s json library makes it straightforward to handle JSON data. Using the json.loads() function, a JSON string can be converted into a Python dictionary. This enables the user to easily access and manipulate the data.

Handling complex JSON data may involve nested structures.

Accessing nested data typically requires chaining keys or using loops.

For API responses, especially those indicating 204 No Content, it’s crucial to handle cases where the JSON response is empty or minimal.

Applying error handling ensures that the program behaves gracefully on encountering unexpected formats.

Understanding Data Serialization

Data serialization is transforming data structures or object states into a format that can be easily shared or stored.

For APIs, serialization ensures data can be transmitted across networks efficiently.

Python uses libraries like json for serializing and deserializing JSON strings to and from Python objects.

This process is vital when converting data received from an API into usable Python objects or when preparing data to be sent to a server.

Serialized data maintains consistent structure and format, ensuring accurate and efficient communication between systems.

While JSON is a common serialization format, others include XML and YAML, but JSON remains preferred for its simplicity and rapid processing capabilities.

API Integration Techniques

API integration involves connecting to web services to access important data and automating tasks such as data analysis.

Mastering these techniques empowers a developer to create efficient and scalable solutions.

Connecting to Web Services

Connecting to web services through APIs begins with understanding how requests and responses work.

APIs allow applications to communicate by sending requests, which are then responded to with data. A popular way to do this is by using the REST architecture.

HTTP Methods
Common methods include:

  • GET: Retrieve data
  • POST: Send data
  • PUT: Update data
  • DELETE: Remove data

Python’s requests library simplifies making these HTTP requests. For example, the get() function is used to access web service data.

Handling authentication is crucial, often involving API keys or OAuth tokens. These are included in request headers to verify identity.

Automating Data Analysis

APIs streamline data analysis by automating the retrieval of data from various platforms.

For example, integrating with a weather API provides real-time data for climate analysis.

Python’s pandas library is effective for processing this data once retrieved.

Data Handling Steps

  1. Request Data: Automate API requests to fetch data.
  2. Load Data: Use pandas to load and organize data into DataFrames.
  3. Analyze: Perform statistical analysis or data visualization.

Automating these processes reduces time spent on manual data collection, allowing more focus on interpretation and decision-making.

This approach not only increases efficiency but also ensures the accuracy and reliability of data used in analysis.

Advanced API Features

A person coding on a computer, with multiple windows open, writing Python code to interact with an API

Learning advanced features of APIs can greatly enhance application functionality. Skills in webhooks and WebSockets are essential for building dynamic, real-time applications.

Leveraging Webhooks

Webhooks offer a way to receive updates from a service in real-time without polling. They allow a server to send HTTP POST requests to a specified URL when certain events happen.

This makes them useful for integrating services or automating workflows. Implementing webhooks requires setting up an API endpoint to capture incoming requests.

To ensure successful communication, it’s important to check API status codes. A status code of 200 indicates a successful request, while codes like 404 or 500 signal errors.

Using services like JSONPlaceholder can help test webhook configurations.

Security is crucial; use measures like token validation to protect endpoints from unauthorized access.

Working with WebSockets

WebSockets enable two-way interactive communication between a client and server, providing full-duplex communication channels over a single TCP connection.

Unlike standard HTTP requests, WebSockets maintain an open connection, allowing for instant data exchange.

This feature is particularly beneficial for real-time applications such as chat apps or live updates.

Integrating WebSockets requires configuring the server to handle connections and broadcast messages to clients.

Message formatting with JSON is common to ensure compatibility and readability.

To maintain a reliable connection, applications should handle unexpected disconnections gracefully, often by implementing a reconnection strategy.

WebSocket technology enhances the interactivity of REST APIs, making them more dynamic in nature.

This allows developers to build applications that are more responsive to real-time data changes.

Practical API Usage Examples

APIs allow users to interact with various online services, like accessing real-time weather updates or tracking the prices of stocks. This section provides insight into their practical applications and demonstrates how to use APIs effectively in Python.

Fetching Weather Data

Fetching weather data is a common use case for APIs. Users can access real-time updates by using weather APIs, which offer data like current temperature, humidity, and forecasts.

To start, one might utilize the OpenWeatherMap API, which provides weather updates globally.

In Python, developers can use the requests library to make HTTP requests to the API.

After obtaining an API key, a user can easily send a request to the weather server to receive data in JSON format.

This information can then be parsed into a Python-readable form and utilized in applications or for data analysis.

Monitoring Stock Prices

Monitoring stock prices with APIs can aid in making informed investment decisions. Many services provide stock data, such as Alpha Vantage, which delivers real-time updates on stock prices.

Using the requests library, developers can fetch the stock price of companies like “IBM” by making API calls and checking the status of these requests.

Once the data is retrieved, it is often converted into a Python dictionary, making it easier to consume and analyze the data.

Python’s ability to handle large amounts of numerical data efficiently is an advantage when dealing with stock price information.

By accessing stock APIs, one can automate the tracking and analysis of stock prices.

APIs and Emerging Technologies

APIs are crucial in integrating Internet of Things devices and enhancing Artificial Intelligence development. They enable seamless communication and data exchange, forming the backbone of many smart technologies.

APIs in Internet of Things (IoT)

IoT devices, such as smart thermostats or fitness trackers, rely heavily on APIs for connectivity and functionality.

APIs facilitate data exchange between devices and central systems, enabling efficient communication.

This exchange is often done through RESTful APIs, allowing diverse devices to interact flexibly, though SOAP is sometimes used for more formal needs.

Understanding how API interaction works in IoT is essential.

Developers often use Python’s urllib to work with APIs, sending GET and POST requests to retrieve or update data.

These operations ensure that IoT systems can function as intended, adding significant value to everyday technology.

APIs and Artificial Intelligence

In Artificial Intelligence, APIs make it possible for machine learning models to be accessible and usable across platforms.

This is done through frameworks that wrap models into REST APIs using Python.

These APIs enable AI applications to interact with web services effectively, processing data seamlessly.

APIs support various functions, such as handling DELETE requests for data management or integrating AI into other applications.

By leveraging APIs, developers can embed AI capabilities into existing software, making it more intelligent and responsive.

This integration offers endless possibilities in enhancing productivity and user experience without altering the underlying programming language.

Frequently Asked Questions

A computer screen displaying Python code interacting with an API, surrounded by open books and notes

Learning to work with APIs in Python involves understanding how to connect, fetch data, and manage authentication. This section provides insights into resources, tools, and examples to help simplify the process.

What are some good resources for learning to interact with APIs in Python?

Websites like GeeksforGeeks offer tutorials on how to use APIs with Python.

Platforms like DataCamp provide courses that cover building and using APIs, which can be beneficial for developers.

How do you fetch data from an API using Python?

Using libraries like requests, developers can send HTTP requests to APIs and retrieve data.

This involves making GET requests to the API’s URL and handling the response, often in JSON format, which can be parsed in Python.

What are the steps to write an API with Python?

To write an API, developers often use frameworks like Flask or Django.

The process includes defining routes, handling requests, and delivering responses.

Developers also need to manage data transformation and ensure security through authentication methods.

Can you provide an example of authenticating with an API in Python?

Authentication often involves using API keys or tokens.

For instance, incorporating APIs might require headers with keys in requests made using the requests library.

Proper storage and usage of keys ensure secure communication.

What libraries in Python are commonly used for working with APIs?

Common libraries include requests for handling HTTP requests and Flask or Django for building APIs.

These tools provide structures for making and responding to requests, enabling developers to manage data efficiently.

Where can I find practical tutorials for building APIs in Python?

Practical guides can be found on platforms like Apidog Blog and Medium.

These sites offer step-by-step instructions on integrating and using various APIs, providing context through real-world examples.

Categories
Uncategorized

Machine Learning – Classification: Support Vector Machines Explained

Basics of Support Vector Machines

Support Vector Machines (SVM) are powerful tools in machine learning for classification tasks. They are known for their ability to handle high-dimensional data and their use in various applications, from image recognition to bioinformatics.

Definition of SVM

A Support Vector Machine is a type of supervised learning model used for classification and regression. Its main idea is to find a hyperplane that best separates data points into different classes.

The SVM aims to maximize the margin between the classes, which is the distance between the closest data points to the hyperplane from each class. These closest points are called support vectors.

Using kernel functions, an SVM can handle both linear and non-linear classification tasks, making it versatile in its applications. SVMs are also robust against overfitting, especially in cases with high-dimensional input space, because they focus on the points that are the most difficult to classify.

History and Evolution

The concept of SVMs emerged from statistical learning theory, initially developed by Vladimir Vapnik and Alexey Chervonenkis in the 1960s. Their work laid the foundation for contemporary machine learning models.

The SVM gained popularity in the 1990s when it was further refined and adopted for practical machine learning tasks. Over the years, advancements included the development of kernel methods, which allow the SVM to classify data that is not linearly separable.

Today, SVMs are widely used in various fields, such as text classification and image recognition, due to their accuracy and efficiency. They continue to evolve with ongoing research, leading to new variations and enhancements like support vector regression and one-class SVM for outlier detection.

Mathematical Foundations

Support Vector Machines (SVMs) are built on several important mathematical concepts that help them classify data effectively. These include the use of vectors and hyperplanes to separate data points, defining the margin that separates classes, and optimizing this separation using techniques like convex optimization and hinge loss.

Vectors and Hyperplanes

In SVMs, data points are represented as vectors in a multidimensional space. A hyperplane is a flat affine subspace that divides the space into two half-spaces.

In classification tasks, the goal is to find the optimal hyperplane that separates different classes of data.

For a simple example, consider a 2D space where the hyperplane is a line. In higher dimensions, this line becomes a plane or hyperplane. The equation of a hyperplane can be written as w · x + b = 0, where w is the weight vector, and b is the bias.

Margin and Support Vectors

The margin is the distance between the hyperplane and the closest data points from each class. SVMs aim to maximize this margin to create a robust classifier.

The larger the margin, the lower the chance of misclassification.

Support vectors are the data points that lie on the boundary of the margin. These points are critical as they define the position and orientation of the hyperplane. Therefore, even small changes or movements in these points can shift the hyperplane.

Convex Optimization and Hinge Loss

SVMs use convex optimization to find the best hyperplane. Convex optimization ensures that there is a global minimum, making the problem solvable efficiently. The optimization problem is generally formulated as a quadratic programming problem.

To ensure accurate classification, SVMs often employ hinge loss, which is used to penalize misclassifications.

The hinge loss function is defined as max(0, 1 – y(w · x + b)), where y is the class label. This function is advantageous for its simplicity and ability to differentiate between correct and incorrect classifications efficiently.

SVM Classification and Regression

Support Vector Machines (SVM) are used in machine learning for both classification and regression tasks. They can handle linear and non-linear data by using a technique known as the kernel trick. This section explores their application in binary classification, multi-class classification, and support vector regression.

Binary Classification

In binary classification, SVMs are designed to separate data into two distinct classes. The main goal is to find the optimal hyperplane that maximizes the margin between the classes.

This is achieved by using support vectors, which are the data points closest to the hyperplane, ensuring the highest accuracy.

The hyperplane is determined by solving an optimization problem that focuses on minimizing classification errors while maximizing margin width. Binary classification with SVMs is effective in various applications such as email filtering and image recognition.

Multi-class Classification

Multi-class classification extends the binary approach to handle multiple classes. The most common methods are one-vs-one and one-vs-all strategies.

In one-vs-one, SVMs are trained to distinguish between every pair of classes, while in one-vs-all, an SVM is trained for each class against all other classes.

These strategies allow SVMs to perform well in situations where the data have more than two categories. Although computationally more demanding, SVMs are widely used in areas like document classification and handwriting recognition because of their precision and reliability.

Support Vector Regression

Support Vector Regression (SVR) adapts SVM for regression problems, which involve predicting a continuous output variable. Unlike SVM in classification, SVR seeks to fit the best line within a margin of tolerance, aiming to minimize the error within the specified threshold.

SVR uses a similar optimization process but focuses on finding a function that deviates from actual values within the allowable margin. This makes SVR suitable for financial forecasting and real estate valuation, where predicting continuous values precisely is crucial.

Kernel Methods in SVM

Kernel methods in Support Vector Machines (SVMs) allow the algorithm to solve non-linear classification problems efficiently. By using kernel functions, SVMs transform data into a higher-dimensional space where it becomes easier to separate with a hyperplane.

Understanding the Kernel Trick

The kernel trick is a key concept in SVMs that enables the transformation of data. Instead of calculating coordinates directly, the trick uses kernel functions to compute the inner products in this new space.

This is computationally efficient and allows SVMs to perform in high-dimensional spaces without explicitly computing the coordinates, thereby saving on both memory and computation time.

The kernel trick supports SVM’s flexibility in handling complex data distributions. It effectively manages features’ interactions, allowing SVMs to generalize better to unseen data.

Types of SVM Kernels

SVMs commonly use several types of kernels, each suited to different kinds of data.

  1. Linear Kernel: Ideal for linearly separable data. It is straightforward and computationally cheap.

  2. Polynomial Kernel: Extends linear models to account for interactions among features. The polynomial degree controls the flexibility, allowing SVMs to capture relationships of varying complexity.

  3. Radial Basis Function (RBF) Kernel: Popular due to its ability to model intricate patterns. It maps points into an infinite-dimensional space, providing a high degree of flexibility.

SVM users select these kernels based on the problem’s requirements, ensuring that the model fits the data well.

Custom Kernels

Beyond standard kernels, custom kernels can be designed to handle specific types of data or domain-specific problems. These kernels are tailored to incorporate unique properties of the data that standard kernels might miss.

By using domain knowledge, practitioners define custom kernels to emphasize relevant features while suppressing noise. This results in more accurate and efficient models. Custom kernels provide the flexibility to adapt SVMs for specialized tasks and enhance performance beyond the capabilities of generic kernels.

Feature Space and Dimensionality

A colorful 3D graph with multiple data points, showing the separation of classes using a hyperplane in a support vector machine

Understanding feature space and dimensionality is key to effective classification using support vector machines (SVMs). These elements determine how data is represented and processed and can significantly impact the accuracy of the classification model.

Working with High-Dimensional Spaces

In many applications, the feature space can be high-dimensional, meaning that it includes a vast number of features or variables. This is common in fields like neuroimaging, where data often involves many variables.

High-dimensional spaces allow SVMs to separate data more easily because they offer more flexibility in how data points can be arranged. However, having too many dimensions can introduce challenges, like the curse of dimensionality.

This issue can make it harder to find patterns because the data becomes sparse.

Regularization techniques are often used to manage high-dimensional spaces by reducing their complexity while maintaining model performance. This helps prevent overfitting, where the model performs well on training data but poorly on new data.

Selecting important features through dimension reduction can also improve model accuracy and efficiency in classifying data.

Feature Transformation

The transformation of features into a new space can significantly enhance the performance of SVMs. By mapping data into a higher-dimensional feature space, SVMs can find a hyperplane that separates classes more effectively.

Techniques like kernel functions are essential in this process, allowing SVMs to perform well even when the feature space is initially non-linear.

Kernel functions, such as polynomial or radial basis function (RBF) kernels, enable this transformation without explicitly computing in high dimensions. This results in efficient computation while maintaining the ability to handle complex data structures.

The transformation ensures that the data becomes more linearly separable, which is crucial for the SVM to perform accurate classification.

Careful choice and application of these transformations lead to improved performance and more accurate predictions in a variety of classification tasks.

Regularization and Overfitting

Regularization helps control overfitting by making adjustments to the learning process. Overfitting occurs when a model performs well on training data but poorly on new data. Regularization aims to improve the model’s ability to generalize its findings. This section explores how regularization is applied through the soft margin method and the role of the C parameter.

Understanding Regularization

In machine learning, regularization is a technique used to prevent overfitting by adding a penalty to the loss function. This penalty discourages extreme values in model parameters, which can make the model fit too closely to the training data.

By adjusting these parameters, the model learns to balance fitting the training data with maintaining the ability to perform well on unseen data.

Regularization methods include L1 (Lasso) and L2 (Ridge) regularization. L1 regularization can lead to sparse models by eliminating some coefficients, while L2 regularization shrinks the coefficients but retains them all.

The choice between L1 and L2 depends on the specific needs of the model and the nature of the data. Different types of problems may benefit from one method over the other.

Soft Margin and C Parameter

The soft margin concept in support vector machines introduces the idea of allowing some misclassifications to achieve better overall model performance. This is crucial for non-linearly separable data where a perfect separation might not be possible.

Instead of forcing a strict decision boundary, soft margins allow for some flexibility.

The C parameter is a regularization parameter that controls the trade-off between achieving a low error on the training data and maintaining a simpler decision boundary.

A high value of C prioritizes low training errors, potentially leading to overfitting. Conversely, a low value may increase the training error but lead to better generalization. Adjusting this parameter helps find the right balance for accurate predictions.

Implementing SVM with Python Libraries

Support Vector Machines (SVM) are powerful tools in machine learning used for classification tasks. Python libraries provide efficient ways to implement SVM, making it accessible for various applications. This section explores how to use Scikit-learn’s SVM modules and techniques for parameter tuning and optimization.

Scikit-learn’s SVM Modules

Scikit-learn is a popular Python library that offers accessible tools for implementing SVM.

The SVC module is widely used for creating SVM classifiers. It provides flexibility with parameters like kernel.

The kernel parameter can be set to linear, polynomial, or RBF, depending on the data’s nature.

Using sklearn, one can declare an SVM model using a few lines of code:

from sklearn.svm import SVC
model = SVC(kernel='linear')

Scikit-learn also supports various pre-processing and validation techniques, ensuring your SVM model is well-rounded.

The library integrates seamlessly with other data processing tools, allowing users to build a comprehensive machine learning pipeline efficiently.

Parameter Tuning and Optimization

Parameter tuning is critical in improving the performance of an SVM model. In Scikit-learn, this is often achieved using techniques like grid search and cross-validation.

Grid search allows for the exploration of different parameter combinations, while cross-validation tests the model’s accuracy on various data splits.

For example, using GridSearchCV in Scikit-learn:

from sklearn.model_selection import GridSearchCV
parameters = {'kernel':('linear', 'rbf'), 'C':[1, 10]}
svc = SVC()
grid_search = GridSearchCV(svc, parameters)
grid_search.fit(X_train, y_train)

Adjusting parameters such as C and the kernel type can significantly impact the classification results. Effective parameter tuning ensures that the SVM model generalizes well and maintains high accuracy across unseen data.

Model Evaluation and Parameter Tuning

Evaluating models and fine-tuning parameters are crucial steps in maximizing the performance of Support Vector Machines (SVM). These processes ensure models are both accurate and efficient, leading to better classification results.

Cross-Validation Techniques

Cross-validation is an essential method used to evaluate the performance of SVMs. It involves dividing the dataset into training and testing subsets.

The goal is to measure how well the model generalizes to new data.

K-fold cross-validation is a popular approach where the dataset is split into k equal parts. The model trains on k-1 parts and tests on the remaining part, rotating these parts until every subset is used as a test set.

This technique helps in identifying potential overfitting. Overfitting occurs when a model learns the training data too well, including noise, making it perform poorly on new data.

Strategies like stratified k-fold cross-validation further ensure that each subset is a good representative of the whole dataset by maintaining the class distribution.

Hyperparameter Optimization

Hyperparameters significantly influence SVM performance. These parameters include the kernel type, regularization parameter (C), and kernel-specific parameters such as the degree for polynomial kernels.

Choosing the right hyperparameters involves optimization techniques.

Grid search is a common method where a predefined range of parameters is tested to find the best combination. This exhaustive search can be computationally expensive but provides precise results.

Alternatively, random search randomly selects parameter combinations, offering a more efficient exploration of the parameter space with less computational cost.

Both methods rely on cross-validation to evaluate each combination, ensuring that the best hyperparameters not only fit the training data but also perform well on unseen data.

Practical Applications of SVM

Support Vector Machines (SVM) are powerful tools for various practical applications, especially in classification tasks. This section explores SVM’s applications in text classification, image and face detection, as well as biological and medical fields.

Text Classification

SVMs are highly effective for text classification tasks. This includes activities like spam detection and topic categorization. They work well with high-dimensional data, such as text, due to their ability to find optimal boundaries between classes.

In spam detection, SVMs help identify whether an email is spam or not by using a trained model that examines word patterns and their frequency. Outlier detection is another area where SVMs are applied to find abnormal data points that do not fit the usual patterns.

Image and Face Detection

In image analysis, SVMs are often used for image categorization and face detection tasks. They can classify images by learning from image data features and distinguishing between different objects or categories.

Face detection is a crucial application where SVMs excel by identifying and classifying facial structures effectively. They play a significant role in security and personal identification systems, making it easier to manage and verify identities efficiently.

Biological and Medical Applications

SVMs have important applications in the biological and medical fields. They are used for gene expression analysis, which involves classifying genes based on their contribution to various conditions.

These machines can also assist in diagnosing diseases by analyzing medical images or patient data to predict health outcomes. SVMs are essential in developing personalized medicine approaches by classifying patients based on their genetic data, leading to more effective treatments. Their ability to handle complex and vast datasets makes them suitable for these sensitive and critical applications.

Advanced Topics in SVM

Support Vector Machines (SVM) can tackle challenging problems using advanced techniques. This section explores SVM’s capabilities in non-linear classification and handling noisy and imbalanced data.

Non-linear Classification

SVMs can handle non-linear classification using kernel methods. Kernels allow SVMs to create a flexible decision boundary by transforming the data into a higher-dimensional space.

Common kernels include polynomial, radial basis function (RBF), and sigmoid. These kernels enable the SVM to find a hyperplane that can effectively separate data points that are not linearly separable in their original space.

In non-linear separation, choosing the correct kernel and its parameters is crucial. The RBF kernel is very popular due to its ability to fit complex data patterns. However, using a kernel function that is overly complex can lead to overfitting. Therefore, careful parameter tuning and cross-validation are necessary to balance the model’s complexity.

Working with Noisy and Imbalanced Data

Handling noisy data is another challenge SVMs can address using techniques like regularization. Regularization helps prevent overfitting by adding a penalty for large coefficients in the model.

C-SVM and ν-SVM are variations that incorporate such penalties. This technique aids in maintaining the model’s robustness against noise.

For imbalanced data, SVMs can use methods such as cost-sensitive learning. By assigning different weights to classes, the SVM can focus more on the minority class.

Strategies like resampling or synthetic data generation (e.g., SMOTE) are also effective. These methods adjust the training data to create a more balanced dataset, improving the model’s ability to recognize less frequent classes.

Comparative Analysis

SVMs are a popular choice in machine learning. This section compares SVM with other algorithms and discusses linear versus nonlinear SVM.

SVM vs. Other Machine Learning Algorithms

SVMs are known for their effectiveness in high-dimensional spaces and their use of a hyperplane to separate data into classes. They can outperform algorithms like logistic regression in handling datasets with clear margins.

Logistic regression, another machine learning algorithm, models binary outcomes based on a linear predictor function. While logistic regression works well for linearly separable data, SVMs have the edge in complex data with nonlinear relationships.

Misclassification is an important aspect to consider. SVMs aim to minimize this by finding a decision boundary with maximum margin. This makes them robust against overfitting, especially in high-dimensional space. Decision trees, in contrast, might struggle with variance in noisy data.

Linear SVM vs. Nonlinear SVM

Linear SVM is best suited for linear classification tasks. It identifies the hyperplane that separates data into distinct classes. This type is ideal when data can be divided with a straight line.

Nonlinear SVM uses kernel tricks to transform data into higher dimensions, making it capable of handling more intricate patterns. This flexibility allows handling data that isn’t linearly separable.

The choice between linear and nonlinear comes down to the nature of the data. Linear SVM is efficient and less computationally demanding. Nonlinear SVM, while more powerful in certain scenarios, requires more resources. Proper selection ensures better model performance and resource use.

Frequently Asked Questions

Support Vector Machines (SVMs) are a powerful tool for classification. This section answers common questions about SVMs, including their core principles, advantages, and use cases.

What are the core principles behind Support Vector Machines in classification tasks?

Support Vector Machines focus on finding the best hyperplane that separates classes in the data. The idea is to maximize the margin between data points of different classes. This leads to better classification by ensuring that future data points can be classified with confidence.

How does kernel selection affect the performance of a Support Vector Machine?

Kernel selection can greatly impact SVM performance. It determines how the input data is transformed into the required format. Choices like linear, polynomial, or radial basis function kernels can allow SVMs to handle different kinds of data patterns, ultimately affecting accuracy and efficiency.

What are the advantages of using Support Vector Machines for classification over other algorithms?

Support Vector Machines often excel at classification tasks with high-dimensional spaces. They are effective even when the number of dimensions is greater than the number of samples. SVMs also offer robust performance due to their margin maximization strategy, which reduces the risk of overfitting.

In what scenarios is a Support Vector Machine preferable for classification tasks?

SVMs are particularly useful in scenarios where data needs clear boundaries between classes. They are often chosen when the dataset is high-dimensional or when the relationships within the data are complex and non-linear. Their effectiveness shines in scenarios requiring heightened accuracy.

Can Support Vector Machines be effectively used for multi-class classification, and if so, how?

Yes, SVMs can handle multi-class classification through methods like “one-vs-one” or “one-vs-all.” These techniques involve breaking down a multi-class problem into multiple binary classifications, which the SVM can manage more effectively given its inherent binary nature.

What are some common methods for optimizing the parameters of a Support Vector Machine?

Common parameter optimization techniques include grid search and cross-validation.

Grid search systematically evaluates combinations of parameters to find the best settings. Meanwhile, cross-validation helps in assessing how the results of a model will generalize to an independent dataset. These approaches help in tuning SVMs for better performance.

Categories
Uncategorized

Azure Data Studio Diagram: A Comprehensive Guide to Visual Database Design

Understanding Azure Data Studio

Azure Data Studio offers a range of features that make it a versatile tool for data professionals. It supports multiple operating systems, including Windows, Linux, and macOS.

Users can benefit from its capabilities in database development and management, with an emphasis on ease of use and integration with other tools.

Overview of Features

Azure Data Studio provides several key features tailored for database administrators and developers. It supports various SQL-based workloads while offering a modern and efficient coding environment.

The software comes equipped with IntelliSense, helping users write queries more effectively. Built-in features like dashboards and customizable extensions enhance productivity and user experience, making it a valuable asset for managing large volumes of data.

Users can benefit from its ability to support multiple database connections, facilitating the management of different databases simultaneously. Its cross-platform capability allows users to operate seamlessly on Windows, Linux, and macOS.

This flexibility makes Azure Data Studio a reliable choice for professionals looking to optimize their data management processes. Extensions further enhance functionality, with several available to add specific features or improve performance.

Navigating the Object Explorer

The Object Explorer in Azure Data Studio is a pivotal tool for managing database components. It provides a hierarchical view of database objects, allowing users to efficiently browse through tables, views, procedures, and more.

This feature simplifies database management tasks by providing a clear and organized view of the data structure.

Users can interact directly with database objects through the Object Explorer, enabling them to perform tasks such as editing tables or running queries with ease. The interface supports custom filtering, which helps in focusing on specific objects of interest.

Intuitive design ensures that users can quickly access necessary information without navigating through complex menus.

Code Snippets and Source Control Integration

Azure Data Studio enhances productivity with code snippets, which allow users to quickly insert frequently used code blocks. This feature reduces typing overhead and ensures consistency across different scripts.

Users can create custom snippets tailored to their specific coding patterns, further streamlining the development process.

Source control integration, such as with Git, provides robust version management for scripts and projects. This integration helps users track changes, maintain version history, and collaborate with team members effectively.

Source control tools are accessible within the interface, enabling easier management of repositories alongside database development work.

Integrated Terminal Usage

The integrated terminal in Azure Data Studio offers seamless command-line access. Users can switch between coding and executing terminal commands without leaving the application.

This integration supports various terminals, like Bash on Linux and macOS, and PowerShell on Windows, catering to diverse user preferences.

This terminal feature proves valuable for executing administrative tasks, such as database backups, directly from within Azure Data Studio.

Advanced users benefit from scripting capabilities within the integrated terminal, which enhances overall efficiency by reducing the need to switch between different applications while performing complex data operations.

Working with Database Diagrams in Azure Data Studio

Azure Data Studio provides tools to create and edit database diagrams effectively. Users can visualize relationships between tables, making database design more intuitive. The platform supports creating new diagrams and modifying existing databases to fit evolving needs.

Creating Database Diagrams

To start with Azure Data Studio, users can easily create database diagrams. After launching the application and connecting to a SQL Server instance, they should navigate to the Object Explorer pane, choose the desired database, and start a new query window.

While Azure Data Studio doesn’t inherently support schema diagramming, users can explore external tools like DBeaver, which offers a View Diagram feature for databases.

Creating these diagrams often involves understanding the entities and relationships within the database—commonly referred to as ER diagrams. These graphical representations help in ensuring that tables are linked correctly and that data constraints are maintained across tables.

Editing and Modifying Tables

Azure Data Studio allows modifications to existing tables to ensure the database scheme remains adaptable to changes. Users can edit tables directly within the SQL query editor to add, remove, or modify columns as necessary.

These updates facilitate the evolving data requirements and dynamics of modern applications.

The use of keyboard shortcuts such as Ctrl+N for new entities and Ctrl+Z to undo changes can streamline the editing process. This ease of use plays a crucial role in making sure that database modifications are executed smoothly without disrupting existing services.

Visualizing Table Relationships

Visualizing table relationships is crucial in database design to ensure integrity and functionality. While Azure Data Studio might not support advanced visualization natively, it provides foundational tools for basic insights.

Users can understand connections by analyzing foreign keys and dependencies between tables.

For comprehensive visualization, external plugins or tools like DBeaver can be integrated. These options allow users to view detailed relationship maps that depict the entire database structure, making it easier to optimize and maintain healthy database systems.

Such visual tools contribute significantly to clear data modeling and ER diagram refinement.

Managing SQL Schemas and Data

In Azure Data Studio, effective management of SQL schemas and data involves aspects like executing SQL queries, visualizing schema structures, and establishing best practices for handling sample data. These components are crucial for ensuring database integrity, performance, and ease of use.

Executing SQL Queries

Azure Data Studio provides a robust environment for executing SQL queries, which allows users to interact directly with their database. Users can write and run queries to retrieve or manipulate data using familiar T-SQL syntax. The query editor in Azure Data Studio supports key features such as syntax highlighting, smart IntelliSense, and code snippets, helping to streamline the process.

Save frequently used queries in the editor for quick access. It’s also possible to format queries for better readability and organize results into tables, making it easier to interpret the data.

Configurable connection options ensure secure and efficient execution of queries across different environments.

Schema Visualization and Management

Schema visualization is an essential feature that provides a graphical view of database structures. Using Azure Data Studio, users can visually represent tables, relationships, indexes, and constraints through schema diagrams. This capability enhances the understanding of complex database relationships.

To get started, create or open a database instance in Azure Data Studio. Use tools for designing and managing schemas effectively.

Schema changes can be made directly within the tool, including adding new tables, modifying columns, or updating relationships.

For more detailed guidance, users can explore resources on schema visualization in Azure Data Studio.

Sample Data and Best Practices

Working with sample data is critical when developing or testing database applications. Azure Data Studio allows you to manage sample data efficiently, helping to simulate real-world scenarios.

Incorporate best practices, such as backing up data before making changes and using transaction controls to maintain data integrity.

It’s important to validate changes with sample datasets before applying them to production environments. Incorporate various data types, constraints, and indexes when working with samples to reflect true operational scenarios.

Adopting these best practices ensures seamless transitions from development to production, minimizing errors and optimizing data management.

Database Objects and Design Concepts

A diagram in Azure Data Studio depicting database objects and design concepts

Database design involves structuring databases efficiently. This requires careful consideration of keys and relationships, choosing appropriate data types for columns, and implementing indexes and constraints to optimize performance.

Understanding Keys and Relationships

Keys are fundamental to database design. They ensure data integrity and create links between tables. A primary key uniquely identifies each record within a table. Usually, it is a single column but can be a combination of columns.

Relationships establish how tables relate. These are often built using foreign keys, which reference a primary key in another table. This setup helps maintain consistent data and facilitates complex queries.

In Azure Data Studio, using the interface to visualize relationships can help users understand how different tables are interlinked.

Defining Columns and Data Types

Choosing the correct data types for columns is crucial. Data types determine what kind of data can be stored. Common types include integers, decimals, and strings such as nvarchar, which stores variable-length text.

The design of columns should reflect their purpose. For example, a date of birth column should use a date type, while a column for names might use nvarchar.

Properly defined columns not only enhance efficiency but also prevent potential errors during data entry.

Implementing Indexes and Constraints

Indexes are used to improve query speed. They allow quicker data retrieval by creating an ordered structure based on one or several columns. While powerful, too many indexes can lead to slower write operations.

Constraints enforce rules on data in tables. Examples include unique constraints that ensure all values in a column are different and check constraints that validate the data based on specific conditions.

These features help maintain data integrity by preventing invalid data entries.

Efficiently implementing indexes and constraints in Azure Data Studio requires understanding their impact on performance and storage. Adding the right constraints ensures data remains consistent and reliable without adverse effects on the overall system efficiency.

Generating Entity-Relationship Diagrams

An open laptop displaying an Entity-Relationship Diagram in Azure Data Studio, with various tables and connections

Creating Entity-Relationship (ER) Diagrams in Azure Data Studio helps visualize the structure of databases. These diagrams illustrate tables, columns, and relationships, making it easier to manage and document databases effectively.

Generate ER Diagrams from Existing Databases

To start generating ER diagrams in Azure Data Studio, users can connect to their existing databases. After connecting, they can select specific tables or entities they want to include. This helps in understanding how different database elements interconnect.

Tools like the Schema Visualization plugin assist in this process by providing visual insights into database structures.

Users can configure the plugin to highlight key relationships and attributes. This enables data analysts to detect potential design issues before implementing changes.

Users interested in learning more about using this plugin can find a detailed guide on how to generate an ER diagram in Azure Data Studio.

Documenting Database Structures

ER diagrams play a vital role in documenting relational databases. They graphically represent entities, attributes, and their interconnections, which aids in maintaining clear documentation.

This visual documentation is crucial for onboarding new team members and collaborating with others.

Creating these diagrams ensures that the database structure is well-documented, enhancing communication among team members. They serve as a reference point during database development, providing clarity on complex relationships.

Users can create and maintain these diagrams using tools available in Azure Data Studio, making them an integral part of database management practices. Learn more about the benefits of documenting databases with ER diagrams at Creating Schema Diagrams in Azure Data Studio.

Azure Data Studio and SQL Server Integration

An open laptop displaying Azure Data Studio with a connected SQL Server Integration Services diagram on the screen

Azure Data Studio offers seamless integration with SQL Server, making it a versatile tool for database management and development tasks. Users can efficiently connect to, manage, and migrate SQL Server databases, enhancing their workflow and productivity.

Connecting to Various SQL Server Types

Azure Data Studio supports a range of SQL Server types, providing flexibility for users. It connects to traditional SQL Server instances, Azure SQL Database, and Azure SQL Managed Instance. This allows users to manage on-premises and cloud-based databases with ease.

The integration includes features like a customizable dashboard and rich T-SQL editing capabilities.

Compatibility with the Analytics Platform System (APS) further enhances its utility in more complex environments. Users have the ability to connect and manage workloads across different platforms.

The tool is designed to support professionals in diverse database scenarios, making it an excellent choice for those using various SQL Server types in their operations.

Migrating from SSMS to Azure Data Studio

Transitioning from SQL Server Management Studio (SSMS) to Azure Data Studio can be a straightforward process for most users. Azure Data Studio’s interface is user-friendly and offers extensions that enhance functionality, like the SQL Server Import extension, allowing for smooth data migration.

Many features familiar to SSMS users are present, such as query editor tools and integrated terminal support.

The inclusion of SQL Server Migration Extensions simplifies moving databases from SSMS, easing the adaptation process.

By supporting core SQL Server functions, Azure Data Studio reduces the learning curve for users migrating from SSMS, making it a valuable tool for those looking to modernize their database management setup. With community support growing, users can find ample resources for troubleshooting and optimizing their workflows in this environment.

Frequently Asked Questions

A person using Azure Data Studio, surrounded by FAQ documents and diagrams

Azure Data Studio offers various tools for visualizing and managing database schemas.

Users can create ER diagrams, compare schemas, and manage databases with ease.

How can I generate an ER diagram using Azure Data Studio?

To generate an ER diagram, launch Azure Data Studio and open your database.

Use available tools and extensions, if any, to visualize the database structure.

Is there an extension for database diagram visualizations in Azure Data Studio?

Azure Data Studio supports extensions that may assist in database visualization.

Check the extensions marketplace for relevant tools that enhance diagram creation.

What are the steps to visualize a database schema in Azure Data Studio?

Begin by opening Azure Data Studio.

Navigate to your database, and use the schema diagram feature to view relationships between tables.

Specific steps vary based on the version and installed extensions.

Can Azure Data Studio be used for schema comparison, and how?

Azure Data Studio can be used for schema comparison with the right tools.

Look for extensions that allow this feature, enabling side-by-side schema analysis.

How to create and manage a new database within Azure Data Studio on a Mac?

On a Mac, open Azure Data Studio and use the built-in tools to create a new database.

Follow prompts to set up tables and schema as needed.

What methods are available for viewing a table diagram in Azure Data Studio similar to SQL Server Management Studio?

In contrast to SQL Server Management Studio, Azure Data Studio does not offer native support for table diagrams.

External tools such as DBeaver may be used for this purpose to visualize diagrams effectively.

Categories
Uncategorized

Learning About Complex Topics, Like Python Decorators: A Clear Guide

Understanding Python Decorators

Python decorators are a key concept in programming that allows functions or methods to be modified without changing their code structure. This tool is used in Python to wrap additional functionality around a function.

Decorators provide a clear and simple syntax that makes code easier to manage. They can alter the behavior of the function they wrap by using the @decorator_name syntax.

A common use of decorators is in function logging. For instance, one can create a decorator to log every time a function is called. This adds an easy way to track function executions.

Another application is in enforcing access control. By wrapping functions with decorators, developers can manage permissions or restrict access to certain users.

Example of a Simple Decorator

def my_decorator(func):
    def wrapper():
        print("Before calling the function")
        func()
        print("After calling the function")
    return wrapper

@my_decorator
def say_hello():
    print("Hello!")

say_hello()

In this example, my_decorator wraps the say_hello function, adding print statements before and after its execution.

Benefits of Python Decorators

  • Code Reusability: Encapsulate repetitive logic in decorators.
  • Separation of Concerns: Keeps core logic and additional functionality separate.
  • Readability and Maintenance: With decorators, code becomes cleaner and easier to maintain.

Fundamental Concepts of Decorators

Decorators in Python are a powerful feature that allows the modification of functions or methods. They enable adjustments to be made without altering the actual code structure. This flexibility is crucial for maintaining clean and readable code.

In Python, functions are treated as first-class objects. This means they can be passed around like any other object. You can pass functions as arguments, return them from other functions, and assign them to variables.

A decorator is essentially a callable that takes a callable as input and returns another callable. This pattern is useful for adding functionality to existing code. A simple decorator can enhance or modify behavior without changing the original function code.

Example:

def my_decorator(func):
    def wrapper():
        print("Something is happening before the function is called.")
        func()
        print("Something is happening after the function is called.")
    return wrapper

@my_decorator
def say_hello():
    print("Hello!")

say_hello()

In this example, my_decorator is a function wrapper that wraps around say_hello. The wrapper function contains additional code to execute before and after the main function, modifying its behavior.

Decorators can also be used with classes. Decorating a class method allows for modifying the behavior of all instances of the class. This is particularly helpful for tasks like logging, access control, and measuring execution time.

Decorator Syntax and Creation

Understanding Python decorators involves knowing their syntax and how to create them effectively. This section breaks down a simple implementation and shows how to use the decorator syntax for added functionality in Python code.

Defining a Simple Decorator

Creating a basic Python decorator involves defining a function that wraps another function. The decorator adds behavior without altering the original function’s code. Here’s a simple example of a decorator:

def my_decorator_func(func):
    def wrapper_func():
        print("Something is happening before the function is called.")
        func()
        print("Something is happening after the function is called.")
    return wrapper_func

In this example, my_decorator_func is the decorator. It takes a function func as an argument and returns wrapper_func, which includes additional behavior.

Applying Decorator Syntax

Using decorator syntax, known as syntactic sugar, simplifies the process of applying decorators to functions. By using the @decorator_name notation, you can apply the decorator directly to any function. Here’s how it works:

@my_decorator_func
def say_hello():
    print("Hello!")

say_hello()

In this code, the say_hello function is decorated with @my_decorator_func. When say_hello is called, it runs the code in wrapper_func, adding extra functionality around the original say_hello logic. This syntax is concise and makes the code more readable.

Advanced Decorator Use Cases

Advanced decorators in Python allow more nuanced control and enhancement of functions, making them very useful in tackling specific programming challenges. From modifying function behavior using arguments to applying multiple decorators and enhancing classes, advanced decorators offer diverse capabilities.

Decorators with Arguments

Decorators can be defined to accept their own set of arguments, providing even greater flexibility. This allows customization of the decorator’s behavior based on specific needs. For instance, a logging decorator might take a log level as an argument. By using an inner function, decorators can manage both the arguments they receive and the function they modify.

Consider a scenario where a timer decorator tracks function execution time. By taking an additional argument for a time threshold, the decorator could notify when the function exceeds expected limits. This approach makes decorators more dynamic and applicable to a variety of situations.

Chaining Multiple Decorators

Applying multiple decorators to a single function can create a powerful stack of behaviors. This technique involves placing several decorators above a single function definition. Each decorator wraps additional functionality around the function, enhancing or altering its behavior step by step.

For example, one might use a caching decorator alongside a logging decorator. The caching decorator could improve performance by storing results of expensive function calls, while the logging decorator could track each function invocation for monitoring. It’s essential to understand the order of execution, as decorators are applied from the innermost to the outermost.

Decorating Classes and Methods

Decorators can also be used effectively with classes, providing enhancements to methods or class behaviors. Using decorators like @classmethod and @staticmethod, functions within a class can be declared that either don’t require a class instance or belong to the class itself. This makes the design cleaner and reduces boilerplate code.

For classes, advanced decorator techniques can apply configurations, validations, or transformations to class objects. This can be particularly useful for ensuring that all class instances meet certain criteria or for managing shared state across instances. This approach opens up new possibilities for structuring class-based applications.

Enhancing Functionality with Decorators

Decorators in Python are a useful tool for adding or modifying functionality in code. They allow developers to apply additional behaviors to functions or classes without altering their original code. This makes decorators a flexible design pattern that can improve software development.

One common use of decorators is in caching. By applying a caching decorator to a function, it can remember the results of expensive operations, avoiding redundant calculations. This makes the program run faster and more efficiently.

Testing becomes simpler with decorators too. You can create decorators that automatically log function calls, track runtime, or handle exceptions. This automated tracking streamlines the debugging process and helps ensure the code behaves as expected.

Writing a decorator function involves defining a function that takes another function as an argument. Inside, you typically define an inner function that wraps or extends the behavior of the original function. This pattern allows for a clean separation of concerns.

Here’s a basic example of a simple decorator:

def my_decorator(func):
    def wrapper():
        print("Before function call")
        func()
        print("After function call")
    return wrapper

@my_decorator
def say_hello():
    print("Hello!")

say_hello()

In this example, each time say_hello is called, the decorator prints a message before and after the function execution. Decorators provide a straightforward way to expand or adjust function behaviors dynamically and elegantly, contributing to better-organized and more readable code.

Decorator Libraries and Tools

A stack of books on Python, surrounded by various coding tools and decorative elements

Python decorators help enhance functions or classes without altering their core. Understanding how to use decorator libraries can simplify complex tasks and improve code readability. This part explores key tools and techniques related to decorators.

Utilizing functools.wraps

The functools.wraps is crucial for maintaining metadata when using decorators in Python. It is part of the functools module and helps keep a decorator from obscuring the identity of the function it decorates. By using functools.wraps, the decorated function retains its original name, docstring, and other metadata. This is important for debugging and documentation.

To apply functools.wraps, simply import it and use it as a decorator inside your custom decorator. This ensures the original function’s attributes remain intact while the decorator logic is applied. Implementing best practices involving functools.wraps leads to more maintainable and clearer code. For those interested in a deep dive into decorator functionality, the Real Python guide offers comprehensive insights into using decorators and functools.wraps.

Decorators in Web Development

Decorators play a crucial role in enhancing functions in web development. They are especially notable in frameworks like Flask and Django, where they streamline adding functionality to web pages.

Flask and Django Decorators

In Flask, decorators are essential for creating routes. When a user visits a URL, a particular view function is executed. The decorator @app.route('/example') links the function below it to a specific URL path. This makes it easy and clean to handle various routes in a web application, allowing developers to manage how requests are processed.

Django also uses decorators extensively. They manage access control and improve the security of an application. The decorator @login_required checks if a user is authenticated before accessing a view. This helps in maintaining security by restricting access to certain parts of the site only to logged-in users. Django decorators provide a simple way to apply common patterns across many functions. Developers can easily extend functionality without altering the core code structure.

Performance Considerations and Optimization

A person studying a book on Python decorators with various optimization and performance considerations written on a whiteboard

Improving performance is a crucial part of working with Python. Using decorators effectively can significantly enhance code efficiency.

A timer decorator is a practical tool. It measures the time a function takes to execute, allowing developers to understand and optimize elapsed time.

For example, a timer decorator can be applied to assess performance by logging the execution duration of a function. This informs developers about potential bottlenecks.

Implementing caching is another optimization strategy. Caching saves the results of expensive function calls and reuses them when the same inputs occur. This reduces redundant computations and enhances overall efficiency.

Python’s built-in libraries offer essential tools for improving performance. For data-heavy tasks, leveraging libraries like NumPy and Pandas leads to significant optimization.

Besides, consider the use of tools like Cython. It allows Python code to be compiled into C extensions, enhancing performance. More information on this technique can be found in the section on advanced techniques for code optimization.

Developers should keep performance implications in mind when implementing decorators. Mastering Python decorators can refactor code efficiently and boost performance.

It is crucial to continuously test and profile code, using debuggers, to identify slow parts. This ensures that the implemented solutions are not only effective but also enhance the overall performance.

Best Practices for Decorators in Python

Decorators in Python can improve code efficiency and readability when used correctly. To ensure maintainable code, follow these best practices.

Keep It Simple
Decorators should be clear and concise. Avoid adding too much logic. Focus on their main purpose: to modify or enhance functions or methods.

Use Descriptive Names
Choose names that clearly describe what the decorator does. This helps in understanding and maintaining the codebase.

Document Decorators
Add comments and docstrings. Explain what the decorator does, any arguments it takes, and its expected behavior. This helps others understand its purpose.

Leverage Built-in Decorators
Python offers built-in decorators like @staticmethod and @classmethod. Use these when applicable to simplify code and maintain readability.

Test Thoroughly
Test decorators individually. Ensure they work with different inputs and handle edge cases gracefully. Testing increases confidence in code robustness.

Maintain Function Signature
Use functools.wraps to maintain the original function’s signature and docstring. This aids in debugging and makes the wrapped function behave more like the original.

Chain Decorators Carefully
When using multiple decorators, be mindful of their order. The order can affect the behavior, so test to ensure they interact as expected.

Common Decorator Patterns in Python Programming

Decorators are a powerful feature in Python programming. They allow functions to extend or modify the behavior of other functions or methods. This is especially useful in both basic and advanced Python levels, where code reusability and readability are important.

Function decorators are the most common type. They wrap another function and can add functionality before or after the original function runs.

For example, the @staticmethod and @classmethod decorators are used to define methods within a class that aren’t tied to an instance.

In advanced Python programming, decorators can be used as a design pattern. They enhance a function or method without changing its structure. This pattern is helpful in managing cross-cutting concerns such as logging or authentication. The Python Decorators guide from GeeksforGeeks explains how to add new functionality to classes and functions.

Decorator Examples

  • @property: This is used to customize access to instance variables. It allows methods to be accessed like attributes, increasing encapsulation.

  • @name.setter: Often paired with @property, it sets the value of a property. More details can be found in this discussion of built-in decorators.

  • @jit: Found in libraries like numba, the @jit decorator compiles a Python function to machine code, optimizing performance. Learn more about how decorators optimize functions in Stack Overflow’s explanation.

Using decorators effectively can significantly enhance Python programming by providing elegant solutions to complex coding problems.

Integrating Decorators with Other Python Concepts

A python snake entwined with various programming symbols and concepts

Python decorators can enhance the flexibility and efficiency of your code, especially when used with other core features like iterators, generators, and functional programming techniques. These integrations help create more modular, reusable, and readable code structures.

Iterators, Generators, and Decorators

Decorators can work seamlessly with iterators and generators to improve code structure. Iterators enable you to traverse through elements in a collection, while generators simplify creating iterators using the yield statement. Combining these with decorators allows for managing state and side-effects in a cleaner way.

For example, decorators can wrap around generator functions to add logging functionality or handle exceptions consistently. This makes tracking the execution of loops much simpler.

Functions like @wraps from the functools library can help maintain properties like name and documentation of generators, ensuring that debugging and testing become more straightforward.

Using decorators, developers can write concise code that handles complex operations. This is especially useful in recursion, where decorators can introduce optimization features, such as memoization, enhancing performance.

Functional Programming with Decorators

Functional programming concepts align well with decorators, as both aim to create simple, reusable functions. Decorators can transform ordinary Python functions to adopt functional programming techniques like map, filter, and reduce.

One common use is optimizing recursive functions. For instance, decorators can add memoization to a function, storing results of expensive calls and returning cached results when the same inputs occur again.

Additionally, they can introduce logging or timing features to these functions without altering the core logic.

Decorators support the principles of functional programming by enabling functions to be first-class citizens that can be passed, returned, and assigned. This allows for more flexible and adaptable designs, especially in complex Python applications that benefit from functional paradigms and object-oriented (OOP) approaches.

Exploring the Future of Decorators

The future of Python decorators looks promising, especially with the rise of artificial intelligence and its impact on coding practices. Decorators can play a vital role in optimizing source code for AI applications, making them run more efficiently.

Enhancements in data analysis tools also benefit from decorators. By adding functionality without modifying existing structures, decorators help create cleaner pipelines. This is essential for handling large datasets and ensuring robust analyses.

Monkey patching, while not recommended as a best practice, may see interesting alternatives through the use of decorators. Instead of directly altering existing code, developers could use decorators to achieve similar results without the usual side effects.

Interactive coding platforms might incorporate interactive quiz elements using decorators. These can enhance learning by allowing real-time code modifications, helping users understand complex concepts more intuitively.

In summary, decorators hold potential for future advancements across many areas. They offer a flexible way to build and enhance applications, making them a valuable tool for developers looking to explore new possibilities.

Frequently Asked Questions

Python decorators are a versatile tool that allows developers to add functionality to existing functions or classes without altering their structure. They play a significant role in efficient code management and can be quite powerful when used correctly. Understanding their syntax and application is crucial for developers working with Python.

How do you use decorators in Python to modify function behavior?

Decorators provide a way to wrap a function in another function. When a decorator is applied, it returns a new function with added behavior. This process lets developers add features like logging or access control without changing the original function code.

What is the role of the ‘@’ symbol in defining a decorator?

The ‘@’ symbol is used to apply a decorator to a function. Placing it above a function declaration, it signals that the following function is to be passed through the decorator. For example, using @my_decorator before a function name applies my_decorator to that function.

In what scenarios should you use class decorators in Python?

Class decorators are ideal for managing or modifying classes. They can be used to apply behavior changes to instances of classes or to ensure certain properties across class instances. They provide benefits similar to function decorators but focus specifically on classes and their behavior.

How can decorators with arguments be implemented in Python?

Decorators can accept arguments by defining an outer function that receives these arguments. Inside, define the actual decorator function. This structure allows you to customize the decorator’s behavior depending on the arguments passed, offering more flexibility in modifying function operations.

What are the best practices for nesting decorators in Python?

When nesting decorators, it’s crucial to ensure they are applied in the correct order. The innermost decorator is applied first, followed by the next one, and so on. Clarity in decorator design and documentation can help manage complexity when nesting multiple decorators.

What distinctions exist between decorators and regular functions?

Decorators alter the behavior of functions or methods while keeping their interface the same. Regular functions, on the other hand, execute specified tasks.

The key difference is that decorators wrap or enhance other functions with additional behavior, maintaining separation of concerns and enhancing modularity.

Categories
Uncategorized

Using SQL Data Manipulation for Machine Learning Models: A Comprehensive Guide

In the world of data science, data manipulation is a crucial step that can often dictate the success of machine learning models.

SQL, a powerful tool for managing and querying large datasets, plays a vital role in this process.

Using SQL for data manipulation allows data scientists to prepare and clean data effectively, ultimately enhancing the accuracy and performance of machine learning models.

A computer screen with lines of code, a database diagram, and a machine learning model chart displayed on a desk

Data manipulation with SQL helps in transforming raw data into a suitable format for machine learning. By efficiently handling missing values and inconsistencies, SQL ensures that the dataset is ready for analysis.

This preparation is essential for developing robust machine learning models, as clean data often leads to better predictions and insights.

Integrating machine learning with SQL databases also enables the execution of complex queries and algorithms without leaving the database environment.

This seamless integration not only makes data processing easier but also allows for scalable and efficient model deployment.

Leveraging SQL for machine learning tasks offers a practical approach for data scientists aiming to build effective prediction models.

Key Takeaways

  • SQL streamlines data preparation for machine learning models.
  • Data manipulation in SQL improves model accuracy.
  • Integrating SQL with machine learning boosts efficiency.

Understanding SQL in Machine Learning

SQL plays a crucial role in managing and manipulating data used in machine learning.

By leveraging SQL databases, data scientists can efficiently prepare and process data, which is essential for training robust machine learning models.

Comparing SQL and NoSQL helps identify the right tools for data analysis in specific scenarios.

Role of SQL Databases in Machine Learning

SQL databases are foundational in many machine learning workflows. They provide reliable storage and retrieval of structured data, which is often necessary for training models.

SQL enables users to execute complex queries to extract relevant datasets quickly. This capability is vital during the data preparation phase, where data is cleaned and transformed.

In addition to querying, SQL is used to maintain data integrity with constraints such as primary keys and foreign keys. This ensures that the data used for model training is both accurate and consistent.

As machine learning grows, tools that integrate SQL with popular programming languages help streamline the process.

SQL vs. NoSQL for Data Science

In data science, choosing between SQL and NoSQL depends on the data type and use case.

SQL databases excel in scenarios where data is highly structured and relationships between entities must be maintained. They offer powerful querying capabilities, essential for tasks that require in-depth data analysis.

Conversely, NoSQL databases are suited for handling unstructured or semi-structured data, such as social media posts. They provide flexibility and scalability, useful for big data applications.

However, SQL remains a preferred choice when consistency and structured querying are priorities in machine learning projects.

Data Processing and Manipulation Techniques

A computer screen displaying SQL queries and data manipulation techniques for machine learning models

Effective data processing is crucial for machine learning models. Cleaning and preparation help remove errors, while feature engineering enhances model precision. Transformation and normalization ensure that the data format supports accurate analysis.

Data Cleaning and Preparation

Data cleaning is a foundational step in preparing data for machine learning. It involves identifying and correcting errors or inconsistencies in the dataset.

Handling missing values is paramount; strategies such as imputation or removal are often used.

Outlier detection is another essential aspect, where anomalous data points may be adjusted or removed to prevent skewed results.

Duplicate entry removal helps maintain data integrity.

Data preprocessing, including these tasks, ensures that the data is ready for analysis.

Feature Engineering and Selection

Feature engineering involves creating new input variables based on existing data. This can enhance the performance of machine learning models.

It’s crucial to identify which features will contribute the most to model accuracy by using feature selection techniques.

Dimensionality reduction methods, such as PCA (Principal Component Analysis), help in reducing the number of input variables while preserving the essential information. This streamlines machine learning tasks by focusing on the most influential data aspects.

Data Transformation and Normalization

Data transformation converts data into a suitable format for analysis.

Common techniques include log transformation, which helps manage skewed data distributions, and scaling methods such as min-max scaling, which standardizes the feature range.

Normalization adjusts data distributions to make algorithms work more efficiently. Z-score normalization is one approach that scales data based on standard deviation.

These methods ensure that different data attributes contribute evenly to the model’s training process.

SQL Techniques for Data Analytics

SQL is a powerful tool used in data analytics for structuring data queries and achieving efficient data manipulation. This involves techniques like grouping data, using window functions, and handling complex queries to draw insights from data.

Aggregate Functions and Grouping Data

One essential aspect of data analytics is using aggregate functions.

These functions, such as SUM(), AVG(), COUNT(), MIN(), and MAX(), help summarize large datasets.

By employing the GROUP BY clause, SQL enables grouping records that have identical data in specific fields. This is crucial when evaluating trends or comparing different data categories.

The HAVING clause often follows GROUP BY to filter groups based on aggregate conditions. For instance, selecting categories with a sales total exceeding a threshold.

In a SELECT statement, these functions streamline data for focused analysis, not only enhancing efficiency but providing clear and measurable outcomes.

Window Functions and Subqueries

Window functions are vital for analyzing data across rows related to the current row within data partitions. Unlike typical aggregate functions, they do not collapse rows into a single one.

Examples include ROW_NUMBER() and RANK(), which are used for ranking and numbering data more flexibly within the context of its data set or segments.

Subqueries are another powerful tool, allowing for nested queries within larger queries. They help break down complex calculations or selections into manageable steps, executing preliminary queries to guide the main query.

This technique ensures that the resulting SQL query remains organized and readable.

Pivoting Data and Handling Complex Queries

Pivoting transforms data from rows to columns, making it easier to interpret and compare. This is especially useful when restructuring data for reporting purposes.

The PIVOT operator in SQL is a common way to achieve this, though different databases may require specific syntax or additional steps.

Dealing with complex queries often involves advanced SQL techniques like joining multiple tables or using conditional statements.

Mastery of handling these intricacies, including outer and cross joins, ensures that complex data sets are queried and manipulated effectively, leading to more insightful analytics.

These capabilities are crucial for anyone looking to fully leverage SQL in data-driven environments.

SQL for Machine Learning Model Development

A computer screen displaying SQL code, with data tables and machine learning algorithms in the background

Using SQL in machine learning allows for efficient handling of data directly within databases. It aids in preparing training data and manipulating large datasets seamlessly, often integrating with tools like Python and R to enhance model development.

Preparing Training Data with SQL

SQL is an essential tool for managing training data for machine learning projects. It enables the extraction and cleaning of large datasets, making it easier to perform operations like filtering, aggregating, and joining tables. This process is crucial for creating a robust dataset for model training.

When preparing data, SQL can handle tasks such as managing missing values by using functions like COALESCE() or creating new columns for feature engineering.

For instance, SQL commands can quickly scale up to handle larger datasets by performing operations directly on the server, reducing the time needed to prepare data for machine learning algorithms.

SQL’s ability to seamlessly integrate with programming languages like Python and R further empowers data scientists.

By feeding clean, structured data directly into machine learning pipelines, SQL streamlines the entire process of model development.

Building and Refining Machine Learning Models

Once the data is ready, building machine learning models involves training algorithms on this data.

SQL supports certain analytics functions that can be used directly within the database. Platforms like PostgreSQL enable executing multiple machine learning algorithms in SQL queries, which simplifies the process.

For more complex tasks, SQL can work alongside libraries in Python to develop models.

Python libraries like Pandas are often paired with SQL to refine models, leveraging SQL for data selection and preliminary processing before executing Python-based machine learning code.

The refinement of models through SQL involves iteration and optimization, often requiring adjustments to the dataset or its features to achieve improved accuracy and performance.

By using SQL efficiently, developers can focus on enhancing model accuracy without getting bogged down by manual data handling.

Machine Learning Algorithms and SQL

SQL is used with machine learning by enabling data manipulation and analysis within databases. Various machine learning algorithms, such as clustering and regression, can be implemented directly in SQL environments, allowing for efficient data processing and model building.

Cluster Analysis and Classification

Clustering involves grouping data points based on similarities. The k-means clustering algorithm is often used in SQL for this purpose. It helps identify patterns and segments within the data without predefined categories.

Classification, on the other hand, involves assigning data points into predefined categories based on features and is common in various applications like customer segmentation.

In SQL, classification models can be executed to sort data into these categories effectively. Tools like SQL Server Machine Learning Services integrate Python and R scripts, which enhance the ability to perform both clustering and classification tasks.

This integration streamlines processes, making data management simple and efficient.

Regression Analysis

Regression analysis aims to predict continuous outcomes. Linear regression is a popular method used to find relationships between variables.

In SQL, regression algorithms can be applied to forecast trends and make predictions directly within databases. This avoids the need for external analysis tools, leading to faster insights.

By leveraging stored procedures or SQL-based libraries, professionals can automate regression tasks. This not only saves time but also ensures consistency in predictive modeling.

Such capabilities are crucial for industries that rely heavily on data-driven decisions.

Advanced Algorithms for Structured Data

Structured data benefits greatly from advanced algorithms implemented in SQL.

With SQL, deep learning models and neural networks can work directly within a database environment. Though most deep learning and neural network tasks are traditionally handled outside of SQL, newer technologies and extensions are bringing them closer to SQL databases.

For example, the dask-sql library supports machine learning tasks, allowing for complex computations directly in SQL.

This integration facilitates tasks such as feature engineering and model deployment, which are critical steps in developing robust machine learning models.

By bridging the gap between complex algorithms and SQL, professionals can achieve greater efficiency and precision in data analysis.

Utilizing Programming Frameworks and Libraries

A programmer typing code to manipulate SQL data for machine learning models using programming frameworks and libraries

Using programming frameworks and libraries optimizes data manipulation and machine learning model development. This section highlights key libraries in Python and R for data analysis and integration with SQL for machine learning frameworks.

Python and R Libraries for Data Analysis

Python and R are popular languages for data analysis.

Python is known for its extensive libraries like Pandas and Scikit-learn. Pandas makes manipulating large datasets easy with features for reading, filtering, and transforming data. Scikit-learn offers a simple interface for implementing machine learning algorithms, making it ideal for beginners and experts alike.

R is another powerful language used in statistics and data analysis. It offers libraries like dplyr for data manipulation and caret for machine learning. These libraries provide tools to process data and support predictive modeling.

Both languages enable data professionals to manage datasets effectively and prepare them for machine learning applications.

Integrating SQL with Machine Learning Frameworks

SQL databases can store and manage large datasets for machine learning. Integration with frameworks like TensorFlow enhances performance by allowing direct data queries.

SQL supports quick data retrieval, essential when training models as it reduces loading times.

For instance, PostgresML can integrate with pre-trained models to streamline workflows. Moreover, accessing data through SQL queries ensures models are trained on recent and relevant data.

Using SQL with machine learning frameworks bridges the gap between data storage and analysis.

It allows for seamless transitions from data retrieval to model training, optimizing efficiency. This integration suits data scientists aiming to improve their model-building process.

Data Mining and Predictive Analytics

Data mining and predictive analytics use statistical techniques and algorithms to analyze historical data, identify patterns, and make predictions.

This section focuses on specific applications like anomaly detection, sentiment analysis, recommendation systems, and collaborative filtering.

Anomaly Detection and Sentiment Analysis

Anomaly detection is about finding unusual patterns in data, which can indicate errors or fraud.

It’s crucial in fields like finance and cybersecurity, where early detection of anomalies can prevent significant losses.

Machine learning models help flag data points that deviate from expected patterns.

Sentiment analysis examines text data to understand emotions and opinions. It is widely used in marketing and customer service to gauge public sentiment.

For instance, analyzing social media posts can help predict brand perception. Machine learning algorithms process language data to classify these emotions effectively, aiding businesses in decision-making.

Recommendation Systems and Collaborative Filtering

Recommendation systems suggest items to users based on past preferences. They are vital in e-commerce and streaming services to enhance user experience.

These systems predict a user’s liking for items by analyzing past behavior.

Collaborative filtering improves this by using data from multiple users to recommend items. This approach matches users with similar tastes, predicting preferences even for unknown items.

For example, if a user liked certain movies, the system predicts they might enjoy similar movies that others with similar interests have liked.

This data-driven approach offers personalized recommendations, enhancing user satisfaction.

Performance Metrics and Model Evaluation

A computer screen displaying SQL queries and machine learning model evaluation metrics

Performance metrics and model evaluation are essential in ensuring the accuracy and effectiveness of machine learning models. These metrics help highlight model strengths and areas needing improvement, supporting data-driven decisions.

SQL plays a crucial role in refining data for these evaluations.

Cross-Validation and Performance Metrics

Cross-validation is a method used to assess how a model will perform on unseen data.

This process involves splitting the dataset into several subsets and training the model on each subset while testing on the others. This method helps in detecting issues like overfitting.

Common performance metrics include accuracy, precision, recall, F1-score, and mean squared error, depending on the problem type.

Accuracy measures the proportion of correct predictions. Precision and recall are crucial for models where the cost of false positives or negatives is high.

The F1-score balances precision and recall when both are important. For regression tasks, mean squared error gives insights into prediction errors by averaging squared differences between predicted and actual values.

Iterative Model Improvement and SQL

Iterative model improvement involves making systematic tweaks based on metric outcomes.

SQL can be pivotal in this process, especially when handling large datasets. By writing efficient SQL queries, one can aggregate, filter, and transform data to create cleaner input for models, ultimately enhancing performance.

SQL server tools can optimize data manipulation tasks, ensuring faster and more efficient data handling.

For instance, creating indexed views or using partitioning can significantly speed up data retrieval, aiding iterative model refinement. Using SQL, models can be recalibrated quickly by integrating feedback from ongoing evaluations, ensuring they remain sharp and applicable to real-world scenarios.

SQL Operations for Maintaining Machine Learning Systems

A computer screen displaying SQL queries and data manipulation for machine learning models

In maintaining machine learning systems, SQL plays a crucial role in handling data and streamlining processes. Key operations involve managing data entries and maintaining databases through various SQL commands and stored procedures.

Managing Data with Insert, Delete, and Update Statements

To efficiently handle data, SQL environments rely on Insert, Delete, and Update statements.

The Insert Into command adds new records to existing tables, ensuring that datasets are continually updated with relevant information. Meanwhile, the Delete Statement helps in removing outdated or irrelevant data, keeping the datasets clean and precise for model training.

Lastly, the Update Statement modifies existing records based on new findings, ensuring that data remains relevant and useful for ongoing machine learning processes. These operations allow for better data accuracy and accessibility within the system.

Database Maintenance and Stored Procedures

Stored Procedures support effective database maintenance by automating routine tasks. In SQL environments, these procedures are pre-written SQL codes that can execute complex operations efficiently. They handle tasks like data validation and routine updates, reducing the workload on data administrators.

Moreover, the use of user-defined functions in conjunction with stored procedures enhances customization options, allowing unique data manipulations that cater to specific model needs.

A well-maintained database through these means not only ensures data integrity but also boosts overall system performance, facilitating smoother machine learning model maintenance.

Best Practices and Advanced SQL Techniques

A computer screen displaying complex SQL queries and data manipulation for machine learning models

Advanced SQL techniques can greatly enhance the performance and security of machine learning models. Effective use of SQL ensures efficient data processing, robust security, and optimal resource management.

Securing Data and Implementing Access Control

Securing data is essential in SQL-based systems. Implementing access control ensures only authorized personnel have access to sensitive information.

Role-based access control (RBAC) is a structured approach that assigns access rights based on user roles.

Encryption in transit and at rest further enhances security. Regular audits of database access logs help monitor unauthorized attempts and ensure compliance with security protocols.

Data anonymization techniques can also be used to protect sensitive information without losing analytical value. These methods ensure the safeguarding of data integrity and privacy, which is vital for data-driven decision-making.

Optimization and Performance Tuning

Optimizing SQL queries is crucial for improving performance in data manipulations.

Indexing is a common method to speed up data retrieval. However, excessive indexing can slow down updates, so balance is key.

Using partitioning helps in managing large datasets by breaking them into smaller, manageable pieces.

Proper use of caching and query optimization techniques can significantly reduce response times. Additionally, monitoring tools can identify bottlenecks and optimize resource allocation.

Efficient query structures and minimizing nested subqueries contribute to better performance, aiding business intelligence processes by providing timely insights.

Case Studies and Real-world Applications

A computer screen displaying SQL queries and data tables for machine learning models

Exploring the use of SQL in data manipulation for machine learning shines a light on critical areas like customer segmentation and healthcare data analysis. These fields leverage SQL to extract valuable insights from vast datasets, supporting data-driven decision-making and business intelligence.

Customer Segmentation in Retail

In retail, customer segmentation helps businesses group their customers based on buying behaviors and preferences.

By utilizing SQL data manipulation, retailers can create detailed customer profiles and identify trends. This enables personalized marketing strategies and enhances customer satisfaction.

SQL queries can sift through transaction histories, demographic data, and online behaviors. For example, retailers might examine purchase frequency or average spending per visit.

By analyzing this data, businesses can target promotions more effectively and increase sales efficiency.

Significant case studies have shown how companies use SQL for segmentation. They adjust inventory and layout based on customer data, demonstrating a practical application of business intelligence and improving customer experience.

This targeted approach not only boosts sales but also builds stronger customer relationships, reflecting the power of data-driven strategies.

Healthcare Data Analysis

In the healthcare sector, data analysis plays a crucial role in patient care and operational efficiency.

Using SQL, practitioners and administrators can manage and interpret massive datasets. This includes patient records, treatment outcomes, and resource allocation.

SQL helps hospitals track health trends, improve patient outcomes, and reduce costs. For instance, analyzing patient admission data allows healthcare providers to forecast patient needs and allocate resources effectively.

Real-world applications highlight the importance of SQL in this field. By using data-driven insights, healthcare organizations can enhance patient treatment plans and streamline operations.

These capabilities enable them to adapt to the demands of a rapidly evolving healthcare environment, demonstrating the practical benefits of SQL in improving patient care and institutional performance.

Frequently Asked Questions

A computer screen displaying SQL queries and machine learning model data manipulation

Data manipulation using SQL is crucial for preparing datasets for machine learning models. This process involves everything from data extraction to integration with Python for enhanced analysis and model training.

How can you perform data manipulation in SQL for training machine learning models?

Data manipulation in SQL involves using commands to clean, filter, and transform datasets.

SQL commands like SELECT, JOIN, WHERE, and GROUP BY help extract and refine data, making it suitable for machine learning models. By structuring data correctly, SQL prepares it for the model training phase.

What are some examples of SQL Server being used for machine learning?

SQL Server can be used to integrate custom models or for data pre-processing. It supports in-database analytics, enabling the execution of machine learning scripts close to the data source.

Techniques like these enhance model performance by reducing data movement and augmenting processing speed.

In what ways is SQL important for pre-processing data in machine learning workflows?

SQL is fundamental for cleaning and organizing data before feeding it into machine learning models.

It handles missing values, outlier detection, and feature engineering. SQL’s efficiency in data retrieval and preparation streamlines the pre-processing stage, leading to more accurate models.

How can Python and SQL together be utilized in a machine learning project?

Python and SQL complement each other by combining robust data handling with powerful analysis tools.

SQL fetches and manipulates data, while Python uses libraries like Pandas and scikit-learn for statistical analysis and model development. This integration allows seamless data flow and efficient machine learning processes.

What techniques are available for integrating SQL data manipulation into a machine learning model in Python?

One method involves using SQLAlchemy or similar libraries to query data and bring it into Pandas DataFrames.

This makes it easier to leverage Python’s machine learning tools to analyze and create models. Techniques like these allow data scientists to manipulate and analyze data effectively within Python.

What is the role of data manipulation through SQL when training a GPT model with custom data?

For GPT model training with custom data, SQL is used to extract, organize, and preprocess text data.

SQL ensures data is in the correct format and structure before it is inputted into the model. This step is vital for training the model effectively on specific datasets.